. 2024 Aug 12;52(14):8165-8183.
doi: 10.1093/nar/gkae478.

Increased transcriptional elongation and RNA stability of GPCR ligand binding genes unveiled via RNA polymerase II degradation

Affiliations

Increased transcriptional elongation and RNA stability of GPCR ligand binding genes unveiled via RNA polymerase II degradation

Lijun Bao et al. Nucleic Acids Res. .

Abstract

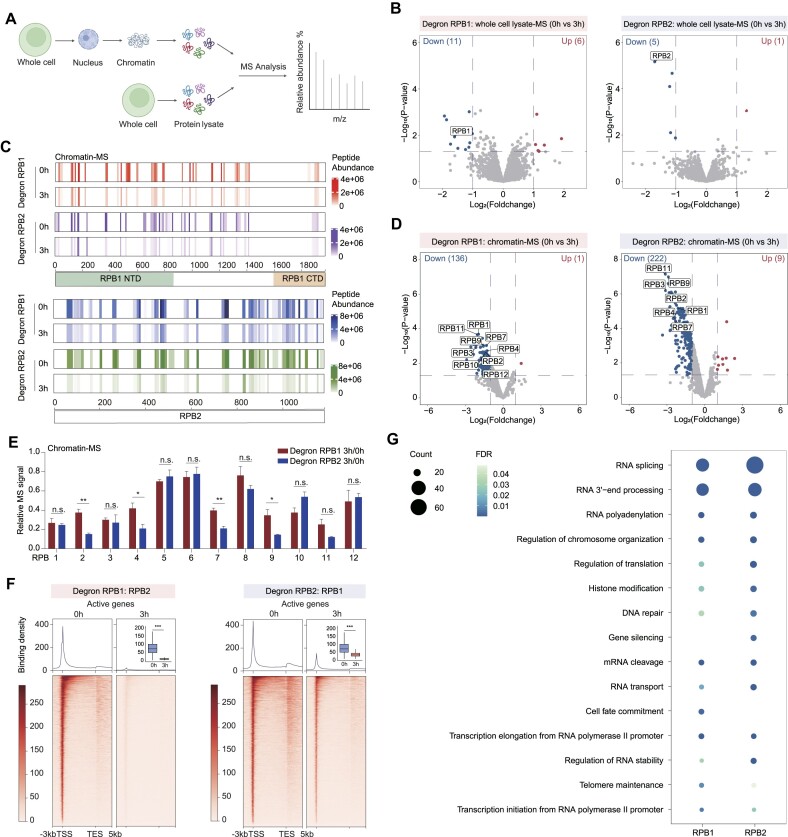
RNA polymerase II drives mRNA gene expression, yet our understanding of Pol II degradation is limited. Using auxin-inducible degron, we degraded Pol II's RPB1 subunit, resulting in global repression. Surprisingly, certain genes exhibited increased RNA levels post-degradation. These genes are associated with GPCR ligand binding and are characterized by being less paused and comprising polycomb-bound short genes. RPB1 degradation globally increased KDM6B binding, which was insufficient to explain specific gene activation. In contrast, RPB2 degradation repressed nearly all genes, accompanied by decreased H3K9me3 and SUV39H1 occupancy. We observed a specific increase in serine 2 phosphorylated Pol II and RNA stability for RPB1 degradation-upregulated genes. Additionally, α-amanitin or UV treatment resulted in RPB1 degradation and global gene repression, unveiling subsets of upregulated genes. Our findings highlight the activated transcription elongation and increased RNA stability of signaling genes as potential mechanisms for mammalian cells to counter RPB1 degradation during stress.


Figures

Graphical Abstract
Graphical Abstract
Figure 1.
Figure 1.
Acute RPB1 and RPB2 degradation induces global Pol II depletion. (A) Schematic workflow to identify differential proteins in whole cell lysate-MS and chromatin-MS after RPB1 and RPB2 degradation, respectively. Created with BioRender.com. (B) Volcano plots of protein abundance changes from whole cell lysate-MS data of cells with RPB1 (left) or RPB2 (right) depletion, compared with the corresponding untreated cells. Differential proteins were determined with P-value < 0.05 and Log2(Foldchange) > 1 or Log2(Foldchange) < –1. (C) Heatmaps indicating peptide abundance of RPB1 (top) and RPB2 (bottom) after RPB1 or RPB2 degradation based on chromatin-MS. Peptide abundance was calculated as the mean value of three replicates. (D) Volcano plots of protein abundance changes from chromatin lysate-MS data of cells with RPB1 (left) or RPB2 (right) depletion, compared with the corresponding untreated cells. Differential proteins were determined with P-value < 0.05 and Log2(Foldchange) > 1 or Log2(Foldchange) < –1. (E) Bar plot indicating protein abundance changes of 12 Pol II subunits in chromatin-MS after RPB1 and RPB2 degradation, respectively. Protein abundance of 3h degradation was normalized to 0 h data. The values were plotted as the means ± SEMs. Statistical significance was determined by a two-tailed t test with 3 replicates. n.s. not significant. *P < 0.05, **P < 0.01. (F) Metagene profiles of normalized RPB2 and RPB1 ChIP-seq reads after RPB1 or RPB2 degradation in active genes (n = 9077), respectively. Active genes were defined as genes with RPKM > 1 in TT-seq. The box plots showed the comparison of changes in the transcription start sites (TSSs). Statistical significance was assessed by a two-sided Wilcoxon test. ***P < 0.001. (G) Gene functional enrichment analysis of differential proteins after RPB1 or RPB2 degradation in chromatin-MS. The size of circles indicated protein counts of each term, and the colors indicated FDR.
Figure 2.
Figure 2.
RPB1 degradation resulted in increased gene expression for subsets of genes. (A) Schematic workflow to identify Pol II degradation-upregulated genes. Pol II degradation-upregulated genes were overlap upregulated genes in the RPB1 NTD and CTD degradation RNA-seq with RPKM > 1. (B)Tracks for Shisa2 which is a Pol II degradation-upregulated gene of different sequencing data after Pol II CTD or NTD degradation for the indicated durations. (C) Heatmap showing Log2(Foldchange) of Pol II degradation-upregulated genes in different sequencing data. (D) Metagene profiles of normalized TT-seq reads after RPB1 degradation in active genes. The box plots showed the comparison of changes in the gene body regions. Statistical significance was assessed by a two-sided Wilcoxon test. ***P < 0.001. (E) Empirical cumulative density function (ECDF) and violin plots showing the changes in the readthrough index of upstream genes of Pol II degradation-upregulated genes induced by Pol II NTD degradation based on TT-seq signals. The upstream genes were extracted as the nearest upstream genes of Pol II degradation-upregulated genes according to GENCODE annotation (M23). Statistical significance was assessed using a two-sided Wilcoxon test. n.s. not significant. (F) Metagene profiles of normalized Pol II ChIP-seq reads after RPB1 degradation in Pol II degradation-upregulated genes. The box plots showed the comparison of changes in TSSs. Statistical significance was assessed by a two-sided Wilcoxon test. ***P < 0.001. (G) Metagene profiles of normalized RPB2 and RPB1 ChIP-seq reads after RPB1 or RPB2 degradation in Pol II degradation-upregulated genes, respectively. The box plots showed the comparison of changes in the transcription start sites (TSSs). Statistical significance was assessed by a two-sided Wilcoxon test. ***P < 0.001. (H) Violin plot showing Log2(Foldchange) of Pol II degradation-upregulated genes after 12 Pol II subunits degradation.
Figure 3.
Figure 3.
Pol II degradation-upregulated were enriched in GPCR ligand binding, polycomb bound and less paused short genes. (A) Gene functional analysis of Pol II degradation-upregulated genes. The bar plot indicated the gene ratio of each term, and the scatter on each bar indicated the –Log10(FDR). (B) List of transcription factor motifs that were enriched in Pol II degradation-upregulated genes, and the corresponding p-values (which are calculated using HOMER with cumulative binomial distributions) is shown. (C) Metagene profiles of Pol II ChIP-seq reads in ctrl genes (length < 10 kb, without histone genes and non-upregulated) and Pol II degradation-upregulated genes. The box plots showed the comparison of ctrl genes and Pol II degradation-upregulated genes in TSSs (left) and gene body regions (right). Statistical significance was assessed by a two-sided Wilcoxon test. ***P < 0.001. (D) ECDF and violin plots showing the changes in the pausing index of ctrl genes and Pol II degradation-upregulated genes based on Pol II ChIP-seq signals. Statistical significance was assessed using a two-sided Wilcoxon test. ***P < 0.001. (E) Bar plot showing the ratio of polycomb genes in Pol II degradation-upregulated genes and ctrl genes. Statistical significance was assessed using Pearson's Chi-squared test. ***P < 0.001. (F) Lisa analysis identifying potential regulators for Pol II degradation-upregulated genes with setting ctrl genes as background in ‘Background Gene Set’ options in http://lisa.cistrome.org/. The y axis indicating the –Log10(P-value) of the most relevant samples of indicated transcription factors and the x axis indicating the ranking of enriched transcription factors. The grey dashed line showed the cut off of P-value = 0.05. H3K27me3 modification related, histone modification related and the top3 indicated regulators were indicated as red, black and blue, respectively. (G) Gene set enrichment analysis (GSEA) of RNA-seq data after Pol II CTD degradation. All genes were classified into 3 groups: Short (0–10 kb), Medium (10–75 kb) and Long (>75 kb) according to GENCODE annotation (M23). The x axis indicating the ranking of Log2(Foldchange) in RNA-seq data, and the y axis indicating the enrichment score. The FDR and NES in the top right-hand corner indicating the false discovery rate and normalized enrichment score, respectively. NA indicated not significant. Up regulated genes were enriched in the Short group, and down regulated genes were enriched in the Long group. The Medium group is not significant.
Figure 4.
Figure 4.
RPB1 degradation resulted in decreased H3K27me3 occupancy, while RPB2 degradation led to decreased H3K9me3. (A–C) Metagene profiles of normalized binding density of H3K27me3, H3K4me3 and H3K9me3 at the TSSs of Pol II degradation-upregulated genes after RPB1 (left) and RPB2 (right) degradation, respectively. The box plots showed the comparison of changes in the TSSs. Statistical significance was assessed by a two-sided Wilcoxon test. n.s. not significant. **P < 0.01, ***P < 0.001. (D) Tracks (left) for Htr5a which is a Pol II degradation-upregulated gene of H3K27me3, H3K4me3 and H3K9me3 binding after RPB1 and RPB2 degradation, respectively. The bar plot (right) showed the comparison of changes in the –3 kb to +3 kb of TSSs for indicated track data. The values were plotted as the means ± SEMs. Statistical significance was determined by a two-tailed t test with two replicates. n.s. not significant. *P < 0.05, **P < 0.01. (E–G) Metagene profiles of normalized binding density of KDM6B, EZH2 and SUV39H1 at the TSSs of Pol II degradation-upregulated genes after RPB1 (left) and RPB2 (right) degradation, respectively. The box plots showed the comparison of changes in the TSSs. Statistical significance was assessed by a two-sided Wilcoxon test. n.s. not significant. ***P < 0.001. (H) Tracks (left) for Htr5a which is a Pol II degradation-upregulated gene of KDM6B, EZH2 and SUV39H1 binding after RPB1 and RPB2 degradation, respectively. The bar plot (right) showed the comparison of changes in the –3 kb to +3 kb of TSSs for indicated track data. The values were plotted as the means ± SEMs. Statistical significance was determined by a two-tailed t test with two replicates. n.s. not significant. n.s. not significant. *P < 0.05
Figure 5.
Figure 5.
RPB1 degradation resulted in increased pSer2 occupancy in Pol II degradation-upregulated genes. (A) Tracks (left) for Cnn1 which is a Pol II degradation-upregulated gene of time-course pSer2 ChIP-seq after RPB1 (top) and RPB2 (bottom) degradation. The bar plot (right) showed the comparison of changes in the gene body regions for indicated track data. The values were plotted as the means ± SEMs. Statistical significance was determined by a two-tailed t test with two replicates. n.s. not significant. *P < 0.05, **P < 0.01. (B) Violin plot showing Log2(Foldchange) of normalized pSer2 ChIP-seq reads of Pol II degradation-upregulated genes in indicated time point compared with 0min. Statistical significance was assessed by a two-sided Wilcoxon test. n.s. not significant. *P < 0.05, **P < 0.01, ***P < 0.001. (C) Tracks (left) for Bcat1 which is an active gene of time-course pSer2 ChIP-seq after RPB1 (top) and RPB2 (bottom) degradation. The bar plot (right) showed the comparison of changes in the gene body regions for indicated track data. The values were plotted as the means ± SEMs. Statistical significance was determined by a two-tailed t test with two replicates. n.s. not significant. *P < 0.05, ***P < 0.001. (D) Violin plot showing Log2(Foldchange) of normalized pSer2 ChIP-seq reads of active genes in indicated time point compared with 0min. Statistical significance was assessed by a two-sided Wilcoxon test. n.s. not significant, ***P < 0.001. (E) RPB1 pSer2 ChIP-qPCR analysis of gene body regions of selected Pol II degradation-upregulated genes after degradation of RPB1 (left) and RPB2 (right) for 3 h. Bcat1 and Dhx9 were active genes control. The values were normalized to input and plotted as the means ± SEMs. Statistical significance was determined by a two-tailed t test with at least three replicates. *P < 0.05, **P < 0.01, ***P < 0.001. (F) Similar as (E) RPB1 pSer5 ChIP-qPCR analysis of TSSs of selected Pol II degradation-upregulated genes after degradation of RPB1 (left) and RPB2 (right) for 3 h. Bcat1 and Dhx9 were active genes control. The values were normalized to input and plotted as the means ± SEMs. Statistical significance was determined by a two-tailed t test with at least three replicates. *P < 0.05, **P < 0.01, ***P < 0.001.
Figure 6.
Figure 6.
Elevated RNA half-life contributes to the upregulation of specific genes following RPB1 depletion. (A) Schematic workflow of 4sU pulse chase experiments. (B) Principal component analysis (PCA) of read counts in different time point after 4sU wash out in untreated and RPB1 degradation cells. (C) Empirical cumulative density function (ECDF) (left), density plot (middle) and violin plot (right) indicating RNA half-life of Pol II degradation-upregulated genes (top) and active genes (bottom) before and after RPB1 degradation. Statistical significance was assessed using a two-sided Wilcoxon test. ***P < 0.001. (D) Scatter plot showing the Log2(Foldchange) of TT-seq and 4sU pulse chase RNA-seq of Pol II degradation-upregulated genes before and after RPB1 degradation (3h). Green, TT-seq > 0 and 4sU pulse chase > 0, blue, TT-seq < 0 and 4sU pulse chase > 0, red, TT-seq > 0 and 4sU pulse chase < 0. Note: some Pol II degradation-regulated genes were identified by RNA-seq, but showed decreased TT-seq signals, which may reflect the variations between different techniques. (E) MA-plot showing the mean expression and Log2(Foldchange) of Pol II degradation-upregulated genes (red), and active genes (blue) before (0 h) and after 1 h (Left), 3 h (Middle) and 12 h (Right) RPB1 degradation, respectively. (F) RT-qPCR of selected Pol II degradation-upregulated genes (Shisa2, Nrarp, Snai1), stable gene (Gapdh) and active gene (Bcat1) from 4sU pause chase labeled RNA after RPB1 degradation. The values were firstly normalized to Drosophila_CG10433 transcript expression, and then normalized to the values of 0 h. Bar plots were shown as means ± SEMs. Statistical significance was determined by a two-tailed t test with at least three replicates. n.s. not significant. *P < 0.05, **P < 0.01, ***P < 0.001.
Figure 7.
Figure 7.
α-Amanitin and UV treatment caused the degradation of RPB1 and activated the expression of subsets of genes. (A) Western blot analysis of RPB1 after α-amanitin treatment for 24 h (left), and UV irradiation with 3 h recovery (right). (B) Scatterplots showing gene expression changes after α-amanitin treatment for 24 h (top) and UV irradiation with 12 h recovery (bottom). Blue points indicated active genes, and red points indicated Pol II degradation-upregulated genes. (C) Heatmap showing the Log2(Foldchange) of Pol II degradation-upregulated genes after α-amanitin treatment for 24 h (left) and UV irradiation with 12 h recovery (right). (D) Violin plot showing the Log2(Foldchange) of Pol II degradation-upregulated genes after α-amanitin treatment for 24 h (left) and UV irradiation with 12 h recovery (right). Statistical significance was assessed by a two-sided Wilcoxon test. ***P < 0.001. (E) Venn plot showing the overlap of up-regulated genes after α-amanitin treatment for 24 h and UV irradiation with 12 h recovery with P-value < 0.05 and Log2(Foldchange) > 1, and Pol II degradation-upregulated genes. (F) Tracks for Popdc2 (top) and Bcat1 (bottom) which are Pol II degradation-upregulated gene and active gene of RNA-seq after α-amanitin treatment for 24 h and UV irradiation with 12 h recovery, respectively. (G) Gene functional analysis of up-regulated genes after α-amanitin treatment for 24 h (left) and UV irradiation with 12 h recovery (right). (H) RPB1 pSer2 (left) and RPB1 pSer5 (right) ChIP-qPCR analysis of gene body regions and TSSs of selected Pol II degradation-upregulated genes after treatment with UV irradiation with 3 h recovery, respectively. The values were normalized to input and plotted as the means ± SEMs. Statistical significance was determined by a two-tailed t test with at least three replicates. *P < 0.05, **P < 0.01, ***P < 0.001. (I) A model illustrating our findings. Created with BioRender.com.

Similar articles

References

    1. Chen X., Xu Y.. Structural insights into assembly of transcription preinitiation complex. Curr. Opin. Struct. Biol. 2022; 75:102404. - PubMed
    1. Girbig M., Misiaszek A.D., Müller C.W.. Structural insights into nuclear transcription by eukaryotic DNA-dependent RNA polymerases. Nature reviews. Nat. Rev. Mol. Cell Biol. 2022; 23:603–622. - PubMed
    1. Huang J., Ji X.. Never a dull enzyme, RNA polymerase II. Transcription. 2023; 14:49–67. - PMC - PubMed
    1. Schier A.C., Taatjes D.J.. Structure and mechanism of the RNA polymerase II transcription machinery. Genes Dev. 2020; 34:465–488. - PMC - PubMed
    1. Werner F., Grohmann D.. Evolution of multisubunit RNA polymerases in the three domains of life. Nat. Rev. Microbiol. 2011; 9:85–98. - PubMed

MeSH terms

LinkOut - more resources