. 2024 Jun 6;134(15):e176402.
doi: 10.1172/JCI176402.

PIK3CA inhibition in models of proliferative glomerulonephritis and lupus nephritis

Affiliations

PIK3CA inhibition in models of proliferative glomerulonephritis and lupus nephritis

Junna Yamaguchi et al. J Clin Invest. .

Abstract

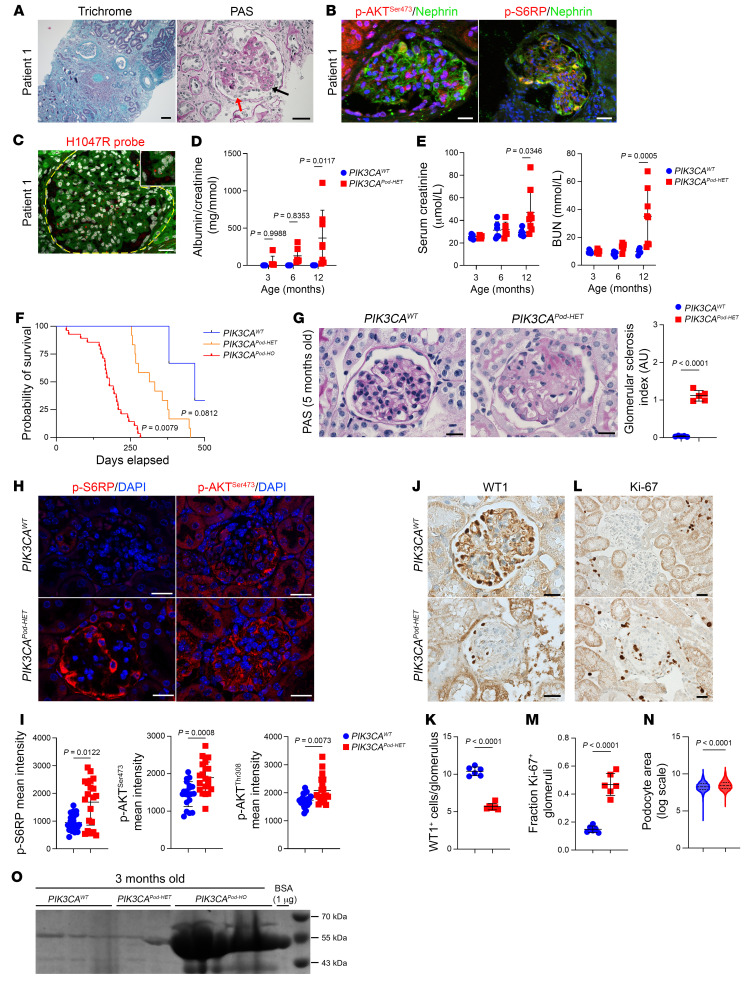
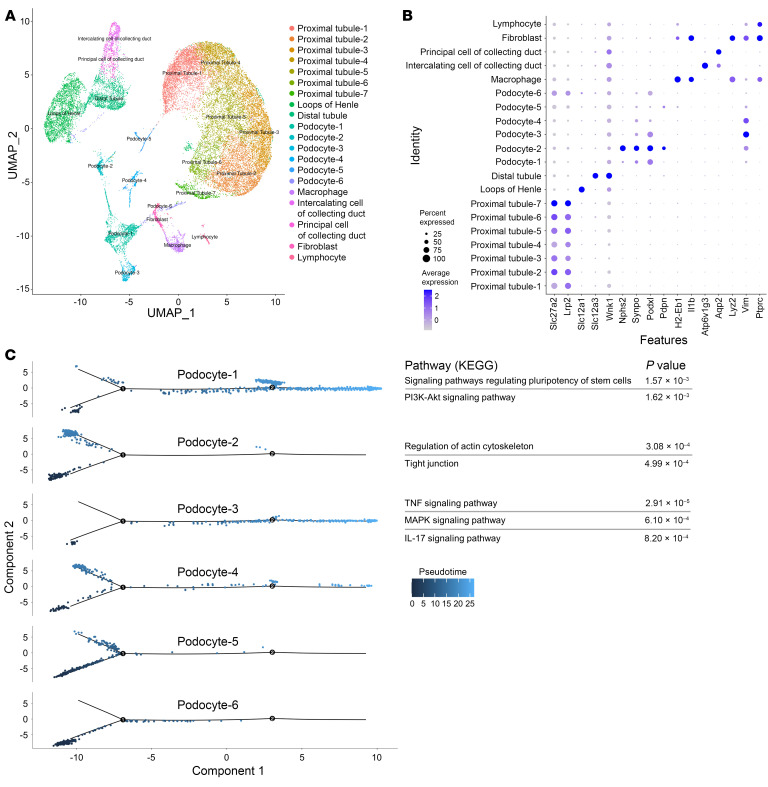
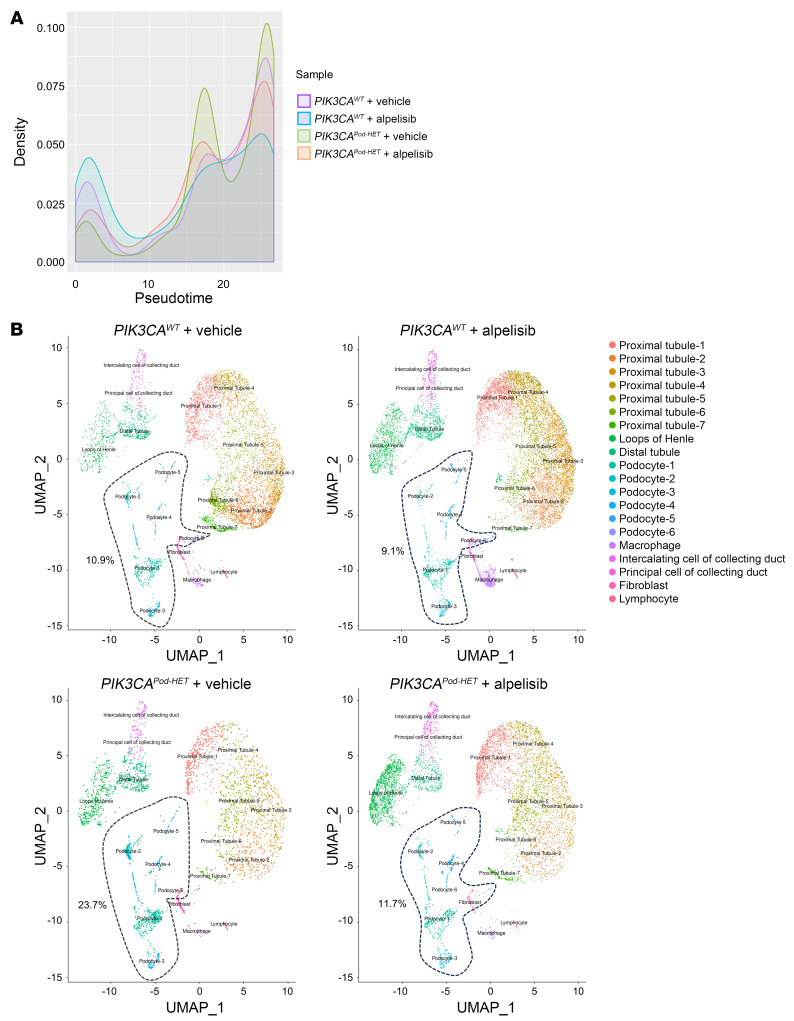
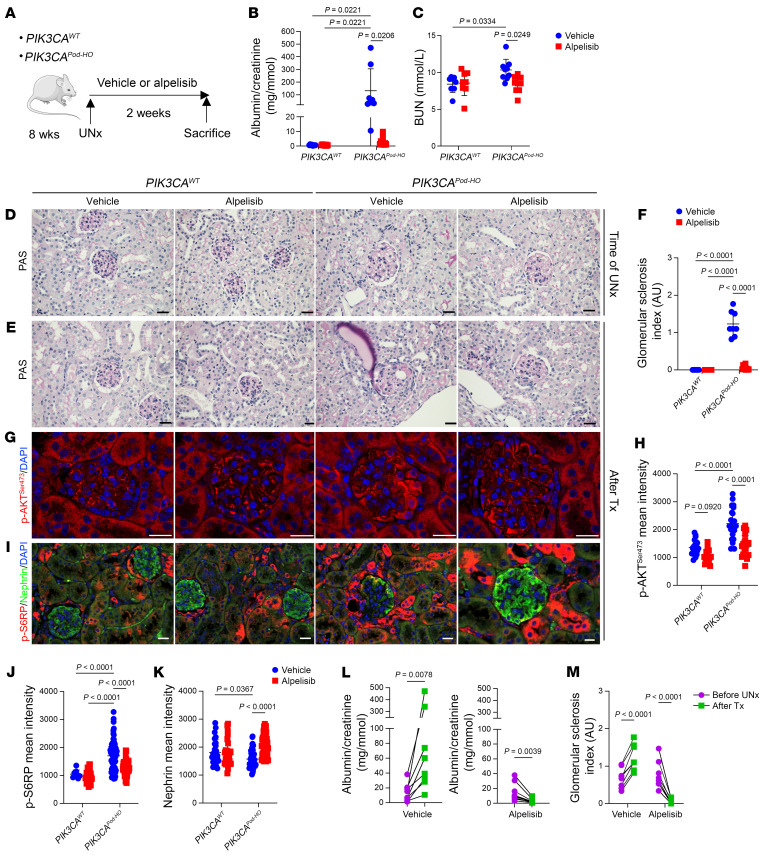
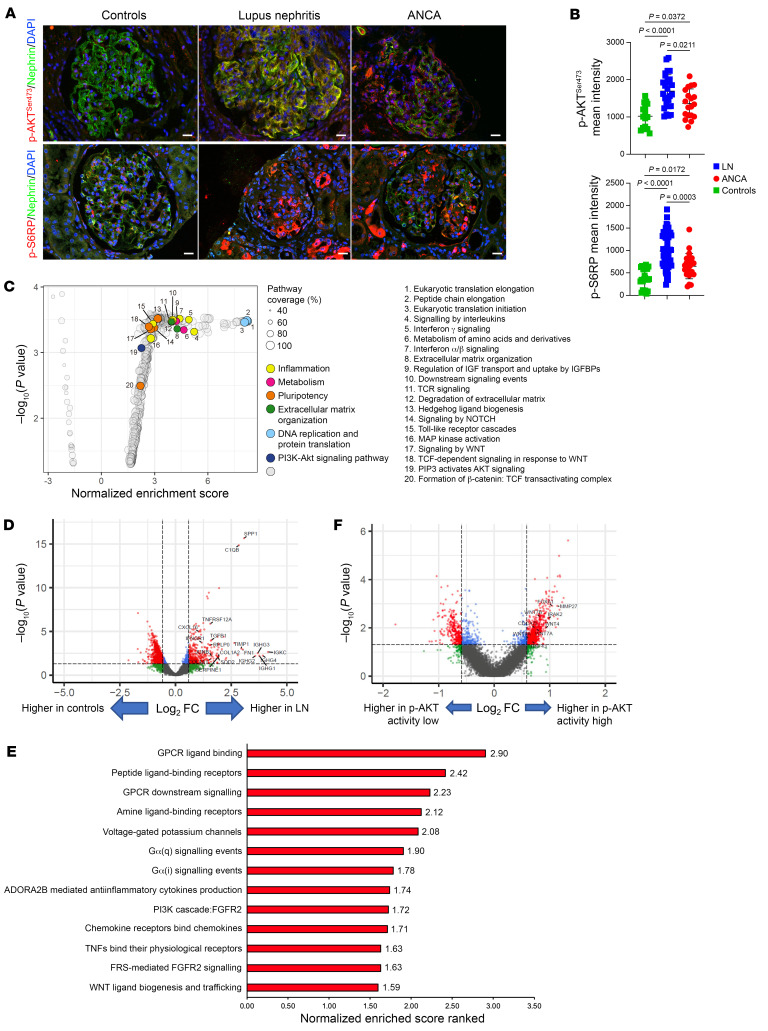
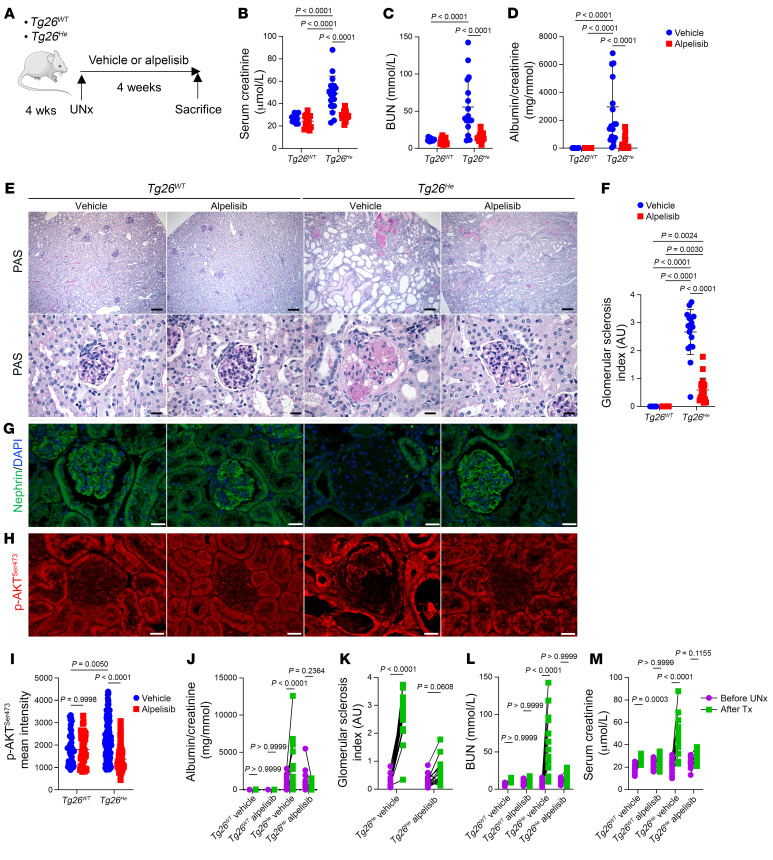
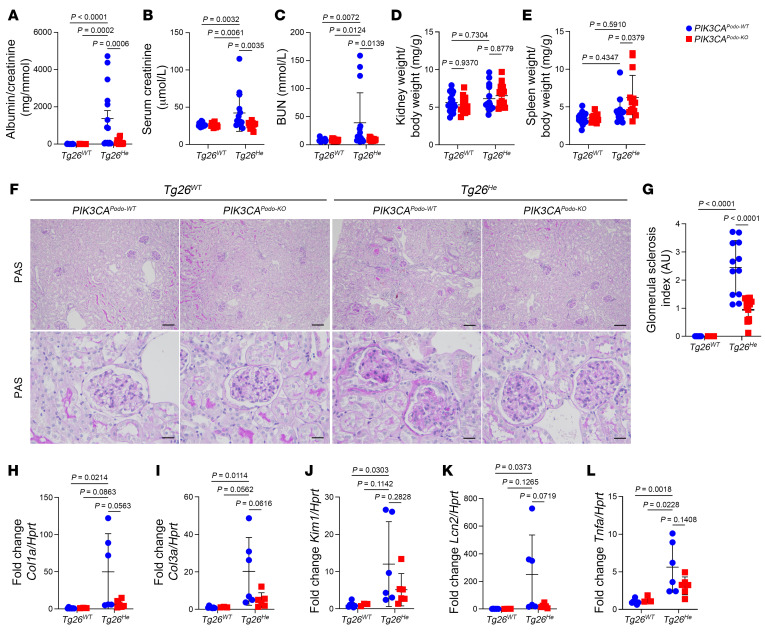
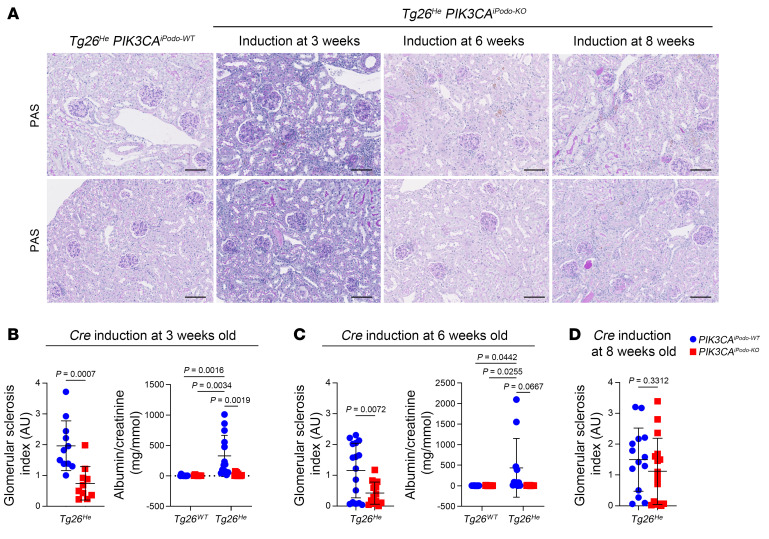
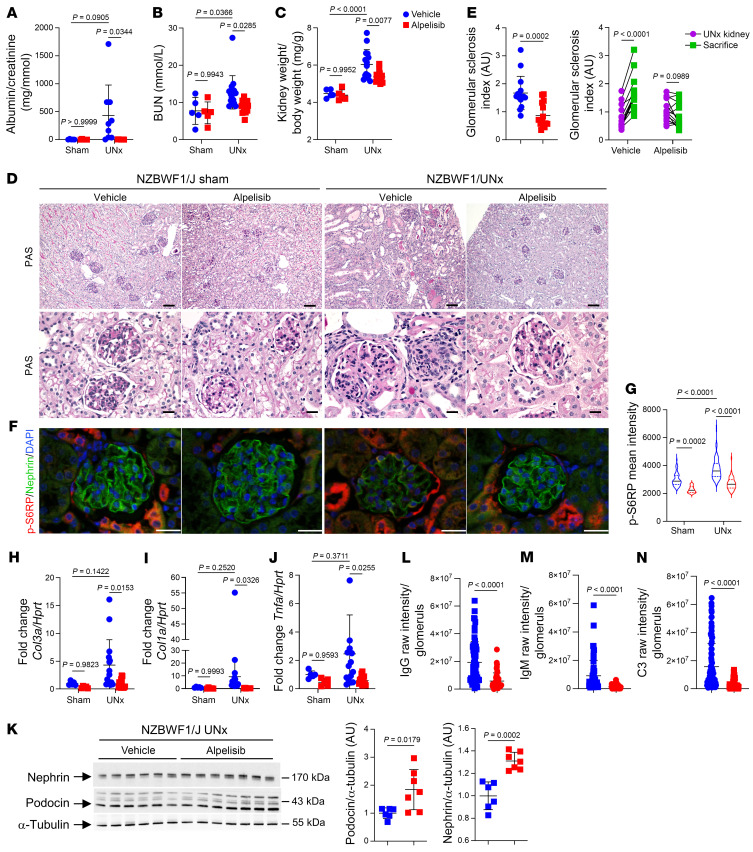
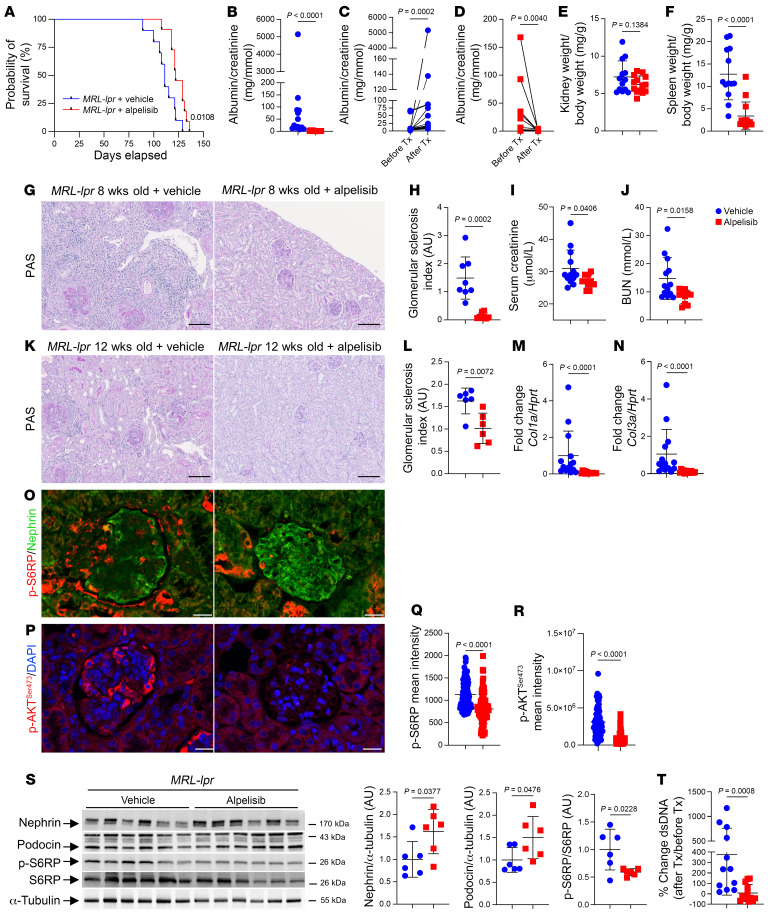
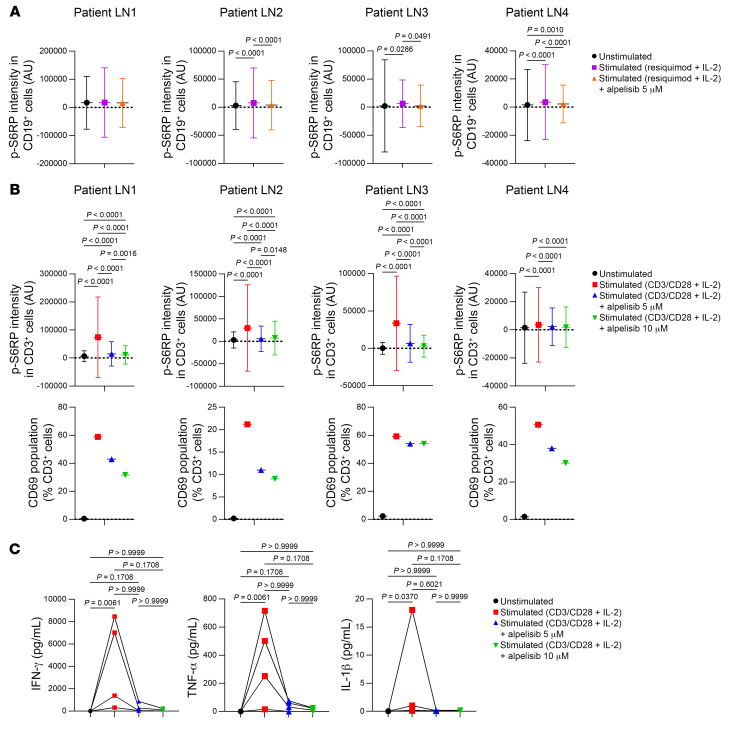
Proliferative glomerulonephritis is a severe condition that often leads to kidney failure. There is a significant lack of effective treatment for these disorders. Here, following the identification of a somatic PIK3CA gain-of-function mutation in podocytes of a patient, we demonstrate using multiple genetically engineered mouse models, single-cell RNA sequencing, and spatial transcriptomics the crucial role played by this pathway for proliferative glomerulonephritis development by promoting podocyte proliferation, dedifferentiation, and inflammation. Additionally, we show that alpelisib, a PI3Kα inhibitor, improves glomerular lesions and kidney function in different mouse models of proliferative glomerulonephritis and lupus nephritis by targeting podocytes. Surprisingly, we determined that pharmacological inhibition of PI3Kα affects B and T lymphocyte populations in lupus nephritis mouse models, with a decrease in the production of proinflammatory cytokines, autoantibodies, and glomerular complement deposition, which are all characteristic features of PI3Kδ inhibition, the primary PI3K isoform expressed in lymphocytes. Importantly, PI3Kα inhibition does not impact lymphocyte function under normal conditions. These findings were then confirmed in human lymphocytes isolated from patients with active lupus nephritis. In conclusion, we demonstrate the major role played by PI3Kα in proliferative glomerulonephritis and show that in this condition, alpelisib acts on both podocytes and the immune system.

Keywords: Molecular biology; Nephrology.


Conflict of interest statement

Conflict of interest: A patent application (“BYL719 [alpelisib] for use in the treatment of PIK3CA-related overgrowth spectrum,” WO2017140828A1) has been filed by INSERM, CNRS, Université Paris Cité, and AP-HP for the use of BYL719 (alpelisib) in the treatment of PIK3CA-related overgrowth spectrum (PROS/CLOVES syndrome). GC is the inventor. This patent is licensed to Novartis. A patent application (“Methods for the treatment of proliferative glomerulonephritis,” EP22306011.2) has been filed by INSERM, CNRS, Université Paris Cité, and AP-HP. GC and JY are the inventors. GC receives or has received consulting fees from Novartis, Vaderis, Alkermes, IPSEN, and BridgeBio.

Figures

Figure 1
Figure 1. PIK3CA gain-of-function mutation in podocytes leads to severe glomerular disease.
(AC) Patient 1 kidney. (A) Masson’s trichrome and PAS staining. Black arrow shows hypercellularity. Red arrow shows hypertrophy and hyperplasia of the overlying podocytes. (B) p-AKTSer473 or p-S6RP coimmunofluorescent staining with nephrin. (C) In situ PIK3CA H1047R hybridization. The yellow dashed line outlines the glomerulus. Red dots are mutation-positive points. (D and E) Urinary albumin/creatinine ratio, serum creatinine, and blood urea nitrogen (BUN) of PIK3CAWT and PIK3CAPod-HET mice with aging. Three-month-old PIK3CAWT, n = 5; 3-month-old PIK3CAHET, n = 6; 6-month-old PIK3CAWT, n = 6; 6-month-old PIK3CAHET, n = 6; 12-month-old PIK3CAWT, n = 6; 12-month-old PIK3CAHET, n = 8. (F) Kaplan-Meier curves of PIK3CAWT (n = 27), PIK3CAPod-HET (n = 12), and PIK3CAPod-HO mice (n = 28). (GM) Five-month-old PIK3CAWT and PIK3CAPod-HET mouse kidneys. (G) PAS and glomerular sclerosis (GS) index quantification (n = 5 mice per group). (H) p-S6RP and p-AKTSer473 immunofluorescent staining. (I) Glomerular p-S6RP, p-AKTSer473, and p-AKTThr308 quantification (n = 5 mice per group). (JM) Representative WT1 or Ki-67 immunostaining and quantification (n = 6 mice per group). (N) Amnis ImageStream analysis of podocytes of 4-month-old PIK3CAWT and PIK3CAPod-HET mice (n = 3 per group). (O) Coomassie blue staining of PIK3CAWT, PIK3CAPod-HET, and PIK3CAPod-HO mice. Values are the mean ± SD. P values calculated using 2-way ANOVA with Tukey’s post hoc test (D and E), log-rank (Mantel-Cox) test (F), 2-tailed Mann-Whitney U test (I), or 2-tailed Student’s t test (G, K, M, and N). Scale bars: 100 μm (A, trichrome), 40 μm (A, PAS), 20 μm (B, C, and H), 25 μm (G), and 32.2 μm (J and L).
Figure 2
Figure 2. PIK3CA gain-of-function mutation in podocytes is associated with changes in cell fate determination.
(A) Unsupervised clustering resulted in 20 distinct cell types in the UMAP plot. (B) Expression of cell-type-specific markers in the annotated clusters. The cell percentage expressing the gene is indicated by the dot’s size, and the average expression of the gene is indicated by the color concentration. (C) Cell trajectory map of each podocyte cluster showing the pseudotime. The significant pathways resulting from the KEGG pathway analysis (see Supplemental Table 2) are displayed adjacent to podocyte clusters 1, 2, and 3.
Figure 3
Figure 3. Alpelisib modifies podocyte cell fate determination in PIK3CAPod-HET mice.
(A) Histogram showing the distribution of podocyte clusters 1–6 along pseudotime for each sample. PIK3CAPod-HET vehicle-treated mouse podocytes show a distinct distribution. (B) UMAP plot per sample showing the populational change for podocyte clusters. Podocyte clusters 1–6 are indicated by dotted lines that encompass their respective percentages of total cells in each sample.
Figure 4
Figure 4. Alpelisib improves kidney lesions in uninephrectomized PIK3CAPod-HO mice.
(A) Experimental protocol design. UNx, uninephrectomy. (BM) n = 8 for PIK3CAWT-vehicle, PIK3CAWT-alpelisib, PIK3CAHO-vehicle, and n = 9 for PIK3CAHO-alpelisib, unless otherwise stated. (B and C) Urinary albumin/creatinine ratio and BUN of PIK3CAWT and PIK3CAPod-HO mice at sacrifice (2 weeks of treatment following UNx). (D) Representative PAS staining of UNx kidneys from PIK3CAWT and PIK3CAPod-HO mice. (EK) Kidneys from PIK3CAWT and PIK3CAPod-HO mice at sacrifice. (E) PAS staining and (F) glomerular sclerosis (GS) index. (G) p-AKTSer473 immunofluorescent staining and (H) p-AKTSer473 quantification of glomeruli (n = 5 mice per group). Tx, treatment. (I) p-S6RP/nephrin coimmunofluorescent staining and their glomerular quantification (J and K) (n = 5 mice per group). (L) Trajectory of the albumin/creatinine ratio in the urine, and (M) trajectory of GS index of PIK3CAPod-HO mice following UNx and treated with either vehicle or alpelisib. Data are represented as mean ± SD from 3 independent experiments (B, C, F, L, and M) or mean ± SD and representative of 3 independent experiments (H, J, and K). P values were calculated using 2-way ANOVA with Tukey’s post hoc test (B, C, F, H, J, and K), Wilcoxon’s matched-pairs signed-rank test (L), or 2-way ANOVA with Bonferroni’s multiple-comparison test (M). Scale bars: 32.2 μm (D and E) and 20 μm (G and I). Some data are identical between B and L.
Figure 5
Figure 5. Spatial transcriptomic changes observed in glomeruli from patients with class 4 lupus nephritis.
(A) Representative coimmunofluorescent staining of nephrin/p-AKTSer473 (frozen section) and nephrin/p-S6RP in kidney biopsies from patients with lupus nephritis (LN), ANCA vasculitis, or controls (n = 4 patients per group). (B) Glomerular p-AKTSer473 and p-S6RP quantification (n = 4 patients per group). (C) GSEA mapping from the Reactome database for LN versus controls. Some of the pathways of interest that are enriched in LN samples are highlighted in colored dots as follows: inflammation related in yellow, metabolism related in magenta, pluripotency related in orange, extracellular matrix organization related in green, DNA replication and protein translation related in light blue, and PI3K/AKT signaling pathway related in navy blue. Gray circles indicate “other.” (D) Volcano plot between controls and LN samples. Significantly differentially expressed genes are indicated by red dots. FC, fold change. (E) Bar plot of the top normalized enrichment score–ranked gene sets (Hallmark, GSEA) with P < 0.001 in LN p-AKT activity–high kidneys compared with LN p-AKT activity–low ROIs. (F) Volcano plot between the LN p-AKT activity–high and LN p-AKT activity–low ROIs. Significantly differentially expressed genes are indicated by red dots. Data are represented as mean ± SD, and P values were calculated using 1-way ANOVA with Tukey’s post hoc test (B). Scale bars: 20 μm (A).
Figure 6
Figure 6. Alpelisib improves kidney lesions in an accelerated mouse model of collapsing glomerulopathy.
(A) Experimental protocol design. (BM) Tg26WT and Tg26He mice at the time of sacrifice (n = 16 for Tg26WT-vehicle, n = 15 for Tg26WT-alpelisib, n = 18 for Tg26He-vehicle, n = 19 for Tg26He-alpelisib, unless otherwise stated). (B) Serum creatinine. (C) BUN. (D) Urinary albumin/creatinine ratio. (E) Representative PAS staining of kidneys. (F) Glomerular sclerosis (GS) index quantification. (G) Representative nephrin immunofluorescent staining of kidneys. (H) Representative p-AKTSer473 immunofluorescence and its glomerular quantification (I) from Tg26WT and Tg26He mouse kidneys at sacrifice (n = 6 mice per group). (J) The urinary albumin/creatinine ratio trajectory of Tg26WT and Tg26He mice following uninephrectomy (UNx) and treatment (Tx). (K) GS index trajectory between UNx and sacrifice kidneys of Tg26He mice. (L) BUN. (M) Serum creatinine level trajectory of Tg26WT and Tg26He mice following UNx and Tx. Data are represented as mean ± SD and are from 6 independent experiments (BF and JM), or are mean ± SD and representative of 3 independent experiments (H and I). P values calculated using 2-way ANOVA with Tukey’s post hoc test (BD, F, and I) or 2-way ANOVA with Bonferroni’s multiple-comparison test (JM). Scale bars: 130 μm (E, upper), 32.2 μm (E, lower), and 20 μm (G and H). Note: some data are shared between B and M, C and L, D and J, and G and K.
Figure 7
Figure 7. PIK3CA deletion in podocytes improves kidney lesions in an accelerated mouse model of collapsing glomerulopathy.
(AG) Fifteen-week-old Tg26WT PIK3CAPodo-WT (n = 18), Tg26WT PIK3CAPodo-KO (n = 14), Tg26He PIK3CAPodo-WT (n = 15), and Tg26He PIK3CAPodo-KO mice (n = 15). (A) Urinary albumin/creatinine ratio. (B) Serum creatinine level. (C) BUN level. (D) Kidney-to–body weight ratio. (E) Spleen-to–body weight ratio. (F) Representative PAS staining of kidneys. (G) Glomerular sclerosis (GS) index quantification. (H) Col1a, (I) Col3a, (J) Kim1, (K) Lcn2, and (L) Tnfa quantification of qRT-PCR analysis in the kidney cortex from 15-week-old Tg26WT PIK3CAPodo-WT (n = 7), Tg26WT PIK3CAPodo-KO (n = 3), Tg26He PIK3CAPodo-WT (n = 6), and Tg26He PIK3CAPodo-KO mice (n = 6). Data are represented as mean ± SD from at least 3 independent experiments (AE and GL). P values calculated using 2-way ANOVA with Tukey’s post hoc test (AE and GL). Scale bars: 130 μm (F, upper) and 32.2 μm (F, lower).
Figure 8
Figure 8. PIK3CA deletion in podocytes up to the age of 6 weeks is able to reverse kidney lesions in Tg26 mice.
(A) Representative PAS staining of the kidneys at 12 weeks from Tg26He with either PIK3CAiPodo-WT or PIK3CAiPodo-KO mice, which were induced with tamoxifen at different time points (3-week-old Tg26WT PIK3CAiPodo-WT, n = 10; 3-week-old Tg26WT PIK3CAiPodo-KO, n = 8; 3-week-old Tg26He PIK3CAiPodo-WT, n = 14; 3-week-old Tg26He PIK3CAiPodo-KO, n = 11; 6-week-old Tg26WT PIK3CAiPodo-WT, n = 10; 6-week-old Tg26WT PIK3CAiPodo-KO, n = 14; 6-week-old Tg26He PIK3CAiPodo-WT, n = 16; 6-week-old Tg26He PIK3CAiPodo-KO, n = 14; 8-week-old Tg26WT PIK3CAiPodo-WT, n = 10; 8-week-old Tg26WT PIK3CAiPodo-KO, n = 11; 8-week-old Tg26He PIK3CAiPodo-WT, n = 14; 8-week-old Tg26He PIK3CAiPodo-KO, n = 16). (BD) Glomerular sclerosis (GS) index quantification, and the urinary albumin/creatinine ratio of mice that were induced at indicated time points. Data are represented as mean ± SD from at least 3 independent experiments (BD). P values calculated using 2-way ANOVA with Tukey’s post hoc test (B, right; C, right) or 2-tailed Student’s t test (B, left; C, left; and D). Scale bars: 100 μm (A).
Figure 9
Figure 9. Alpelisib improves kidney lesions in NZBWF1/J lupus nephritis models.
(AJ) NZBWF1/J mice at sacrifice unless otherwise stated (sham-vehicle and sham-alpelisib, n = 5; UNx-vehicle and UNx-alpelisib, n = 15). (A) Urinary albumin/creatinine ratio. (B) BUN. (C) Kidney-to–body weight ratio. (D) Representative PAS staining. (E) Left: Glomerular sclerosis (GS) index quantification at sacrifice. Right: GS trajectory between uninephrectomy (UNx) and sacrifice of the same mouse. GS at sacrifice shared. (F) Representative p-S6RP/nephrin coimmunofluorescent staining and (G) quantification (n = 6 per group). (H) Col3a, (I) Col1a, and (J) Tnfa quantification by qRT-PCR in kidney cortex. (K) Western blot and quantification of nephrin, podocin, and α-tubulin in kidney cortex (UNx-vehicle, n = 6; UNx-alpelisib, n = 7). (L) IgG, (M) IgM, and (N) C3 raw intensity per glomerulus quantification of the immunofluorescent staining (UNx-vehicle, n = 6; UNx-alpelisib, n = 7). Data represented as mean ± SD from 3 independent experiments (AC, E, and GN). P values calculated using 2-way ANOVA with Tukey’s post hoc test (AC and GJ), 2-way ANOVA with Bonferroni’s multiple-comparisons test (E, right), 2-tailed Student’s t test (E, left and K), or 2-tailed Mann-Whitney U test (LN). Scale bars: 130 μm (D, upper), 32.2μm (D, lower), and 20 μm (F).
Figure 10
Figure 10. Alpelisib improves kidney lesions in MRL-lpr lupus nephritis models.
(AJ) MRL-lpr mouse survival experiment (vehicle, n = 13, alpelisib, n = 14, unless otherwise stated). (A) Kaplan-Meier curves.(B) Urinary albumin/creatinine ratio at sacrifice. (C and D) Trajectory of urinary albumin/creatinine ratio (after treatment [Tx] are identical to B). (E) Kidney-to–body weight ratio. (F) Spleen-to–body weight ratio. (G) Representative PAS staining. (H) Glomerular sclerosis (GS) index quantification (n = 8 per group). (I) Serum creatinine. (J) BUN at sacrifice. (KT) MRL-lpr treated either with vehicle or alpelisib from 12 until 16 weeks old (n = 6 per group except otherwise stated). (K) Representative PAS staining. (L) GS index quantification. (M) Col1a and (N) Col3a quantification by qRT-PCR in kidney cortex (n = 14 per group). (O) Representative p-S6RP/nephrin, (P) p-AKTSer473 immunofluorescent staining, and (Q and R) their quantification. (S) Western blot and quantification of nephrin, podocin, p-S6RP, S6RP, and α-tubulin in kidney cortex. (T) Serum dsDNA titer change ratio (after Tx vs. before Tx) (vehicle, n = 12; alpelisib, n = 13). Data represented as mean ± SD from 3 independent experiments (B, E, F, HJ, LN, and QT). P values calculated using log-rank (Mantel-Cox) test (A), 2-tailed Student’s t test (E, F, I, J, L, and S), Wilcoxon’s matched-pairs signed-rank test (C and D), or 2-tailed Mann-Whitney U test (B, H, M, N, Q, R, and T). Scale bars: 100 μm (G and K) and 20 μm (O and P).
Figure 11
Figure 11. Alpelisib impaired, in vitro, activation of B and T cells from lupus patients.
(A) p-S6RP intensity on day 1 in CD19+ B cells from 4 patients with active lupus nephritis (LN1–4) following stimulation and treated with vehicle or 5 μM alpelisib. LN1 unstimulated (n = 687 cells), LN1 stimulated (n = 1031 cells), LN1 stimulated + alpelisib (n = 668 cells), LN2 unstimulated (n = 6059 cells), LN2 stimulated (n = 7289 cells), LN2 stimulated + alpelisib (n = 7533 cells), LN3 unstimulated (n = 2623 cells), LN3 stimulated (n = 2442 cells), LN3 stimulated + alpelisib (n = 2161 cells), LN4 unstimulated (n = 12,542 cells), LN4 stimulated (n = 9224 cells), LN4 stimulated + alpelisib (n = 29,800 cells). (B) p-S6RP intensity and CD69+ population on day 1 among CD3+ T cells from LN1–4 following stimulation and treated with vehicle or alpelisib. LN1 unstimulated (n = 14,521 cells), LN1 stimulated (n = 5047 cells), LN1 stimulated + 5 μM alpelisib (n = 6589 cells), LN1 stimulated + 10 μM alpelisib (n = 7834 cells), LN2 unstimulated (n = 18,284 cells), LN2 stimulated (n = 8106 cells), LN2 stimulated + 5 μM alpelisib (n = 10,208 cells), LN2 stimulated + 10 μM alpelisib (n = 13,758 cells), LN3 unstimulated (n = 9066 cells), LN3 stimulated (n = 6176 cells), LN3 stimulated + 5 μM alpelisib (n = 6707 cells), LN3 stimulated + 10 μM alpelisib (n = 6570 cells), LN4 unstimulated (n = 12,542 cells), LN4 stimulated (n = 9224 cells), LN4 stimulated + 5 μM alpelisib (n = 29,800 cells), LN4 stimulated + 10 μM alpelisib (n = 27,863 cells). (C) Cytokine measurements on day 7 in supernatant from nonstimulated or stimulated CD3+ T cells, treated with the vehicle or 5 μM or 10 μM alpelisib. Patients LN1–4 are included in the analysis. IFN-γ, TNF-α, and IL-1β are shown here. Data presented as mean ± SD. P values calculated using 1-way ANOVA with Tukey’s post hoc test (A and B) or Friedman’s test with Dunn’s multiple-comparisons test (C).

Comment in

  • Genetic insights into the mechanisms of proliferative glomerulonephritis

References

    1. Bilanges B, et al. PI3K isoforms in cell signalling and vesicle trafficking. Nat Rev Mol Cell Biol. 2019;20(9):515–534. doi: 10.1038/s41580-019-0129-z. - DOI - PubMed
    1. Welch HC, et al. Phosphoinositide 3-kinase-dependent activation of Rac. FEBS Lett. 2003;546(1):93–97. doi: 10.1016/S0014-5793(03)00454-X. - DOI - PubMed
    1. Kurek KC, et al. Somatic mosaic activating mutations in PIK3CA cause CLOVES syndrome. Am J Hum Genet. 2012;90(6):1108–1115. doi: 10.1016/j.ajhg.2012.05.006. - DOI - PMC - PubMed
    1. Keppler-Noreuil KM, et al. Clinical delineation and natural history of the PIK3CA-related overgrowth spectrum. Am J Med Genet A. 2014;164A(7):1713–1733. doi: 10.1002/ajmg.a.36552. - DOI - PMC - PubMed
    1. Keppler-Noreuil KM, et al. PIK3CA-related overgrowth spectrum (PROS): diagnostic and testing eligibility criteria, differential diagnosis, and evaluation. Am J Med Genet A. 2015;167A(2):287–295. doi: 10.1002/ajmg.a.36836. - DOI - PMC - PubMed

MeSH terms