. 2024 Jun 6;9(14):e177857.
doi: 10.1172/jci.insight.177857.

4EBP1-mediated SLC7A11 protein synthesis restrains ferroptosis triggered by MEK inhibitors in advanced ovarian cancer

Affiliations

4EBP1-mediated SLC7A11 protein synthesis restrains ferroptosis triggered by MEK inhibitors in advanced ovarian cancer

Jiaxin Yin et al. JCI Insight. .

Abstract

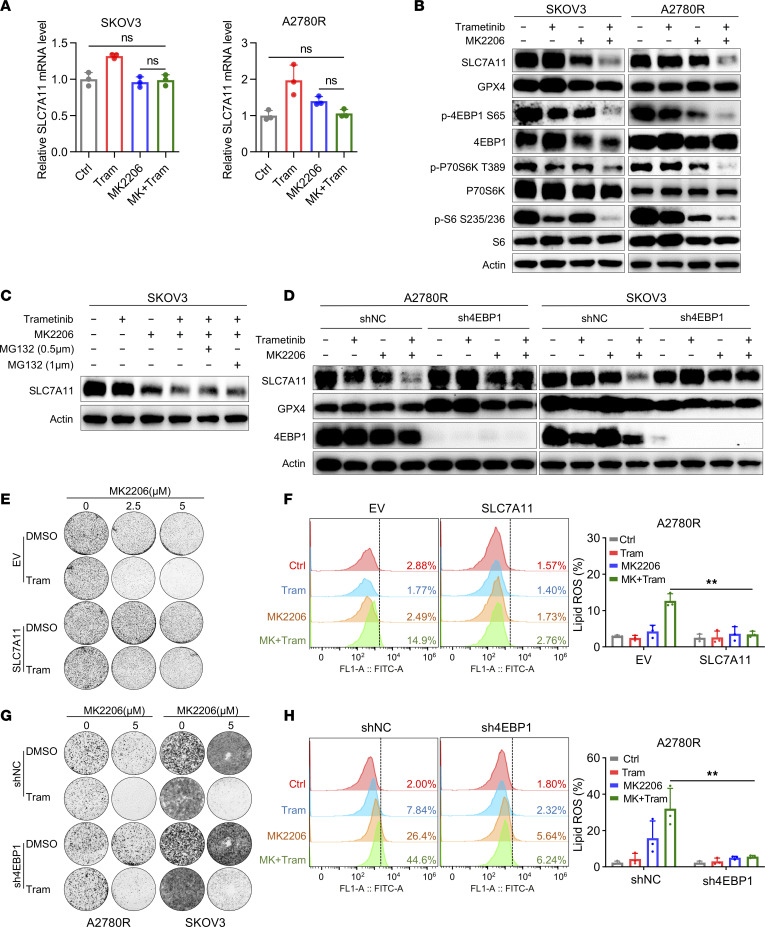
Loss of ferroptosis contributes to the development of human cancer, and restoration of ferroptosis has been demonstrated as a potential therapeutic strategy in cancer treatment. However, the mechanisms of how ferroptosis escape contributes to ovarian cancer (OV) development are not well elucidated. Here, we show that ferroptosis negative regulation signatures correlated with the tumorigenesis of OV and were associated with poor prognosis, suggesting that restoration of ferroptosis represents a potential therapeutic strategy in OV. High-throughput drug screening with a kinase inhibitor library identified MEK inhibitors as ferroptosis inducers in OV cells. We further demonstrated that MEK inhibitor-resistant OV cells were less vulnerable to trametinib-induced ferroptosis. Mechanistically, mTOR/eIF4E binding protein 1 (4EBP1) signaling promoted solute carrier family 7 member 11 (SLC7A11) protein synthesis, leading to ferroptosis inhibition in MEK inhibitor-resistant cells. Dual inhibition of MEK and mTOR/4EBP1 signaling restrained the protein synthesis of SLC7A11 via suppression of the mTOR/4EBP1 axis to reactivate ferroptosis in resistant cells. Together, these findings provide a promising therapeutic option for OV treatment through ferroptosis restoration by the combined inhibition of MEK and mTOR/4EBP1 pathways.

Keywords: Cancer; Drug therapy; Oncology; Therapeutics; Translation.


Conflict of interest statement

Conflict of interest: The authors have declared that no conflict of interest exists.

Figures

Figure 1
Figure 1. MEK inhibitors trigger ferroptosis in OV.
(A) Gene expression levels of FNR signatures and glutathione metabolism pathway in OV tumor and normal tissues analyzed in TNMplot database. (B) Gene expression level of GPX4, SLC7A11, and FTH1 in TCGA OV tumor (n = 426) and matched TCGA normal OV tissues along with GTEx data (n = 88). (C) Kaplan-Meier curves of recurrence time and overall survival rates in patients with OV grouped according to high (black, n = 17) and low (red, n = 27) expression of GPX4. (D) Kaplan-Meier curves of recurrence time and overall survival rates in patients with OV grouped according to high (black, n = 20) and low (red, n = 24) expression of SLC7A11. (E) The screening process for discovering ferroptosis inducers by performing kinase inhibitor library screening with 177 compounds in A2780. (F) Cell viability assay of A2780 and OVCAR5 cells treated with vehicle (DMSO) or trametinib (200 nM in A2780 and 500 nM in OVCAR5) in the absence or presence of Ferrostatin-1 (Fer-1) (2 μM), Liproxstatin-1 (Lipro-1) (100 nM), Necrostatin-1 (Necro-1) (5 μM), and Z-VAD-FMK (Z-VAD) (5 μM) for 72 hours. (G) Colony formation assay in A2780 and OVCAR5 treated with vehicle (DMSO) or trametinib (100 nM in A2780 and 200 nM in OVCAR5) in the absence or presence of Fer-1 (2 μM) and Lipro-1 (100 nM). (H) Lipid peroxidation assay and (I) intracellular GSH level of A2780 and OVCAR5 treated with trametinib (200 nM in A2780 and 500 nM in OVCAR5) with or without Fer-1 or Lipro-1 for 48 hours. (C and D) P values were determined by log-rank test. (F, H and I) Results are represented as mean ± SD of 3 biological replicates. P values were determined by 1-way ANOVA with Bonferroni’s post hoc test. *P < 0.05, **P < 0.01, ***P < 0.001.
Figure 2
Figure 2. Loss of ferroptosis is associated with the resistance to MEK inhibitors in OV.
(A) Lipid ROS level and (B) intracellular GSH level of commercial OV cell lines treated with trametinib (Tram, 200 nM) combined with or without Lipro-1 (100 nM). (C) Lipid ROS level and (D) intracellular GSH level of OV patient-derived cells (PDCs) treated with trametinib (200 nM) combined with or without Lipro-1 (100 nM). (E) Lipid peroxidation level of trametinib acquired-resistant cells A2780R and OVCAR5R treated with or without trametinib (200 nM). (F) A2780 and A2780R cells were treated with trametinib (200 nM) and analyzed by TEM to detect ultrastructure of mitochondria in 2 scale bars, 500 nm and 2 μm. The data are presented as the mean ± SD of three independent experiments. (A and C) P values were determined by 1-way ANOVA with Bonferroni’s post hoc test; (B, D and E) P values were determined by unpaired Student’s t test. *P < 0.05, **P < 0.01, ***P < 0.001.
Figure 3
Figure 3. SLC7A11 protein synthesis dictates the sensitivity of OV cells to ferroptosis triggered by MEK inhibitors.
(A) Immunoblot analysis of SLC7A11 and GPX4 in A2780 and OVCAR5 cells with their counterpart resistant lines treated with trametinib (200 nM) for 48 hours. (B) qRT-PCR analysis of SLC7A11 in A2780 and OVCAR5 cells treated with trametinib (200 nM) for 48 hours. (C) Immunoblot analysis of SLC7A11 in A2780 cells treated with trametinib (200 nM) for 48 hours followed by 1.0 μM MG132 for 6 hours before harvest. (D) Patterns of SLC7A11 luciferase reporter plasmids. (E) Relative luciferase activity of SLC7A11- FL and the mRNA level of SLC7A11-FL tested by qRT-PCR in A2780 cells treated with trametinib for 48 hours. (F) Relative luciferase activity of SLC7A11-fluc-T1, SLC7A11-fluc-T2, and SLC7A11-fluc-T3 after transient transfection into A2780 cells. In E and F, data are represented as mean ± SD, n = 3. (G) The effect of CRISPR/Cas9-mediated SLC7A11 knockdown (sgSLC1 and sgSLC2) evaluated by immunoblot analysis. (H) Cell viability assay and (I) colony formation assay of the effect of SLC7A11 ablation on trametinib sensitivity. The concentration of trametinib used in colony formation assay is 10 μM. (J) The effect of SLC7A11 ablation on lipid peroxidation under trametinib treatment (10 μM). (K) The effect of SLC7A11 overexpression evaluated by immunoblot analysis in A2780. (L) Cell viability assay and (M) colony formation assay of empty vector (EV) and SLC7A11-overexpressing (SLC7A11) A2780 cells treated with trametinib. (N) Lipid peroxidation assay of A2780-EV and -SLC7A11 cells treated with trametinib (200 nM). Data are presented as the mean ± SD of triple independent experiments. P values were determined by (B and N) unpaired Student’s t test, (E, F, and J) 1-way ANOVA with Bonferroni’s post hoc test, or (H and L) 2-way ANOVA with Tukey’s post hoc test. *P < 0.05, **P < 0.01, ***P < 0.001.
Figure 4
Figure 4. mTOR/4EBP1 pathway modulates SLC7A11 protein synthesis to promote ferroptosis escape upon trametinib treatment.
(A) Immunoblot analysis of AKT, 4EBP1, S6, and ERK and MEK activity in A2780, OVCAR5, OVCAR3, and OVCAR4 cells treated with vehicle, 100 nM trametinib, or 500 nM trametinib. p-, phosphorylated. (B) Immunoblot analysis of SLC7A11, GPX4, and 4EBP1 in A2780 treated with trametinib (200 nM) after transfection with either negative control (shNC) or sh4EBP1. (C) The relative luciferase activity of SLC7A11-flu-FL in A2780 treated with trametinib after transfection with either negative shNC or sh4EBP1. (D) Immunoblot analysis of SLC7A11, GPX4, and 4EBP1 in A2780R cells treated with trametinib (10 μM) after stable expression of either EV or 4EBP1-4A. (E) The relative luciferase activity of SLC7A11-flu-FL in A2780R treated with trametinib after transfection with either EV or 4EBP1-4A. (F) Colony formation assay and (G) cell viability assay of the effect of 4EBP1 depletion on trametinib sensitivity. (H) The effect of 4EBP1 depletion on lipid peroxidation in A2780 treated with trametinib (200 nM). (I) Colony formation assay and (J) cell viability assay of the effect of 4EBP1-4A overexpression on trametinib sensitivity (trametinib, 10 μM). (K) The effect of 4EBP1-4A overexpression on lipid peroxidation in A2780R treated with trametinib (10 μM). The data are presented as the mean ± SD of 3 independent experiments. (C, H, and K) P values were determined by unpaired Student’s t test. (E) P values were determined by 1-way ANOVA with Bonferroni’s post hoc test. (G and J) Two-way ANOVA with Tukey’s post hoc test. **P < 0.01, ***P < 0.001.
Figure 5
Figure 5. Targeting PI3K/mTOR signaling sensitizes resistant cells to ferroptosis induced by MEK inhibitors.
(A) Cell viability of SKOV3 treated with 500 nM trametinib with or without PI3K/AKT/mTOR inhibitors for 96 hours. BY719 (1 μM), PI103 (1 μM), MK2206 (MK) (5 μM), GSK690693 (GSK) (5 μM), rapamycin (Rapa) (1 μM), everolimus (Evero) (0.5 μM). (B) Colony formation of SKOV3 treated with 500 nM trametinib with or without PI3K/AKT/mTOR inhibitors. BY719 (1 μM), PI103 (1 μM), MK2206 (MK) (5 μM), GSK690693 (GSK) (5 μM), rapamycin (Rapa) (1 μM), everolimus (Evero) (0.5 μM). (C) Growth curves and (D) sub-G1 population analysis in SKOV3 treated with vehicle, trametinib, AKT inhibitors (GSK690693 or MK2206), or their combination. (E) Colony formation assay of PDC-POVC15 treated with trametinib (100 nM) with or without AKT inhibitors (MK2206, 5 μM and GSK690693, 5 μM). (F) Cell viability of SKOV3 and A2780R cells following trametinib (500 nM) or MK2206 treatment (5 μM) in the presence or absence of Fer-1 (2 μM), Lipro-1 (100 nM), DFO (300 nM), Z-VAD (5 μM), and Necro-1 (5 μM) for 48 hours. (G) Detection of lipid peroxidation level with BODIPY 581/591 C11 probe determined by the flow cytometer in SKOV3 and A2780R treated with trametinib (500 nM) or MK2206 (5 μM) treatment in the presence or absence of Fer-1, Lipro-1, and DFO for 48 hours. (H) Detection of GSH level in SKOV3 and A2780R followed by trametinib (500 nM) or MK2206 treatment (5 μM) in the presence or absence of Fer-1 or Lipro-1 for 48 hours. The data are presented as the mean ± SD of 3 independent experiments. (A and FH) P values were determined by 1-way ANOVA with Bonferroni’s post hoc test. (C) P values were determined by 2-way ANOVA with Tukey’s post hoc test. (D) P values were determined by unpaired Student’s t test. *P < 0.05, **P < 0.01, ***P < 0.001.
Figure 6
Figure 6. Cotargeting AKT and MEK suppresses the protein synthesis of SLC7A11 via inhibition of mTOR/4EBP1 activity.
(A) The mRNA level of SLC7A11 in SKOV3 and A2780R treated with vehicle, trametinib (500 nM), MK2206 (5 μM), or their combination for 48 hours. (B) Immunoblot analysis of SLC7A11 and GPX4 and the activity of mTOR, 4EBP1, P70S6K, and S6 in SKOV3 and A2780R cells treated with vehicle, trametinib (500 nM), MK2206 (5 μM), or their combination for 48 hours. (C) Immunoblot analysis of SLC7A11 in SKOV3 treated with trametinib or MK2206 treatment for 48 hours in the presence or absence of MG132 at indicated concentrations for 6 hours before harvest. (D) Immunoblot analysis of SLC7A11 in SKOV3 and A2780R treated with trametinib (500 nM) or MK2206 (5 μM) after transfection with either shNC or sh4EBP1 for 48 hours. (E) Representative images of colony formation assay in A2780R cells treated with trametinib (500 nM) with or without MK2206 (both 2.5 μM and 5 μM) after transfection with either EV or SLC7A11. (F) Lipid peroxidation analysis in A2780R cells treated with trametinib (500 nM) with or without MK2206 (5 μM) for 48 hours after transfection with either EV or SLC7A11. (G) Representative images of colony formation assay in A2780R and SKOV3 cells treated with trametinib (500 nM) with or without MK2206 (5 μM) after transfection with either shNC or sh4EBP1. (H) Lipid peroxidation analysis in A2780R cells treated with trametinib (500 nM) with or without MK2206 (5 μM) for 48 hours after transfection with either shNC or sh4EBP1. The data are presented as the mean ± SD of 3 independent experiments. (A) P values were determined by 1-way ANOVA with Bonferroni’s post hoc test. (F and H) P values were determined by unpaired Student’s t test. **P < 0.01.
Figure 7
Figure 7. AKT inhibitor sensitizes OV to MEK inhibitor–mediated ferroptosis in vivo.
(A) Tumor volume of SKOV3 xenografts in nude mice treated with vehicle, 60 mg/kg MK2206 (orally), 0.25 mg/kg trametinib (i.p.), or the combination at the same doses every other day (n = 4 per group). (B) Tumor volume of patient-derived xenograft PDX-POVC15 tumors implanted into NOD-SCID mice treated with vehicle, 90 mg/kg MK2206 (orally), 0.25 mg/kg trametinib (i.p.), or the combination at the same doses every other day (n = 9 per group). (C) Survival rates of patient-derived xenograft PDX-POVC15 tumors implanted into NOD/SCID mice treated with vehicle, 90 mg/kg MK2206 (orally), 0.25 mg/kg trametinib (i.p.), or the combination at the same doses every other day (n = 6 per group). The curve represents the survival time from the beginning of therapy. Drug treatment was withdrawn until the tumor volume of the first mouse reached 1,000 mm3 at day 25. (D) Quantification of ALT, AST, BUN, and creatinine levels in the serum of PDX-POVC15 of experiments described in C at day 25 (n = 4 per group). (E) Representative IHC and (F) quantification of p-4EBP1 and SLC7A11 in SKOV3 of experiments described in A. Scale bar, 50 μm. (G) Representative IHC and (H) quantification of p-4EBP1 and SLC7A11 in PDX-POVC15 of experiments described in B. Scale bar, 100 μm. (AC) Date are presented as mean ± SEM. P values were determined by 2-way ANOVA with Tukey’s post hoc test. (D, F, and H) Quantification is shown from 3 tumors. The data are presented as the mean ± SD. P values were determined by 1-way ANOVA with Bonferroni’s post hoc test. *P < 0.05, **P < 0.01, ***P < 0.001.
Figure 8
Figure 8. The schematic model illustrating the mechanism of ferroptosis modulated by MEK inhibitor.
Trametinib inhibits mTOR/4EBP1 activity to suppress SLC7A11 protein synthesis, leading to ferroptosis in MEK inhibitor–sensitive OV cells (Left). Sustained mTOR/4EBP1 axis mediated SLC7A11 translation and conferred resistance to trametinib-induced ferroptosis (Right). Targeting mTOR/4EBP1 signaling reversed the resistance to ferroptosis induced by MEK inhibitors through suppression of SLC7A11 protein synthesis.

Similar articles

Cited by

References

    1. Siegel RL, et al. Cancer statistics, 2023. CA Cancer J Clin. 2023;73(1):17–48. doi: 10.3322/caac.21763. - DOI - PubMed
    1. Lheureux S, et al. Epithelial ovarian cancer. Lancet. 2019;393(10177):1240–1253. doi: 10.1016/S0140-6736(18)32552-2. - DOI - PubMed
    1. Lheureux S, et al. Epithelial ovarian cancer: evolution of management in the era of precision medicine. CA Cancer J Clin. 2019;69(4):280–304. doi: 10.3322/caac.21559. - DOI - PubMed
    1. Dixon SJ, et al. Ferroptosis: an iron-dependent form of nonapoptotic cell death. Cell. 2012;149(5):1060–1072. doi: 10.1016/j.cell.2012.03.042. - DOI - PMC - PubMed
    1. Yang WS, et al. Regulation of ferroptotic cancer cell death by GPX4. Cell. 2014;156(1–2):317–331. doi: 10.1016/j.cell.2013.12.010. - DOI - PMC - PubMed

MeSH terms