. 2024 Jul 22;52(13):7971-7986.
doi: 10.1093/nar/gkae477.

The 5'-terminal stem-loop RNA element of SARS-CoV-2 features highly dynamic structural elements that are sensitive to differences in cellular pH

Affiliations

The 5'-terminal stem-loop RNA element of SARS-CoV-2 features highly dynamic structural elements that are sensitive to differences in cellular pH

Sabrina Toews et al. Nucleic Acids Res. .

Abstract

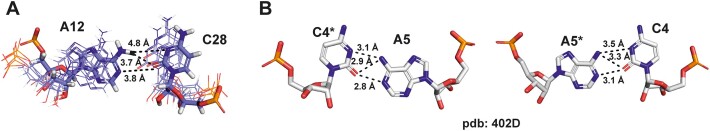
We present the nuclear magnetic resonance spectroscopy (NMR) solution structure of the 5'-terminal stem loop 5_SL1 (SL1) of the SARS-CoV-2 genome. SL1 contains two A-form helical elements and two regions with non-canonical structure, namely an apical pyrimidine-rich loop and an asymmetric internal loop with one and two nucleotides at the 5'- and 3'-terminal part of the sequence, respectively. The conformational ensemble representing the averaged solution structure of SL1 was validated using NMR residual dipolar coupling (RDC) and small-angle X-ray scattering (SAXS) data. We show that the internal loop is the major binding site for fragments of low molecular weight. This internal loop of SL1 can be stabilized by an A12-C28 interaction that promotes the transient formation of an A+•C base pair. As a consequence, the pKa of the internal loop adenosine A12 is shifted to 5.8, compared to a pKa of 3.63 of free adenosine. Furthermore, applying a recently developed pH-differential mutational profiling (PD-MaP) approach, we not only recapitulated our NMR findings of SL1 but also unveiled multiple sites potentially sensitive to pH across the 5'-UTR of SARS-CoV-2.


Figures

Graphical Abstract
Graphical Abstract
Figure 1.
Figure 1.
Biological context of SL1 and the secondary structure of SL1 highlighting its protonation site. (A) Host mRNA translation inhibition induced by SARS-CoV-2. Nsp1 blocks the mRNA entry channel of the 40S ribosomal subunit. Proposed models indicate that SL1 might be needed to escape the blocked mRNA channel via an interaction with Nsp1 and to allow viral translation in infected host cells. (B) Genomic context of SL1 highlighting the pH-induced rearrangement of the internal loop.
Figure 2.
Figure 2.
Structural ensemble of SL1. (A) Secondary structure representation of the SL1 construct investigated here. The additional G–C base pair added at the terminus for stability and transcription efficiency, which is not part of the original SL1 sequence is shown in lower case letters. Residues of the apical loop and the internal bulge are highlighted in violet. (B) NMR-derived structural ensemble of SL1 at pH 6.2. Individual structures are shown in thin stick representation with the backbone in cartoon representation; the lowest-energy structure is shown as thick sticks with the backbone in cartoon representation. Color scheme as in (A).
Figure 3.
Figure 3.
SAXS and RDC analysis of the SL1 structural ensemble. (A) Raw SAXS data and fit result of distance distribution. (B) Distance distribution function of curve shown in (A). (C) Calculated RDCs versus observed RDCs; blue: NH RDCs (not used in ARIA calculation); turquoise: C2H2 RDCs; red: C8H8 RDCs. The RDC fit is shown for the lowest-energy structure, R2 = 0.95. The most prominent outlier, G7, notably exhibits an elevated {1H}–13C heteronuclear NOE above 1.2.
Figure 4.
Figure 4.
Changes in conformational dynamics of SL1 due to temperature and pH and analysis of local conformational flexibility. (A) 1H–13C-HSQC (H6/8-C6/8) at pH 6.2 and 298 K. (B) Temperature-induced CSPs, (C) {1H}–13C heteronuclear NOE values, (D) pH-induced CSPs plotted on the lowest-energy structure of SL1. Color bars corresponding to the range of respective values are given next to each structure. Values are shown for aromatic CH resonances between T = 278–308 K at pH 6.2 (B), T = 298 K and pH 6.2 (C), and pH = 5.2–6.2 at T = 283 K (D). Combined 1H,13C CSPs were used for the analysis shown in (B) and (C). Resonances could not be analyzed for residue 21 (B, T CSPs) and residues U13 and C20 (C, hetNOEs); these residues are colored according to their atom type.
Figure 5.
Figure 5.
Close-up views of (A) the structural bundle of SL1 showing the internal loop region with focus on the proposed formation of the A+•C wobble base pair and (B) configuration of the two ideal A+•C wobble base pairs formed reported in pdb 402D (60). Asterisks denote the complementary strand of the duplex.
Figure 6.
Figure 6.
pH-sensitive conformational plasticity of the internal loop. (A) 1H,13C-HSQC spectra overlay at pH 7.2 (turquoise) and pH 5.2 (purple), the C2H2 resonance shifts for A12, A26 and A27 are indicated by arrows. (B) 2J-1H,15N-HSQC spectra overlay at pH 7.2 (turquoise) and pH 4.6 (purple) showing the pronounced upfield shift of the A12N1 resonance and significant upfield shifts for A26N1 and A27N1 resonances at lower pH, respectively. (C) Comparison of resonance linewidths and {1H}–13C hetNOE values of A12, A26 and A27 at pH 6.2 (turquoise/black) versus pH 5.2 (purple/grey). (D) 1D-1H NMR spectra showing the imino proton region of SL1 at different pH values. Opposite pH dependence of base pair stabilities reflected by imino proton intensities: Above the pKa of A12, U13–A26 is most stable and a U25 imino resonance is observable. Below pH 5.8, U11 becomes observable due to stabilization of A12+•C28. (A, B) NMR spectra were acquired at 600 MHz and 298 K. (D) NMR spectra were acquired at 600 MHz and 283 K.
Figure 7.
Figure 7.
pH-dependent CD and melting curve analysis of SL1. (A–C) Overlay of CD spectra recorded in five accumulations at various temperatures (ranging from 5 to 95°C) with one-degree increments at pH 5.2, 6.2 and 7.2. Shifting of CDmax values are highlighted. (D) Melting curve analysis of SL1 at pH 5.2, 6.2 and 7.2. Data were extracted from recorded CD spectra recorded at 25°C from the wavelength belonging to the CDmax of the individual sample. Melting points were determined with a sigmoidal fit revealing increased global stability reflected in higher melting points at higher pH (R2pH 5.2 = 0.9994, R2pH 6.2 = 0.9905, R2pH 7.2 = 0.9958).
Figure 8.
Figure 8.
PD-MaP of SL 1-5 of SARS-CoV-2 5′-UTR. (A) Secondary structure of SL 1-5 of SARS CoV-2 5′-UTR with protonation signatures highlighted in yellow with focus on SL1’s PD-MaP profile. (B) Average PD-MaP profiles over three replicates. Protonation signatures are highlighted in yellow on the ΔDMSpH plot.
Figure 9.
Figure 9.
Characterization of the interaction between SL1 and C11 at pH 7.2. (A) RNA-observed chemical shifts induced by fragment addition. The addition of C11 to the target RNA allows the detection of an additional imino signal (top, *). Shifts within the aromatic region indicate binding of C11 to the internal loop of SL1 (bottom). The ligand was added in excess with an [RNA]:[ligand]-ratio of 1:7 (150 μM:1 mM). NMR spectra were acquired at 600 MHz and 298 K. (B) Mapped major CSPs (blue) induced by the addition of C11 to the tertiary structure identifying the internal loop as the binding site. Shifts taken from 1D- and additional 2D-NMR experiments shown in the SI. (C) Ligand-observed NMR titration fit (protons chosen for CSPs observation are indicated in grey) with the respective dissociation constant (top, R2 = 0.99975). RNA-observed fluorescence-based titration fit with the respective dissociation constant (bottom, R2 = 0.99926).
Figure 10.
Figure 10.
pH-induced re-arrangement of the internal loop upon A12 protonation. (A, B) A12 protonation leads to the stabilization of the A12–C28 interaction and to the destabilization of the U13–A26 interaction. (C) At pH 5.2 and below, the A12+•C28 wobble base pair is formed and A27 is sandwiched between U13 and A26 and A12+•C28. (D) At pH 6.2 and above, the U13–A26 base pair is formed and A27 is sandwiched between A12 and C28 and U13–A26. Under physiological conditions, the population of the protonated state decreases to 6%.

Similar articles

Cited by

References

    1. Madhugiri R., Karl N., Petersen D., Lamkiewicz K., Fricke M., Wend U., Scheuer R., Marz M., Ziebuhr J. Structural and functional conservation of cis-acting RNA elements in coronavirus 5′-terminal genome regions. Virology. 2018; 517:44–55. - PMC - PubMed
    1. Liu P., Li L., Millership J.J., Kang H., Leibowitz J.L., Giedroc D.P. A U-turn motif-containing stem–loop in the coronavirus 5′ untranslated region plays a functional role in replication. RNA. 2007; 13:763–780. - PMC - PubMed
    1. Li L., Kang H., Liu P., Makkinje N., Williamson S.T., Leibowitz J.L., Giedroc D.P. Structural lability in stem–Loop 1 drives a 5′ UTR–3′ UTR interaction in coronavirus replication. J. Mol. Biol. 2008; 377:790–803. - PMC - PubMed
    1. Vora S.M., Fontana P., Mao T., Leger V., Zhang Y., Fu T.-M., Lieberman J., Gehrke L., Shi M., Wang L. et al. . Targeting stem-loop 1 of the SARS-CoV-2 50 UTR to suppress viral translation and Nsp1 evasion. Proc. Natl. Acad. Sci. U. S. A. 2022; 119:e2117198119. - PMC - PubMed
    1. Schubert K., Karousis E.D., Jomaa A., Scaiola A., Echeverria B., Gurzeler L.A., Leibundgut M., Thiel V., Mühlemann O., Ban N. SARS-CoV-2 Nsp1 binds the ribosomal mRNA channel to inhibit translation. Nat. Struct. Mol. Biol. 2020; 27:959–966. - PubMed