. 2024 Jun 7;384(6700):eadk0775.
doi: 10.1126/science.adk0775. Epub 2024 Jun 7.

Defining the KRAS- and ERK-dependent transcriptome in KRAS-mutant cancers

Affiliations

Defining the KRAS- and ERK-dependent transcriptome in KRAS-mutant cancers

Jeffrey A Klomp et al. Science. .

Erratum in

Abstract

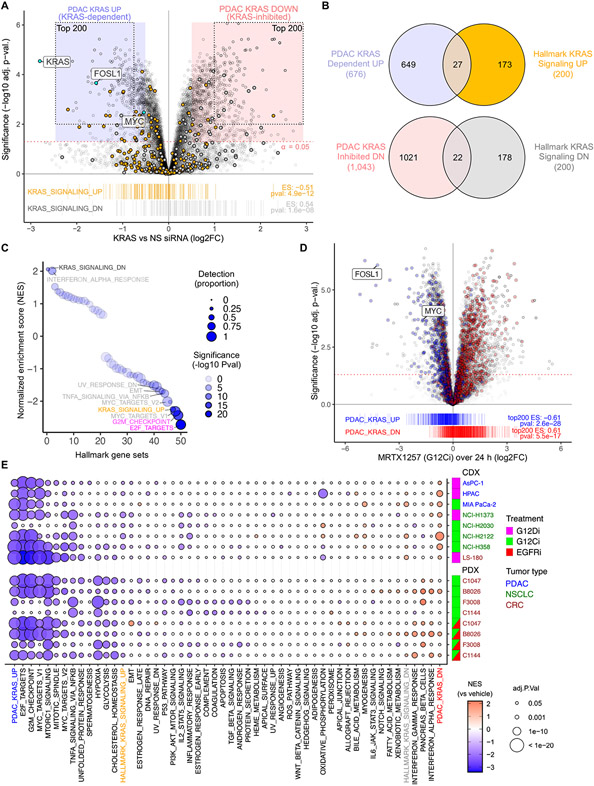
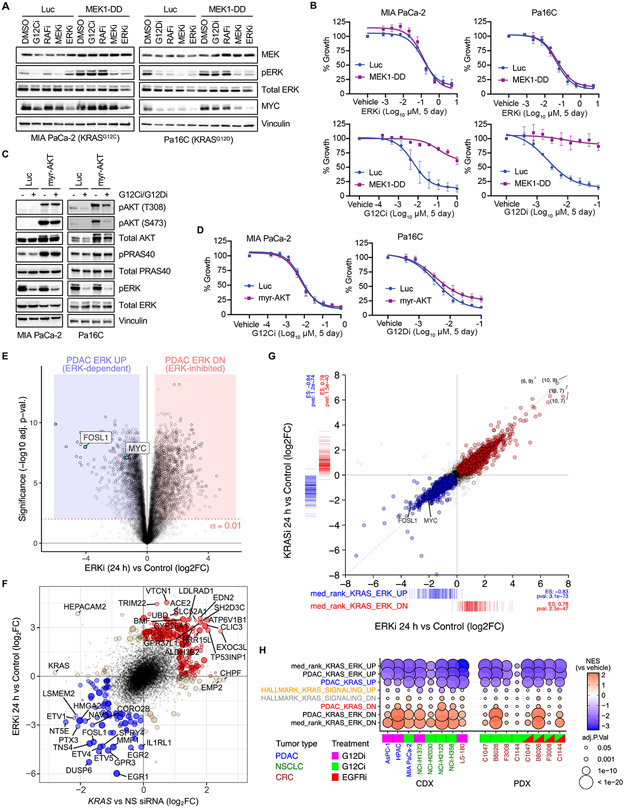
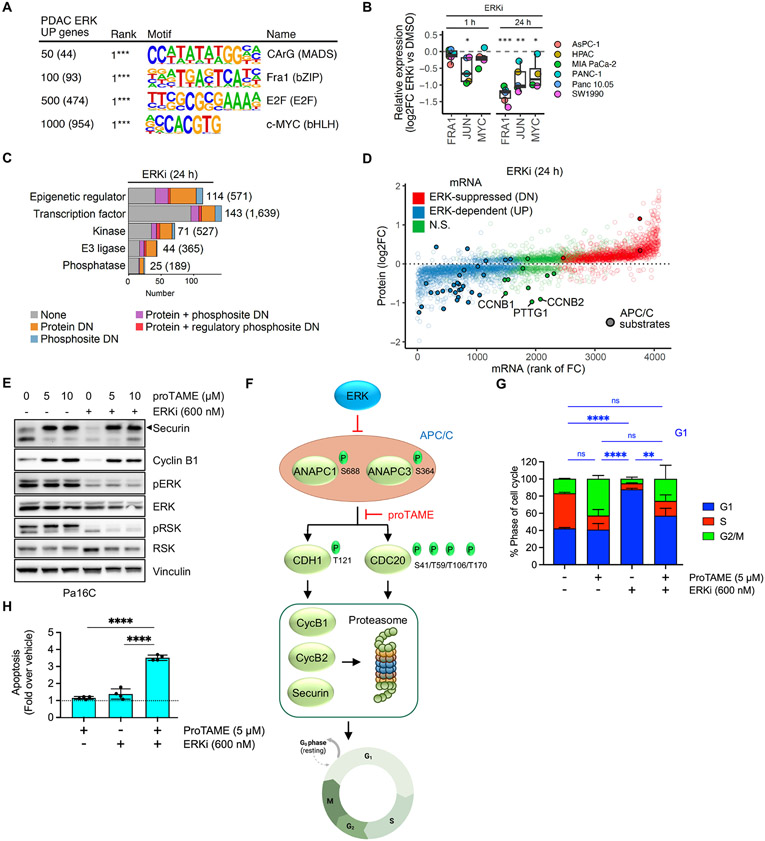
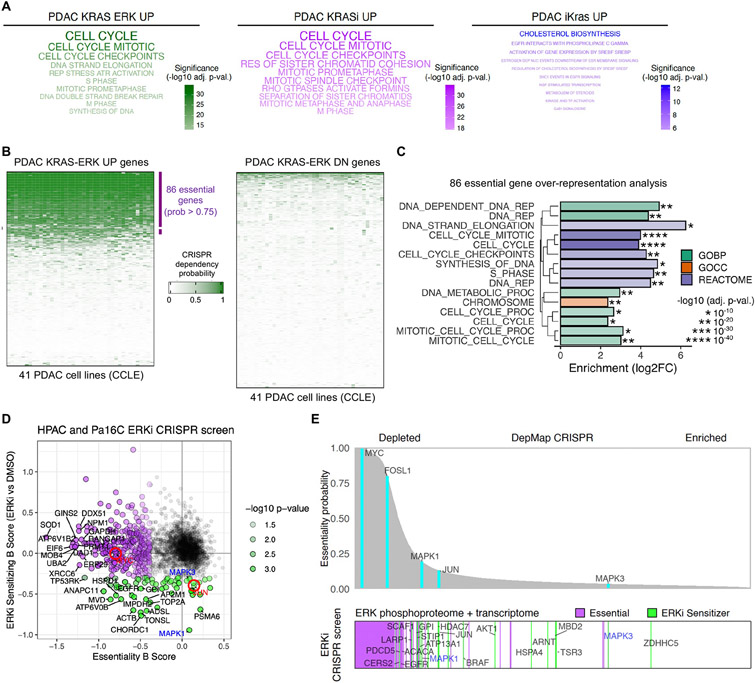
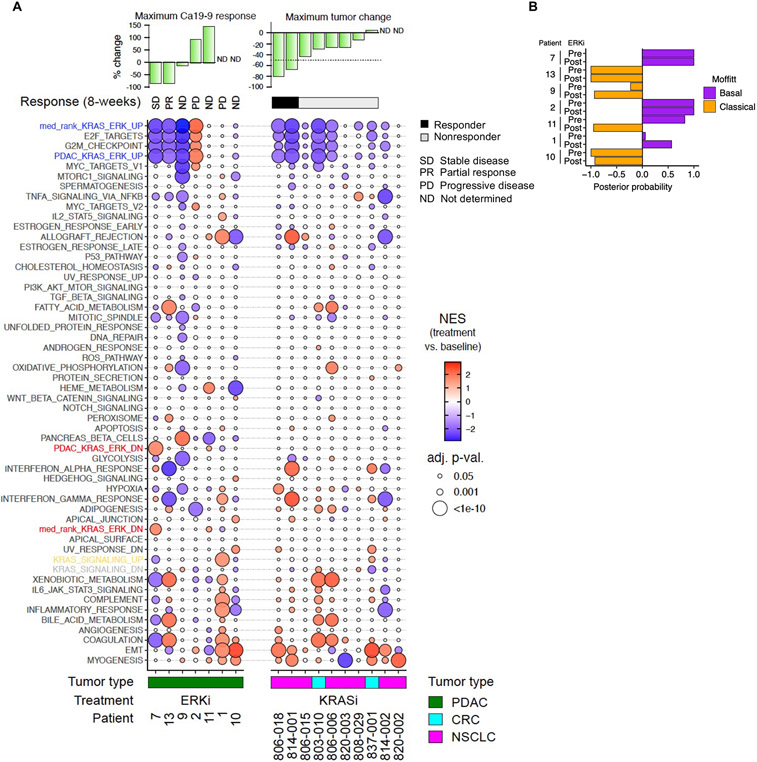
How the KRAS oncogene drives cancer growth remains poorly understood. Therefore, we established a systemwide portrait of KRAS- and extracellular signal-regulated kinase (ERK)-dependent gene transcription in KRAS-mutant cancer to delineate the molecular mechanisms of growth and of inhibitor resistance. Unexpectedly, our KRAS-dependent gene signature diverges substantially from the frequently cited Hallmark KRAS signaling gene signature, is driven predominantly through the ERK mitogen-activated protein kinase (MAPK) cascade, and accurately reflects KRAS- and ERK-regulated gene transcription in KRAS-mutant cancer patients. Integration with our ERK-regulated phospho- and total proteome highlights ERK deregulation of the anaphase promoting complex/cyclosome (APC/C) and other components of the cell cycle machinery as key processes that drive pancreatic ductal adenocarcinoma (PDAC) growth. Our findings elucidate mechanistically the critical role of ERK in driving KRAS-mutant tumor growth and in resistance to KRAS-ERK MAPK targeted therapies.


Figures

Fig. 1.
Fig. 1.. Establishment and evaluation of a KRAS-dependent gene expression program in KRAS-mutant PDAC.
(A) KRAS-dependent gene expression changes upon acute (24 hours) KRAS suppression in eight KRAS-mutant PDAC cell lines transiently transfected with KRAS or control non-specific (NS) siRNA. Enrichment of Hallmark KRAS signaling gene sets is shown below. The 677 KRAS-dependent (UP) and 1,051 KRAS-suppressed (DN) genes (log2 fold-change/FC > 0.5, adj. p-val. < 0.05) are indicated by blue and red shaded circles, respectively. The top 200 KRAS-dependent (UP) and KRAS-inhibited (DN) genes comprising the PDAC KRAS UP/DN signatures are indicated by the dotted outlines. (B) Venn diagram indicates the overlap of differentially expressed genes (with unique Entrez gene IDs) upon KRAS siRNA treatment (refer to blue/red shading in (A)) compared to Hallmark KRAS signaling genes. N = 8 (cell lines as biological replicates) for each treatment and control. (C) GSEA for 50 Hallmark gene sets within DE genes following KRAS siRNA treatment. Detection is based on presence of a gene in all 8 PDAC cell lines at >5 reads. NES, normalized enrichment score. (D) KRAS-G12Ci (MRTX1257, 20 nM) induced expression changes summarized over 24 hours and three cell lines (PDAC, CRC, and NSCLC). Genes from siKRAS experiment shown as blue/red boxes in (A) are highlighted with blue/red and indicated by barcode plot below. Enrichment scores (ES) for top 200 UP/DN genes are indicated. (E) GSEA for 50 Hallmark gene sets within RNA-seq data from the indicated human cancer cell line-derived (CDX) or patient-derived (PDX) xenograft tumor samples. CDX mice were treated orally (24 hours) with either KRASG12C or KRASG12D selective inhibitors (G12Ci adagrasib or G12Di MRTX1133, respectively) or vehicle control. PDX mice were treated (21 days) with G12Ci sotorasib alone or together with the EGFRi panitumumab. The top 200 genes from the PDAC KRAS UP/DN gene sets (panel A) were also evaluated. N = 3 for each cell line/treatment combination except HPAC (control) and LS-180 (G12Di), where n = 6.
Fig. 2.
Fig. 2.. Mutant KRAS is largely dependent on ERK for PDAC proliferation in vitro.
(A) Immunoblot analysis of ERK activity in PDAC cell lines stably infected with control vector (Luc) or constitutively activated MEK1 (MEK1-DD), treated with vehicle (DMSO) or indicated inhibitors of each level of the RAF-MEK-ERK cascade (G12Ci/G12Di, MRTX1257/MRTX1133 (20 nM); RAFi, LY3009120 (600 nM); MEKi, trametinib (6 nM); ERKi, SCH772984 (600 nM). Images are representative of 2-3 biological replicates. (B) Growth of PDAC cells stably infected with control vector (Luc) or activated MEK1-DD and treated with the indicated inhibitors. Error bars indicate SE of the mean with 3-4 biological replicates, each with three technical replicates. (C) Immunoblot analysis of ERK and AKT phosphorylation in PDAC cells stably infected with control vector (Luc) or constitutively activated AKT (myr-AKT), treated with G12Ci/G12Di (MRTX1257/MRTX1133, 20 nM) or ERKi (SCH772984, 600 nM). Representative of 2-3 biological replicates. (D) Growth of PDAC cells expressing activated AKT or control vector (Luc) and treated with KRAS G12C/D inhibitors. Error bars indicate SE of the mean with 3-4 biological replicates, each with 3 technical replicates. (E) Differential gene expression analysis for seven PDAC cell lines subjected to ERKi (SCH772984, 1000 nM) treatment for 24 hours versus paired untreated control cells. (F) Top 200 UP/DN genes from 24 hours KRAS siRNA and ERKi RNA-seq experiments are shown as filled blue (UP) or red (DN) circles, with a positive predictive value (agreement/total) for logFC = 0.84. Genes with strongest logFC values (n = 40) are labeled. (G) Evaluation of DE genes following 100 nM treatment of Pa16C PDAC cells with KRASi-G12Di (MRTX1133) or ERKi (SCH772984) for 24 hours (each condition, n = 2). Colored points are DE genes in either treatment (FDR < 0.05); red, log2FC > 0 with either treatment; blue, log2FC < 0 with either treatment; tan, log2FC opposite directions between treatments. Coordinate labels indicate points outside of plotting range. Barcode plots below and left represent log2FC for “median rank KRAS-ERK” signature genes within each experiment and ssGSEA enrichment statistics. (H) GSEA for PDAC KRAS UP/DN, PDAC KRAS-ERK UP/DN, and KRAS-ERK UP/DN based on median rank, along with Hallmark KRAS Signaling signatures in CDX and PDX models treated with G12Di, G12Ci or G12Ci+EGFRi with replicates as described in Fig. 1E. Inhibitors used in (H): G12Ci (CDX), adagrasib; G12Di, MRTX1133; G12Ci (PDX), sotorasib; EGFRi, panitumumab.
Fig. 3.
Fig. 3.. Integration of transcriptomic, proteomic, and phosphosite activity data reveals multiple ERK dependent cell cycle control mechanisms.
(A) Supervised gene promoter motif enrichment analysis for different cutoffs of the top PDAC ERK UP genes. Numbers in parentheses indicate number of genes from each subset used in the analysis. (B) Protein abundance of AP-1 transcription factor components FRA1 and JUN, and of MYC, after 1 and 24 hours of ERKi, (SCH772984, 1000 nM) treatment across six PDAC cell lines, was determined by LC-MS2. (C) Categorization of proteins dependent on ERK for expression and/or phosphosite activity into five main functional groups. Numbers in parentheses indicate total number encoded in human genome. (D) Comparison of change in protein abundance (y-axis) with change in mRNA expression (x-axis) following ERKi treatment (24 hours) for proteins with significant changes (log2FC > 0.2 & adj. p-val. < 0.05). APC/C substrates are indicated by filled circles. (E) Immunoblot analysis of APC/C target proteins securin and cyclin B1 as well as ERK activity readouts pERK and pRSK following treatment with proTAME (APC/Ci) and/or ERKi in Pa16C cells. Images are representative of 2-3 biological replicates. (F) Schematic for ERK inhibition of APC/C E3 ligase function and degradation of mitotic regulators securin and cyclin B1/2. (G) Cell cycle distribution analysis of Pa16C cells treated with APC/Ci and/or ERKi for 24 hours (n = 3, each condition). (H) Apoptosis induction relative to vehicle control in Pa16C cells treated with APC/Ci and/or ERKi for 3 days (n = 4, each condition). (G-H), error bars represent +/− 1 S.D. All statistical comparisons, ns: not significant, *p < 0.05, **p < 0.01, ***p < 0.001, ****p < 0.0001.
Fig. 4.
Fig. 4.. KRAS-ERK dependent genes are essential for cell proliferation in PDAC.
(A) Over-representation analysis for REACTOME terms in three KRAS signatures: PDAC KRAS-ERK UP, PDAC KRASi UP, and PDAC iKras UP. Top 10 terms are shown. (B) Comparison of CRISPR dependency probabilities to gauge essentiality of genes in PDAC KRAS-ERK UP/DN signatures across 41 KRAS-mutant PDAC cell lines from CCLE. (C) Over-representation analysis for PDAC KRAS-ERK UP essential genes using KEGG, GO, and REACTOME. BP, biological process; CC, cellular component. (D) CRISPR drop-out screen using sgRNA library generated from ERK-dependent phosphoproteins and transcripts. Beta scores calculated with MAGeCK. Red circles highlight MYC and JUN. (E) Comparison of genes highlighted in (D) (bottom) with essentiality probabilities averaged across the 41 KRAS-mutant PDAC cell lines in DepMap (top).
Fig. 5.
Fig. 5.. Changes in KRAS ERK dependent genes coincide with ERKi treatment response in patient tumors.
(A) GSEA evaluation of the median rank KRAS-ERK UP/DN, PDAC KRAS-ERK UP/DN and Hallmark signatures in patient biopsies, pre- and post-treatment. Patients with KRAS-mutant PDAC were treated with ERKi ulixertinib (14 days). Patients with KRASG12C-mutant NSCLC or CRC were treated with the KRASG12C-selective KRASi adagrasib (8 days). The serum biomarker CA 19-9 was used to monitor treatment response, and patient response was assessed according to the Response Evaluation Criteria in Solid Tumors version 1.1 (RECIST v1.1). NES, normalized enrichment score. (B) Evaluation of PDAC subtype in pre- and post-treatment patient biopsies using the Moffitt classifier (23).

References

    1. Punekar SR, Velcheti V, Neel BG, Wong K-K, The current state of the art and future trends in RAS-targeted cancer therapies. Nat Rev Clin Oncol, 1–19 (2022). - PMC - PubMed
    1. Hayashi A, Hong J, Iacobuzio-Donahue CA, The pancreatic cancer genome revisited. Nat Rev Gastroenterol Hepatol 18, 469–481 (2021). - PubMed
    1. Waters AM, Der CJ, KRAS: The Critical Driver and Therapeutic Target for Pancreatic Cancer. Cold Spring Harb Perspect Med 8, a031435 (2018). - PMC - PubMed
    1. Collisson EA, Trejo CL, Silva JM, Gu S, Korkola JE, Heiser LM, Charles R-P, Rabinovich BA, Hann B, Dankort D, Spellman PT, Phillips WA, Gray JW, McMahon M, A central role for RAF→MEK→ERK signaling in the genesis of pancreatic ductal adenocarcinoma. Cancer Discov 2, 685–693 (2012). - PMC - PubMed
    1. Hayes TK, Neel NF, Hu C, Gautam P, Chenard M, Long B, Aziz M, Kassner M, Bryant KL, Pierobon M, Marayati R, Kher S, George SD, Xu M, Wang-Gillam A, Samatar AA, Maitra A, Wennerberg K, Petricoin EF, Yin HH, Nelkin B, Cox AD, Yeh JJ, Der CJ, Long-Term ERK Inhibition in KRAS-Mutant Pancreatic Cancer Is Associated with MYC Degradation and Senescence-like Growth Suppression. Cancer Cell 29, 75–89 (2016). - PMC - PubMed

Publication types

MeSH terms

Substances