. 2024 Jun 7;384(6700):eadn0886.
doi: 10.1126/science.adn0886. Epub 2024 Jun 7.

A master regulator of opioid reward in the ventral prefrontal cortex

Affiliations

A master regulator of opioid reward in the ventral prefrontal cortex

Alexander C W Smith et al. Science. .

Abstract

In addition to their intrinsic rewarding properties, opioids can also evoke aversive reactions that protect against misuse. Cellular mechanisms that govern the interplay between opioid reward and aversion are poorly understood. We used whole-brain activity mapping in mice to show that neurons in the dorsal peduncular nucleus (DPn) are highly responsive to the opioid oxycodone. Connectomic profiling revealed that DPn neurons innervate the parabrachial nucleus (PBn). Spatial and single-nuclei transcriptomics resolved a population of PBn-projecting pyramidal neurons in the DPn that express μ-opioid receptors (μORs). Disrupting μOR signaling in the DPn switched oxycodone from rewarding to aversive and exacerbated the severity of opioid withdrawal. These findings identify the DPn as a key substrate for the abuse liability of opioids.


Figures

Fig. 1
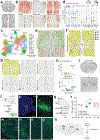
Fig. 1. Opioid-regulated DPn neurons encode aversion.
(a) Graphical depiction of oxycodone CPP procedure (left). Proportion of time (± SEM) male mice (n=7) spent in saline and oxycodone-paired sides of CPP apparatus (right). *P<0.05 compared to saline-paired side, two-tailed paired t-test. (b) Illustration of DISCO+ brain clearing and whole-brain c-Fos immunostaining procedures. (c) Representative iDISCO+ cleared brain from oxycodone-injected mouse showing c-Fos+ cells (red) and white matter tracts (green). (d) Mean (± SEM) numbers of Fos+ cells in brain regions of saline- and oxycodone-injected male mice (n=4 per group). Regions sorted according to p value. ***P<0.001, **p<0.01, *p<0.05, Fisher’s exact test. (e) Summary heat-maps showing higher c-Fos+ cell densities in DPn of oxycodone-injected relative to saline-injected mice. (f) tSNE plots of KNN analyses of c-Fos data from saline-injected (left) and oxycodone-injected (right) mice. Brain regions in which c-Fos expression was correlated across mice in each group are shown in the different colored clusters. (g) Graphical representation of AAV-ChR2-eYFP or AAV-eYFP injection into DPn of male C57BL/6J mice (left) and an example of fluorescence expression in DPn of AAV-ChR2-eYFP-injected mouse (right). (h) Design of RTPP experiment to investigate the effect of DPn photo-stimulation on reward/aversion behavior. (i) Heat-map of RTPP behavior in a ChR2-expressing mouse. (j) Mean (± SEM) time (s) spent in sides of RTPP apparatus in which the LED delivering DPn photo-stimulation was activated (LED-on) or inactivated (LED-on) in ChR2-expressing mice injected with saline or oxycodone (5 mg kg−1) before testing (n=4 per group) and eYFP-expressing control mice injected with saline before testing (n=4). Treatment x Session interaction in two-way repeated-measures ANOVA (F(2, 10)= 7.677, p=0.0095); **p<0.01, Šídák’s multiple comparisons test. (k) Design of the RTPP experiment in which oxycodone-responsive DPn neurons were photo-stimulated in male FosTRAP2 mice (upper). Depiction of 4-OHT-mediated ChR2-eYFP expression in oxycodone-responsive neurons in DPn of FosTRAP2 mice (lower). (l) iDISCO+ cleared brain showing ChR2-eYFP expression in DPn of FosTRAP2 mouse. (m) Mean (± SEM) time (s) spent in LED-on and LED-off sides of RTPP apparatus in ChR2-expressing (n=5) and eYFP-expressing FosTRAP2 mice (n=4). TRAP x Session interaction effect (F(1, 14)= 7.397, p=0.0166); **p<0.01, Šídák’s multiple comparisons test.
Fig. 2
Fig. 2. DPn aversion neurons project to the parabrachial nucleus.
(a) iDISCO+ cleared brain showing eYFP+ axons from oxycodone-responsive neurons (green) in a FosTRAP2 mouse injected into the DPn with AAV-hSyn-DIO-eYFP. (b) Bar graph summarizing brain regions with higher concentrations of eYFP+ DPn axons in brains of oxycodone-treated (n=9) versus saline-treated (n=8) male FosTRAP2 mice. Regions sorted according to −log P value (Fisher’s exact test). (c) Renderings of coronal brain images from Allen Mouse Brain Atlas highlighting regions containing DPn-derived eYFP+ axons (green). (d) Graphical summary of MAP-seq procedure. (e) Fluorescence micrograph showing DPn neurons infected with MAP-seq barcoding virus. cc, Corpus callosum; ac; anterior commissure. (f) Bar graph summarizing numbers of unique DPn-derived barcodes in sequenced brain regions (n=6 male C57BL/6J mice). (g) Barcode matrix showing the distributions of each unique DPn barcode across sequenced brain regions. (h) PCA was used to cluster sequenced regions based on their barcode content. (i) Radial graphs summarizing the distribution of DPn-derived barcodes in each brain region and the relative proportion of the same barcodes in the other regions. (j) Numbers of unique barcode reads (± SEM) detected in DPn neurons in saline-injected (n=3) and oxycodone-injected (n=3) mice. **P<0.01, unpaired two-sided t-test. (k) Relative numbers (± SEM) of each barcode (normalized to total barcode reads) across sequenced brain regions in saline and oxycodone-injected mice. *P<0.05, ***p<0.001, post-hoc test after significant interaction effect in two-way repeated-measures ANOVA (F(5, 1695)= 5.915, p<0.0001). (l) eYFP+ axons were detected in PBn of C57BL/6J mice (n=3) after injection of AAV5-hSyn-eYFP into DPn. scp, Superior cerebellar peduncle. (m) CTb-488+ cell bodies were detected in DPn of C57BL/6J mice (n=3) injected with CTb-488 into PBn. (n) Design of RTPP experiment assessing the effect of photo-stimulating the terminals of oxycodone-responsive DPn neurons in PBn of male FosTRAP2 mice (upper). Graphical representation of FosTRAP2 mice in which the terminals of oxycodone-responsive DPn→PBn neurons were photo-stimulated in PBn (lower). (o) Mean (± SEM) time (s) spent in the LED-on and LEF-off sides of RTPP apparatus by ChR2-expressing (n=5) and eYFP-expressing (n=5) FosTRAP2 mice. DPn photo-stimulation was delivered only in the LED-on side. TRAP x Session interaction effect in two-way repeated-measures ANOVA (F(1, 8)=12.81, p=0.0072); *p<0.05, Šídák’s multiple comparisons test.
Fig. 3
Fig. 3. DPn contains a unique population of pyramidal neurons.
(a) Slc17a7 (vGlut1) expression in DPn-containing coronal brain slice from Allen Mouse Brain Atlas. cc, Corpus callosum; ac; anterior commissure. (b) Spatial-seq was performed on a 1 mm2 area of PFC containing the DPn from male C57BL/6J mice (n=5). Shown are representative examples of genes with spatially variable expression. (c) UMAP plot of PFC cell clusters identified by Spatial-seq. (d) Dot plot of canonical marker gene expression showing enrichment in discrete UMAP clusters. (e) Representative PFC slice showing location of cells profiled by Spatial-seq and clustered in UMAP space. (f) Spatial distribution of glutamatergic (Glut) neurons from the same PFC slice subclustered into 6 discrete subtypes. (g) Glut 3 and Glut 4 subtypes were concentrated in the DPn. (h) Volcano plot showing that Glut 3 and Glut 4 subtypes were distinguished from the other Glut subtypes based on Slc17a6 (vGlut2) expression (−log P value; Fisher’s exact test). (i) Slc17a6 expression in a DPn-containing brain slice from Allen Mouse Brain Atlas. (j) Representation of vGlut2-Cre mice (n=3) injected into PBn with rgAAV-DIO-GFP to label DPnvGlut2→PBn neurons. (k) Fluorescence micrograph showing site of rgAAV-DIO-GFP injection in PBn of a vGlut2+ mouse. (l) Higher magnification images of injection area identified by a white box. (m) Fluorescence micrograph showing GFP+ neurons in DPn-containing coronal brain slice from same animal. (n, o and p) Higher magnification images of areas identified by white boxes and labeled (i), (ii), and (ii) in panel m. Ac, anterior cingulate cortex; Ins, insular cortex; MO, motor cortex; Orb, orbitofrontal cortex. (q) Graphical representation of vGlut2-Cre mice injected into the DPn with AAV-DIO-ChR2-eYFP or AAV-DIO-eYFP to express ChR2 (or eYFP) in vGlut2+ DPn neurons. (r) Mean (± SEM) time (s) spent in the LED-on and LED-off sides of the RTPP apparatus by ChR2-expressing mice injected with saline (n=5), ChR2-expressing mice injected with oxycodone (5 mg kg−1) (n=5), and eYFP-expressing mice injected with saline (n=5) prior to testing. ***P<0.001, unpaired two-tailed t test. (s) Graphical summary showing that the vGlut2+ DPn neurons that project to the PBn and regulate aversion in an opioid-regulated manner.
Fig. 4
Fig. 4. DPn pyramidal neurons express μORs.
(a) UMAP plot of DPn cell clusters identified by snRNA-seq. (b) UMAP cell clusters (upper) and cell densities across clusters (lower) from saline- and oxycodone-treated male C57BL/6J mice (n=6 per group). (c) Violin plot of canonical marker genes across clusters. (d) Dot plot of gene transcripts identifying GABAergic interneurons. Red boxes indicate clusters enriched in GABAergic marker genes. (e) Dot plot of clusters expressing genes identifying glutamatergic neurons (red boxes). (f) Dot plot showing Slc17a6 and Oprm1 expression in glutamatergic clusters. (g) Gene ontology (GO) analysis of DEGs in cluster 7 cells (−log P value; Fisher’s exact test). (h) Upstream regulator analysis of DEGs in cluster 7 (−log P value; Fisher’s exact test). (i) DPn-containing brain slice from male C57BL/6J mice (n=3) used for FISH (left). Higher magnification images from the same slice (middle). Higher magnification images of areas identified by white boxes in DPn (i) and IF region of mPFC (ii). (j) Summary of the gene expression profiles of μOR-expressing DPn pyramidal neurons resolved by FISH. (k) Mean (± SEM) numbers of μOR+ neurons in the DPn and IL detected by FISH. *P<0.05, two-tailed unpaired t test. (l) Mean (± SEM) numbers of μOR+/vGlut2+ co-expressing neurons in DPn and IL. *P<0.05, two-tailed unpaired t test. (m) Representation male vGlut2-Cre mice (n=5) injected into PBn with rgAAV-DIO-GFP. (n) Fluorescence micrograph showing site of rgAAV-DIO-GFP injection in PBn. (o) Fluorescence micrograph of GFP-labelled neurons in DPn. (p) Higher magnification image showing current-clamped DPnvGlut2→PBn neuron. (q) Representative voltage traces in DPnvGlut2→PBn neuron depolarized by current injections (200 and 300 pA) before and after DAMGO (1 μM) application. (r) Mean (± SEM) numbers of spikes emitted by DPnvGlut2→PBn neurons before and after DAMGO. Current intensity x DAMGO interaction in two-way repeated-measures ANOVA (F(1, 5)=7.770, p=0.0386). ###P<0.001, 200 vs. 300 pA current injections; ***p<0.001, before vs. after DAMGO; Tukey post-hoc test. (s) Illustration of male vGlut2-Cre mice (n=3) injected into DPn with AAV-DIO-ChR2-eYFP. (t and u) ChR2-eYFP expression in DPn and PBn, respectively. (v) Representative oEPSC traces in PBn neurons triggered by photo-stimulating the terminals of DPnvGlut2→PBn neurons before (control) and after DAMGO (1 μM) application. Mean (± SEM) peak current amplitudes of oEPSCs detected in PBn before (control) and after DAMGO. *P<0.05, unpaired two-tailed t test.
Fig. 5
Fig. 5. DPn neurons regulate opioid aversion.
(a) Conditional deletion of μORs from DPn of Oprm1Fl/Fl mice. (b) Mean (± SEM) μOR expression in DPn and mPFC of Cre-injected Oprm1Fl/Fl (cKO) mice (n=8) and control (n=4) male mice. Main effect of Genotype (F(1, 11)=9.318, p=0.011) in two-way repeated-measures ANOVA.**P<0.01, Bonferroni's multiple comparisons test. (c and d) No difference in mean (± SEM) distance travelled between control (n=17) and cKO (n=16) male and female mice after saline or oxycodone injection. (e) Mean (± SEM) total distance travelled after saline or oxycodone injection across daily sessions. Main effect of Treatment (F(1, 31)=138.1, ***p=0.0001). (f) CPP procedure to assess opioid reward in μOR cKO mice. (g) Mean (± SEM) time (s) spent in oxycodone-paired side by control (n=17) and cKO (n=16) male and female mice. Genotype x Session interaction effect (F(1, 31)=29.84, p<0.0001); ***P<0.001, Fisher’s LSD test. (h) Operant procedure to assess food responding. (i) Mean (± SEM) number of food pellets earned by control (n=7) and cKO (n=6) male mice after saline or oxycodone injection. Main effect of Treatment (F(1, 11)=62.93, p<0.0001); *P<0.05, Fisher’s LSD test. (j) Illustrations of AAV-Cre injection into DPn (upper); and whole-body tracking of mice during opioid withdrawal (lower). (k) Freeze-frame image of oxycodone-dependent mouse during naloxone-precipitated withdrawal. (l) Representative 2D traces of tracked body parts in mouse before (left) and during (right) naloxone (1 mg kg−1)-precipitated oxycodone withdrawal. (m) Mean (± SEM) % time spent in locomotion (10 min epochs) after daily oxycodone injection, then after naloxone injections in control (n=4) and cKO (n=4) male mice. Genotype x Injection interaction (F(2, 18)=18.52, p<0.0001); ***P<0.001, Bonferroni’s test. (n) Mean (± SEM) % time spent in withdrawal behaviors. Genotype x Injection interaction (F(2, 18)=11.86, p=0.0005); ***P<0.001, Bonferroni's test. (o) Mean (± SEM) % time spent in other distress-related behaviors. Genotype x Injection interaction (F(2, 18)=38.89, p<0.0001); ***P<0.001, **p<0.01, Bonferroni's test. (p) Summary of DPn regulation of opioid withdrawal. (q) Representative AAV-hM4Di-mCherry expression in DPn. (r and s) Mean (± SEM) number of food pellets earned by hM4Di-expressing (n=13) and mCherry-expressing (n=14) male mice after CNO (3 mg kg−1) and/or naloxone (1 mg kg−1) injection before and after induction of oxycodone dependence. Drug treatment x DREADD interaction in oxycodone-dependent mice (F(2, 50)=4.224, p=0.0202); ***P<0.001, **p<0.01, *p<0.05, Bonferroni's test. (t) Procedure to photo-stimulate opioid-responsive DPn neurons. (u) Mean (± SEM) number of food pellets earned by oxycodone-dependent FosTRAP2 male mice expressing ChR2 (n=5) or eYFP (n=4). ChR2 x Session interaction (F(1, 7)=8.12, p=0.0247); ***P<0.01, Fisher’s LSD test.

References

    1. Johnson SW, North RA, Opioids excite dopamine neurons by hyperpolarization of local interneurons. J Neurosci 12, 483–488 (1992). - PMC - PubMed
    1. Di Chiara G, Imperato A, Drugs abused by humans preferentially increase synaptic dopamine concentrations in the mesolimbic system of freely moving rats. Proc Natl Acad Sci U S A 85, 5274–5278 (1988). - PMC - PubMed
    1. Shippenberg TS, Bals-Kubik R, Herz A, Examination of the neurochemical substrates mediating the motivational effects of opioids: role of the mesolimbic dopamine system and D-1 vs. D-2 dopamine receptors. J Pharmacol Exp Ther 265, 53–59 (1993). - PubMed
    1. Corre J et al., Dopamine neurons projecting to medial shell of the nucleus accumbens drive heroin reinforcement. Elife 7, (2018). - PMC - PubMed
    1. Spyraki C, Fibiger HC, Phillips AG, Attenuation of heroin reward in rats by disruption of the mesolimbic dopamine system. Psychopharmacology (Berl) 79, 278–283 (1983). - PubMed

Publication types

MeSH terms