. 2024 Sep;71(3):267-281.
doi: 10.1165/rcmb.2023-0356MA.

Cell Culture Differentiation and Proliferation Conditions Influence the In Vitro Regeneration of the Human Airway Epithelium

Affiliations

Cell Culture Differentiation and Proliferation Conditions Influence the In Vitro Regeneration of the Human Airway Epithelium

Elisa Redman et al. Am J Respir Cell Mol Biol. 2024 Sep.

Abstract

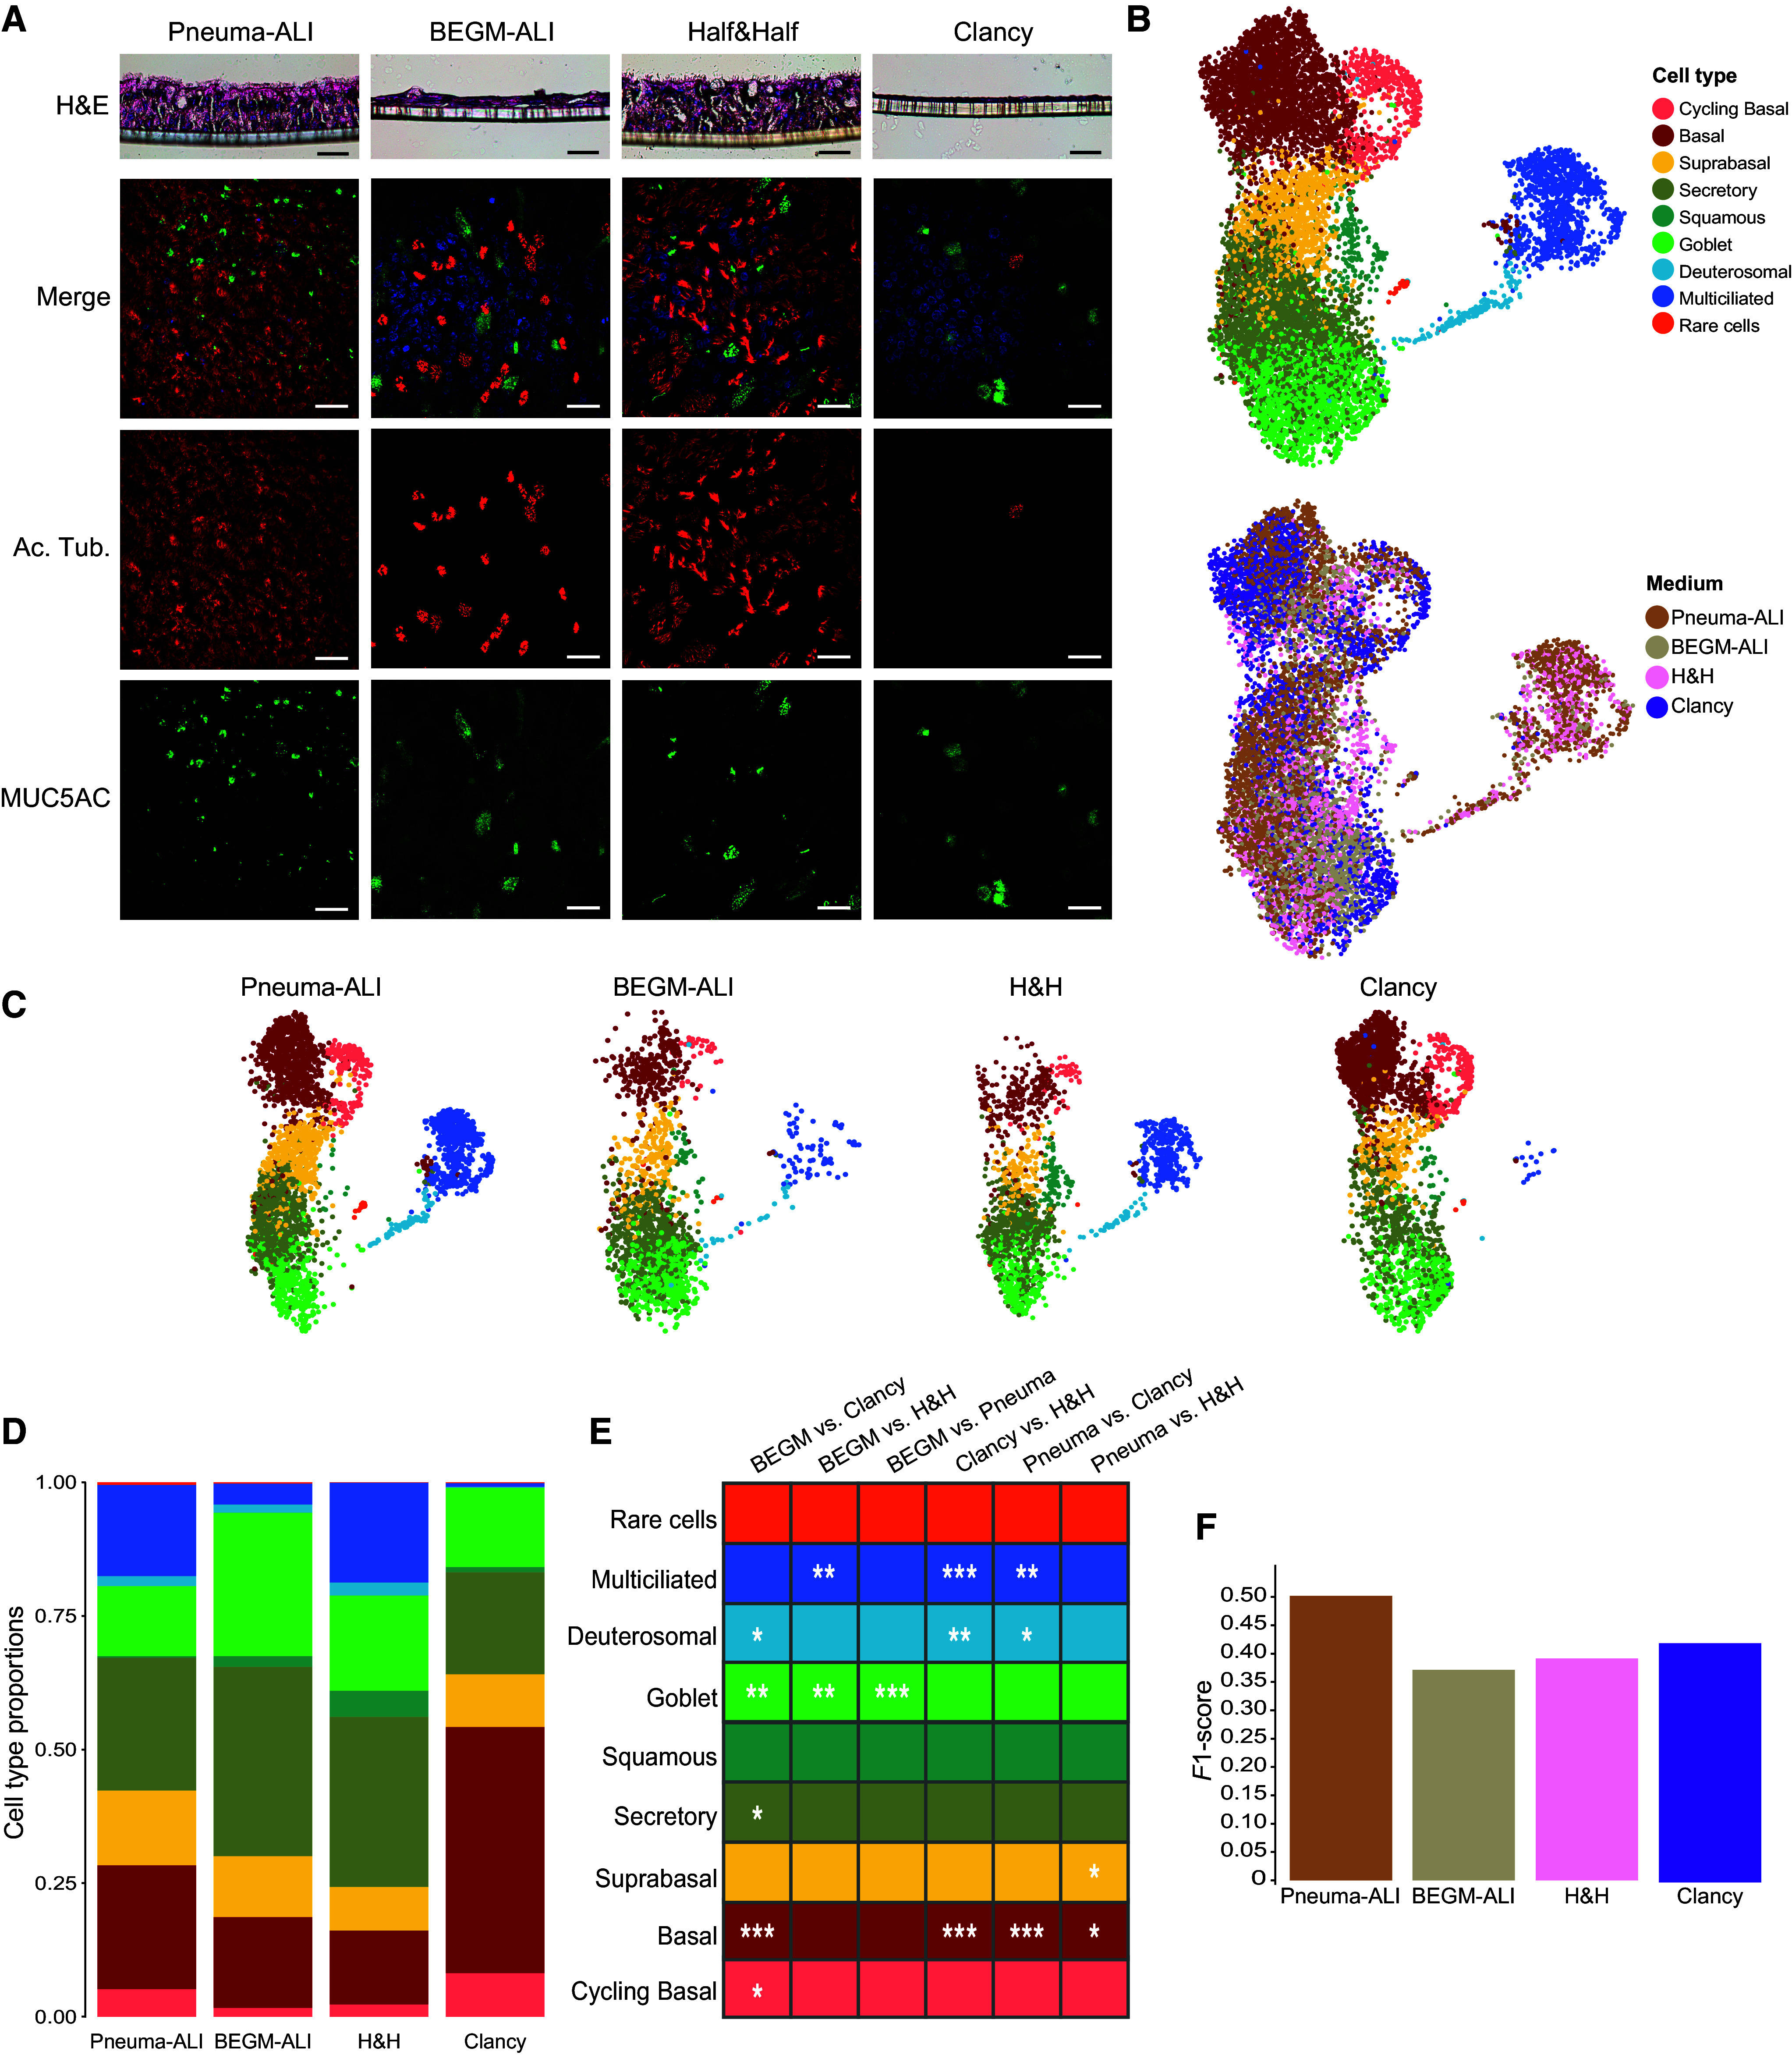
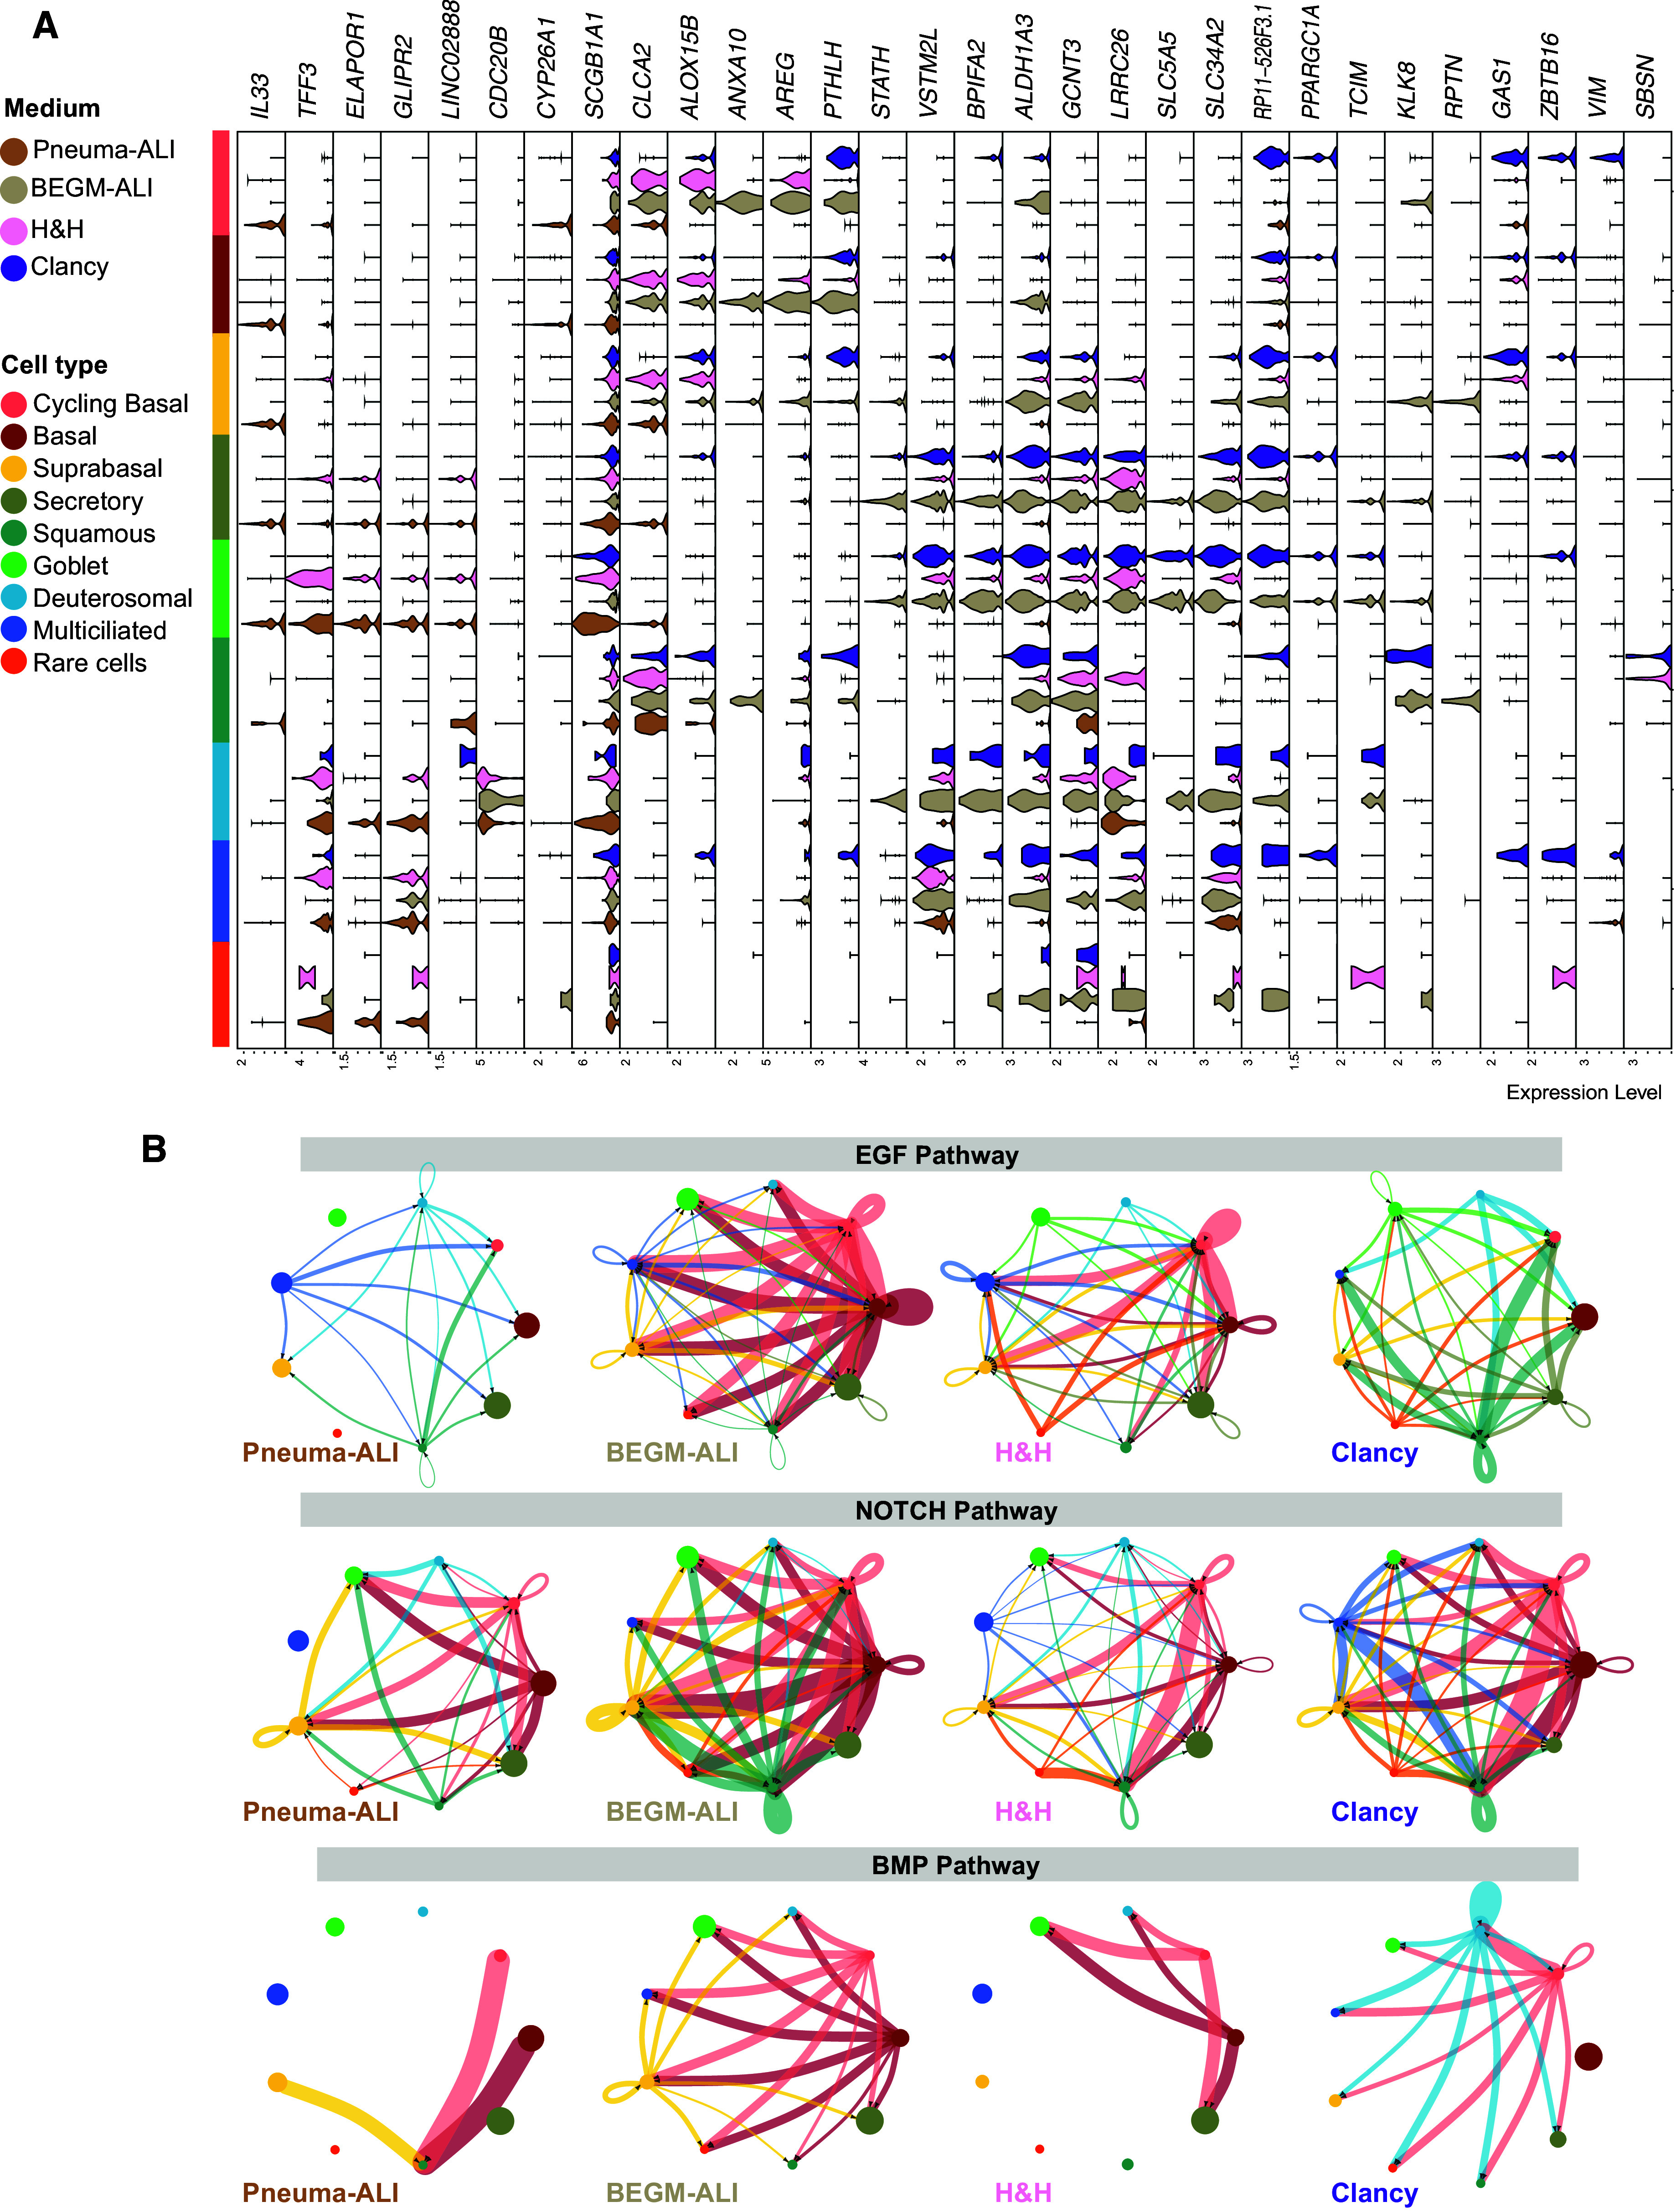
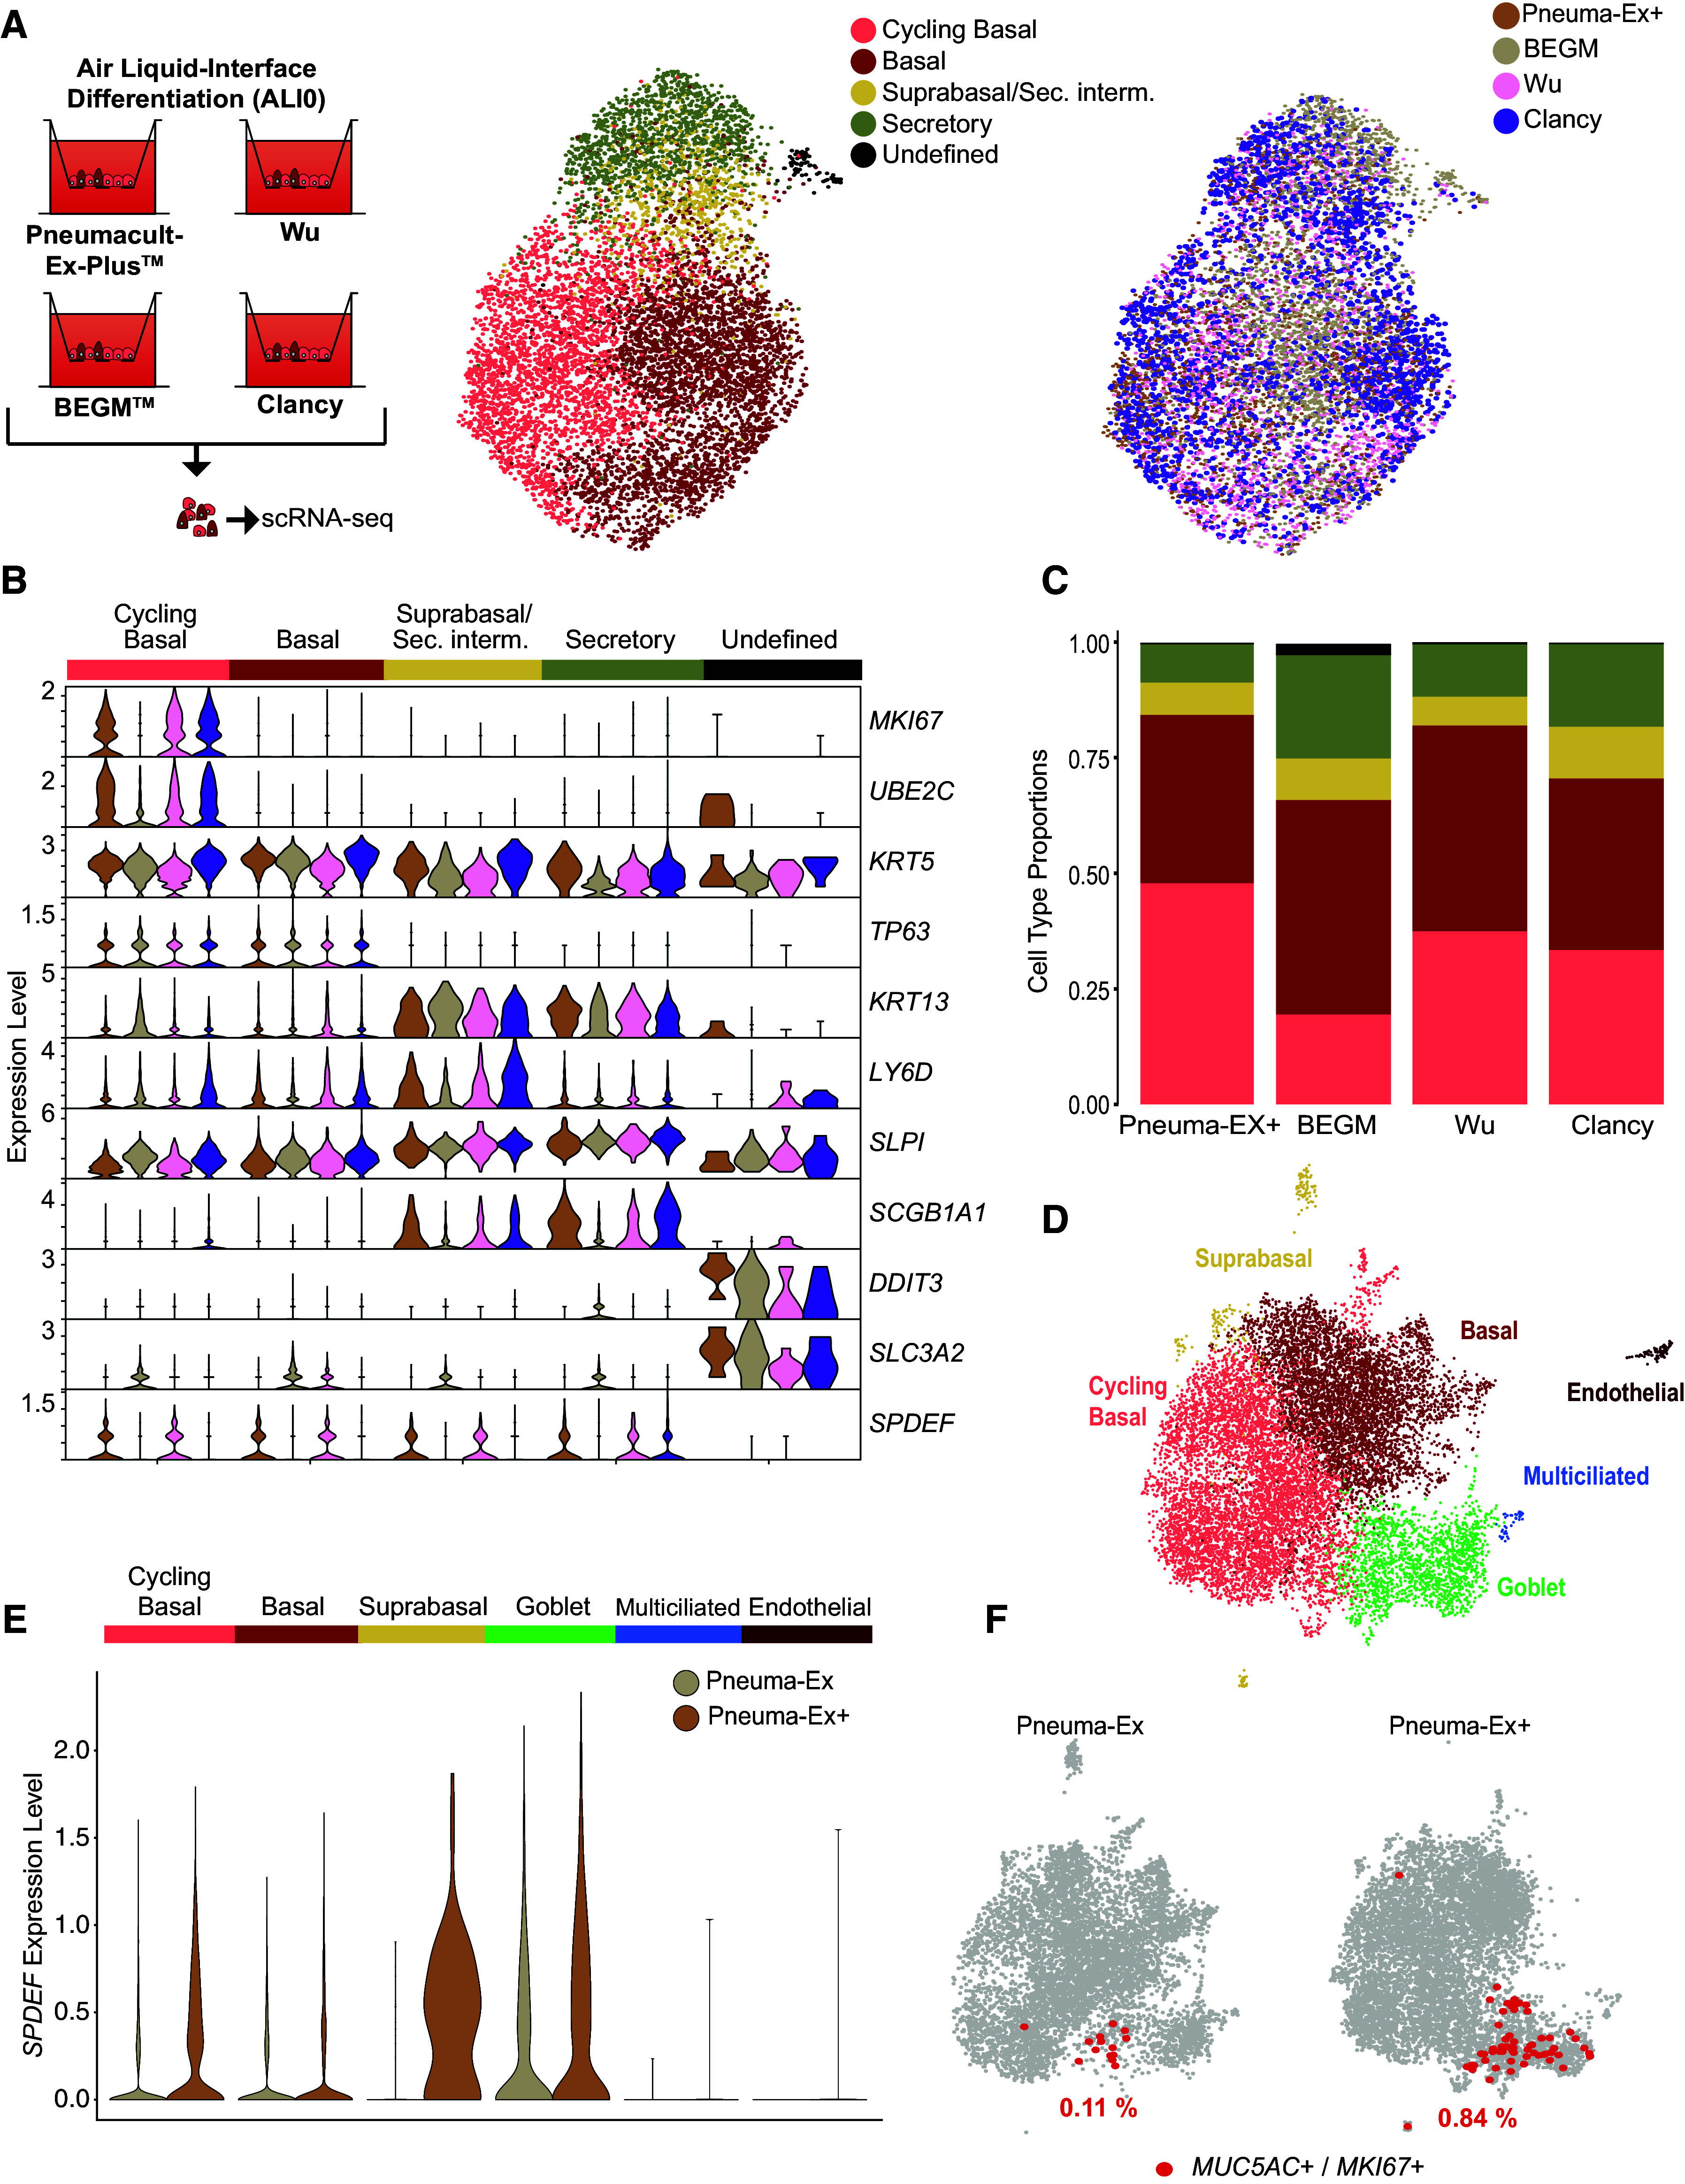
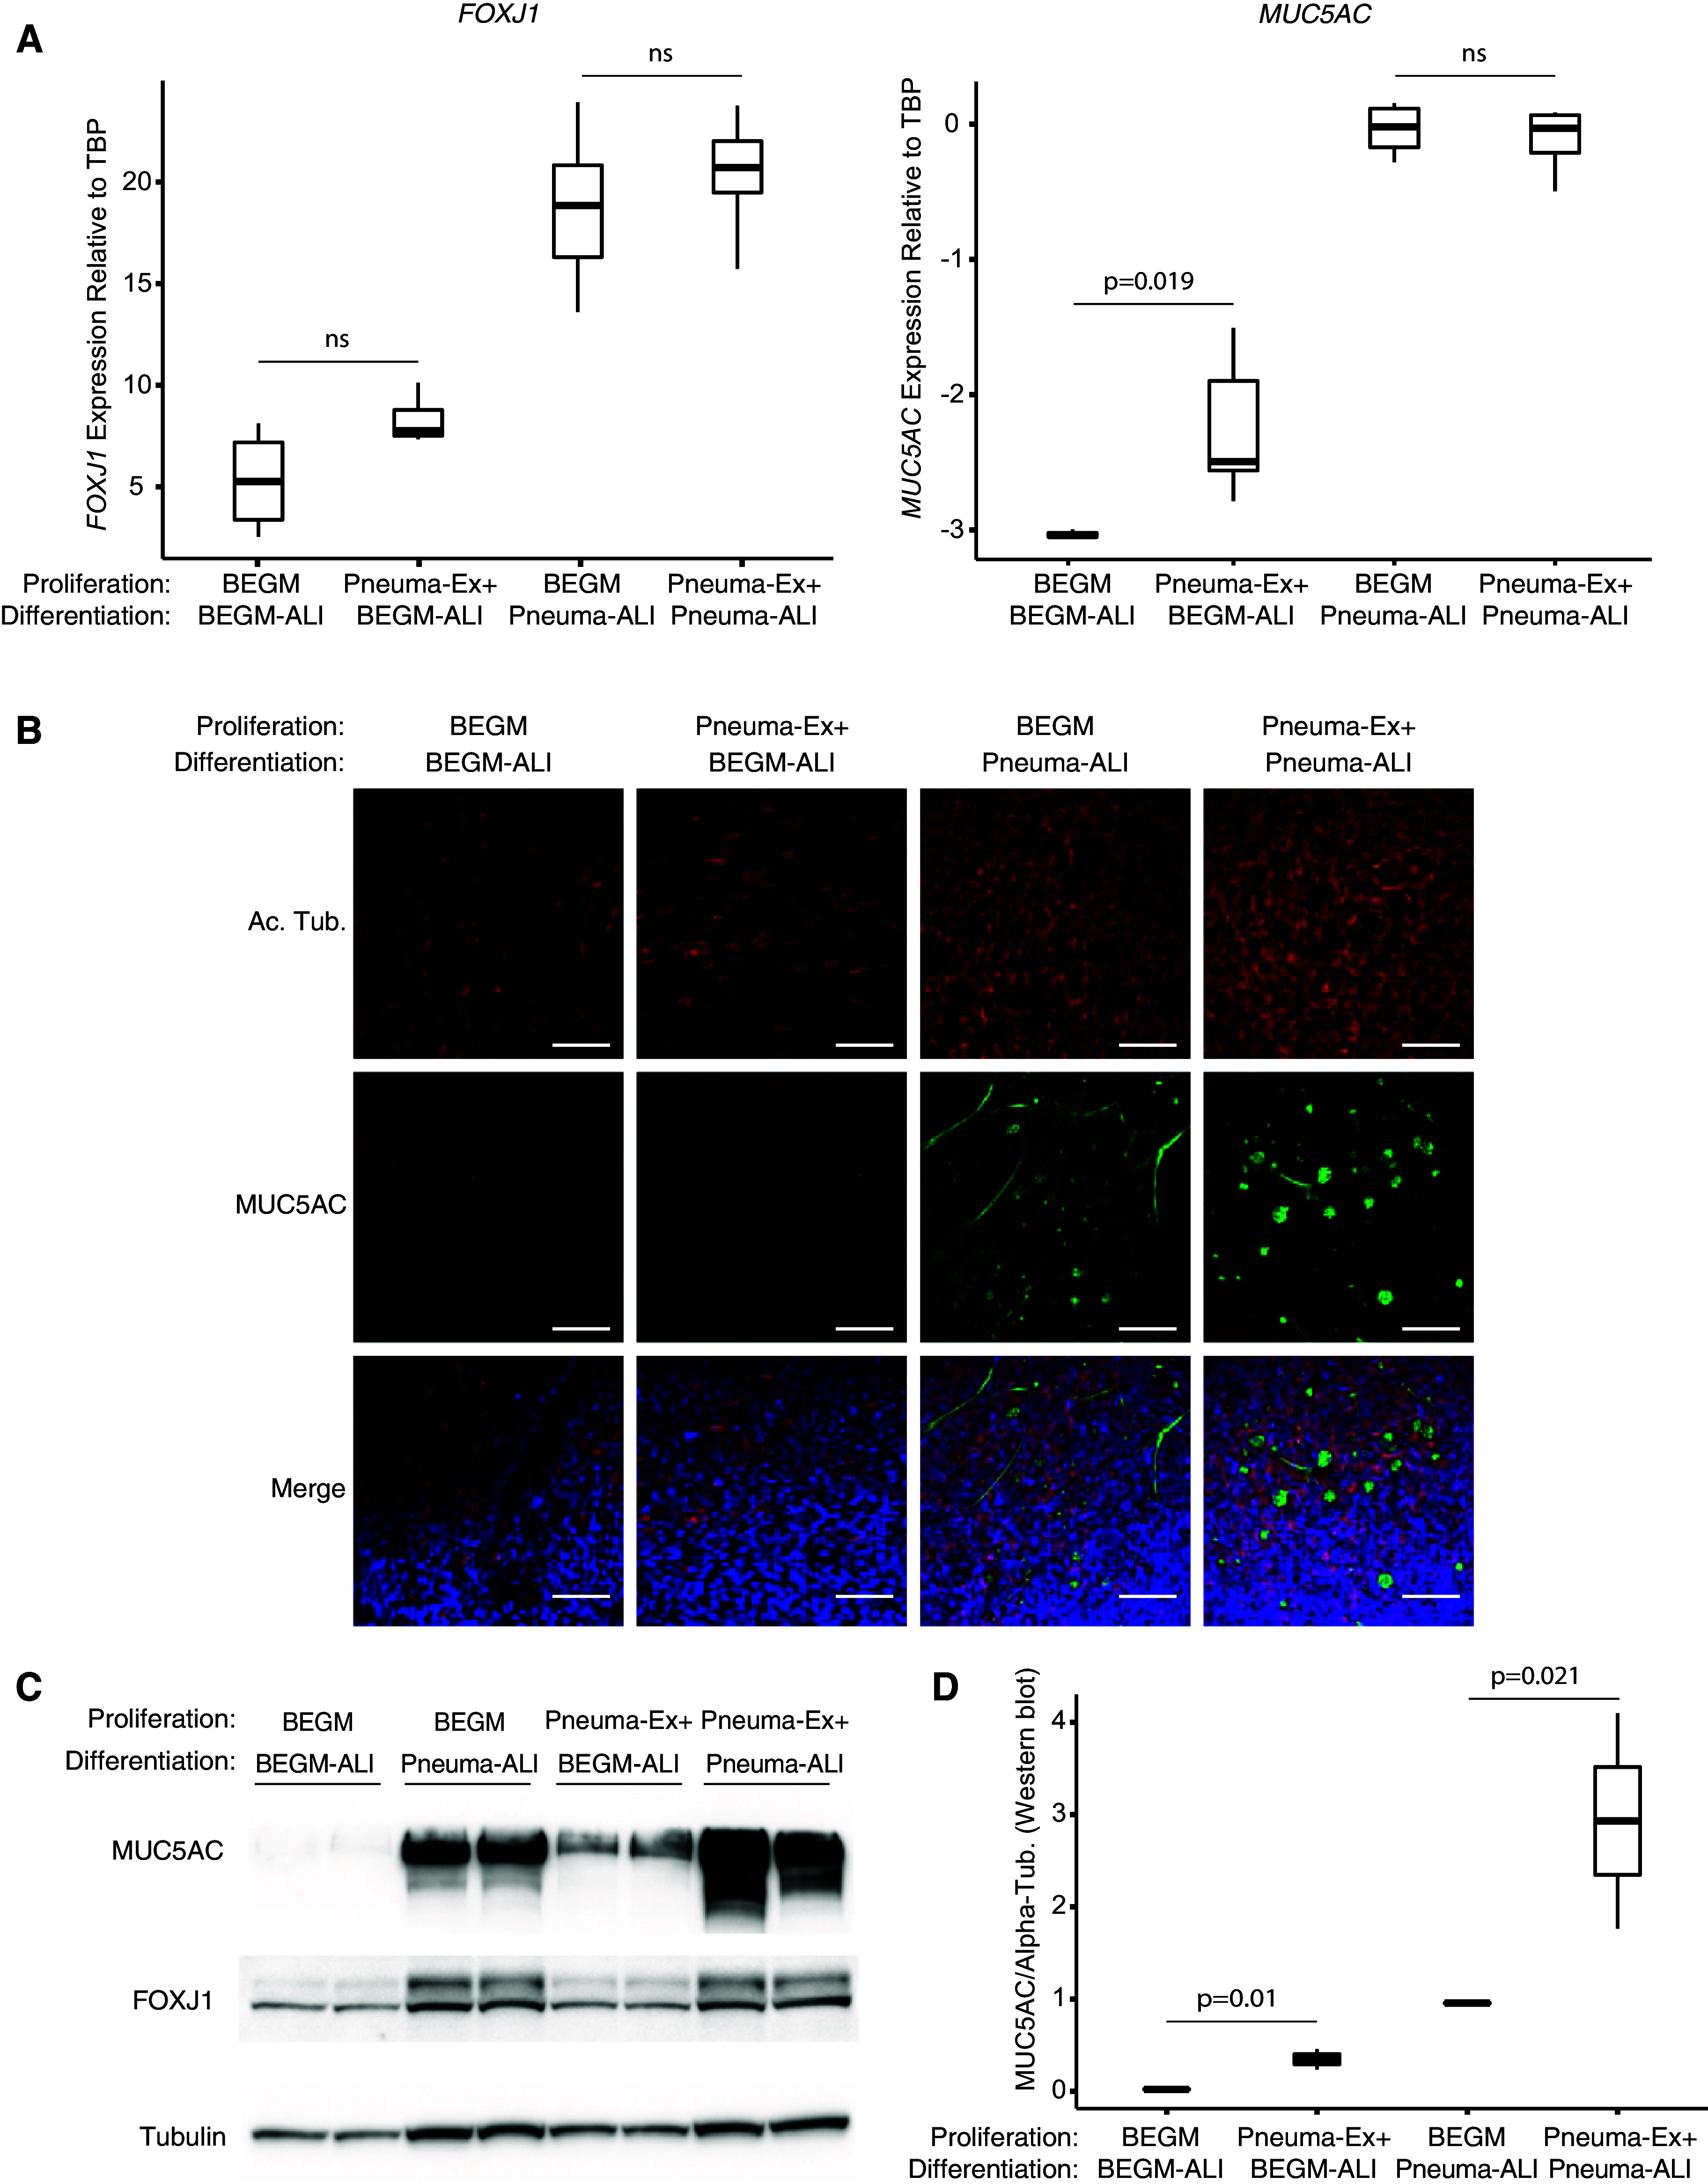
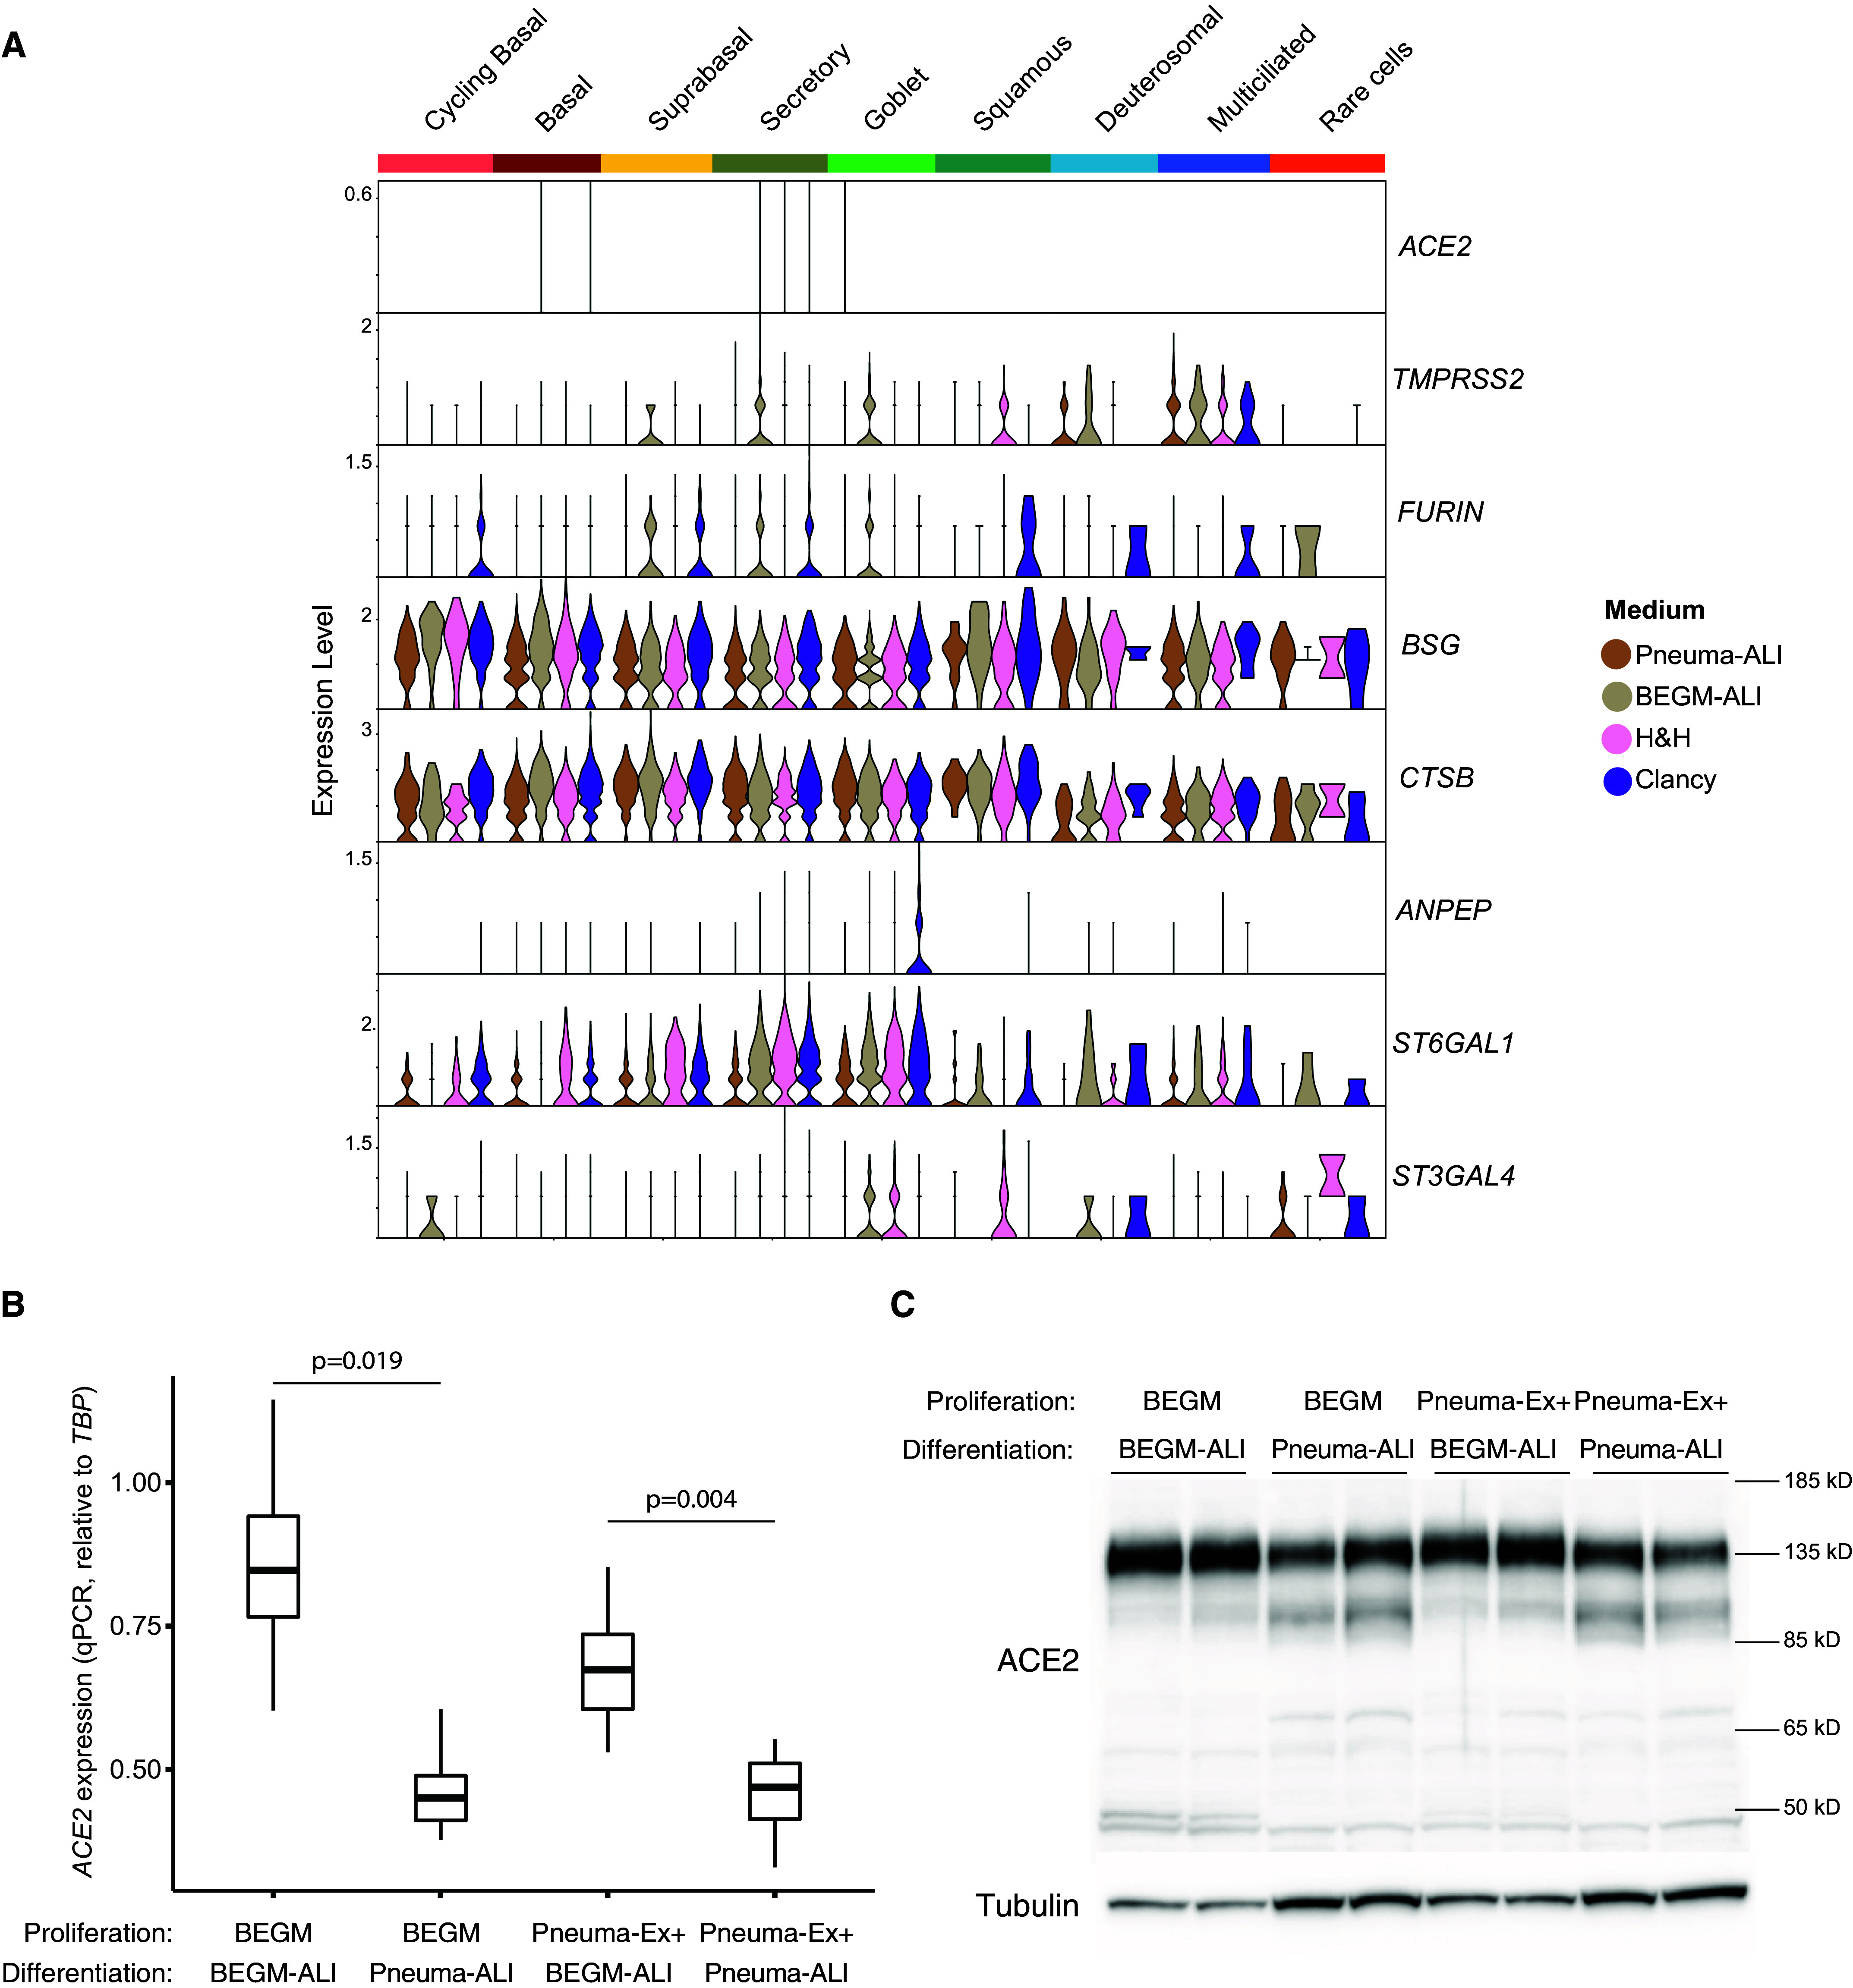
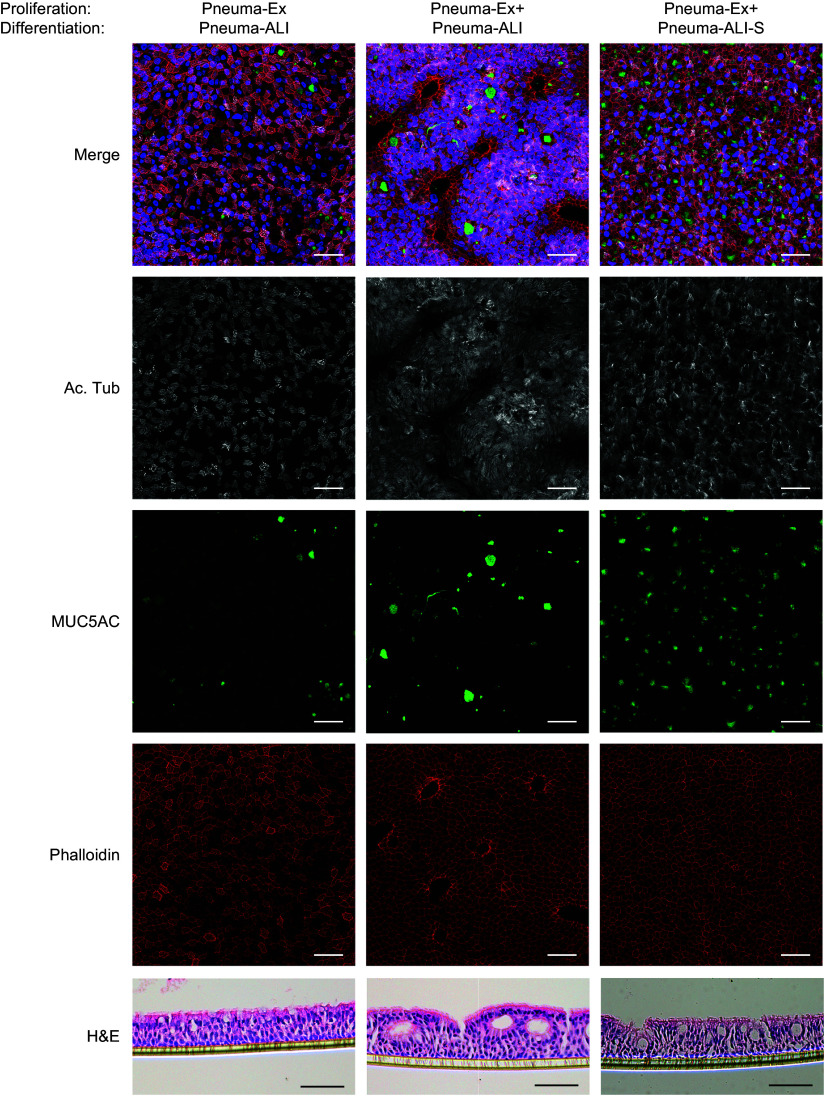
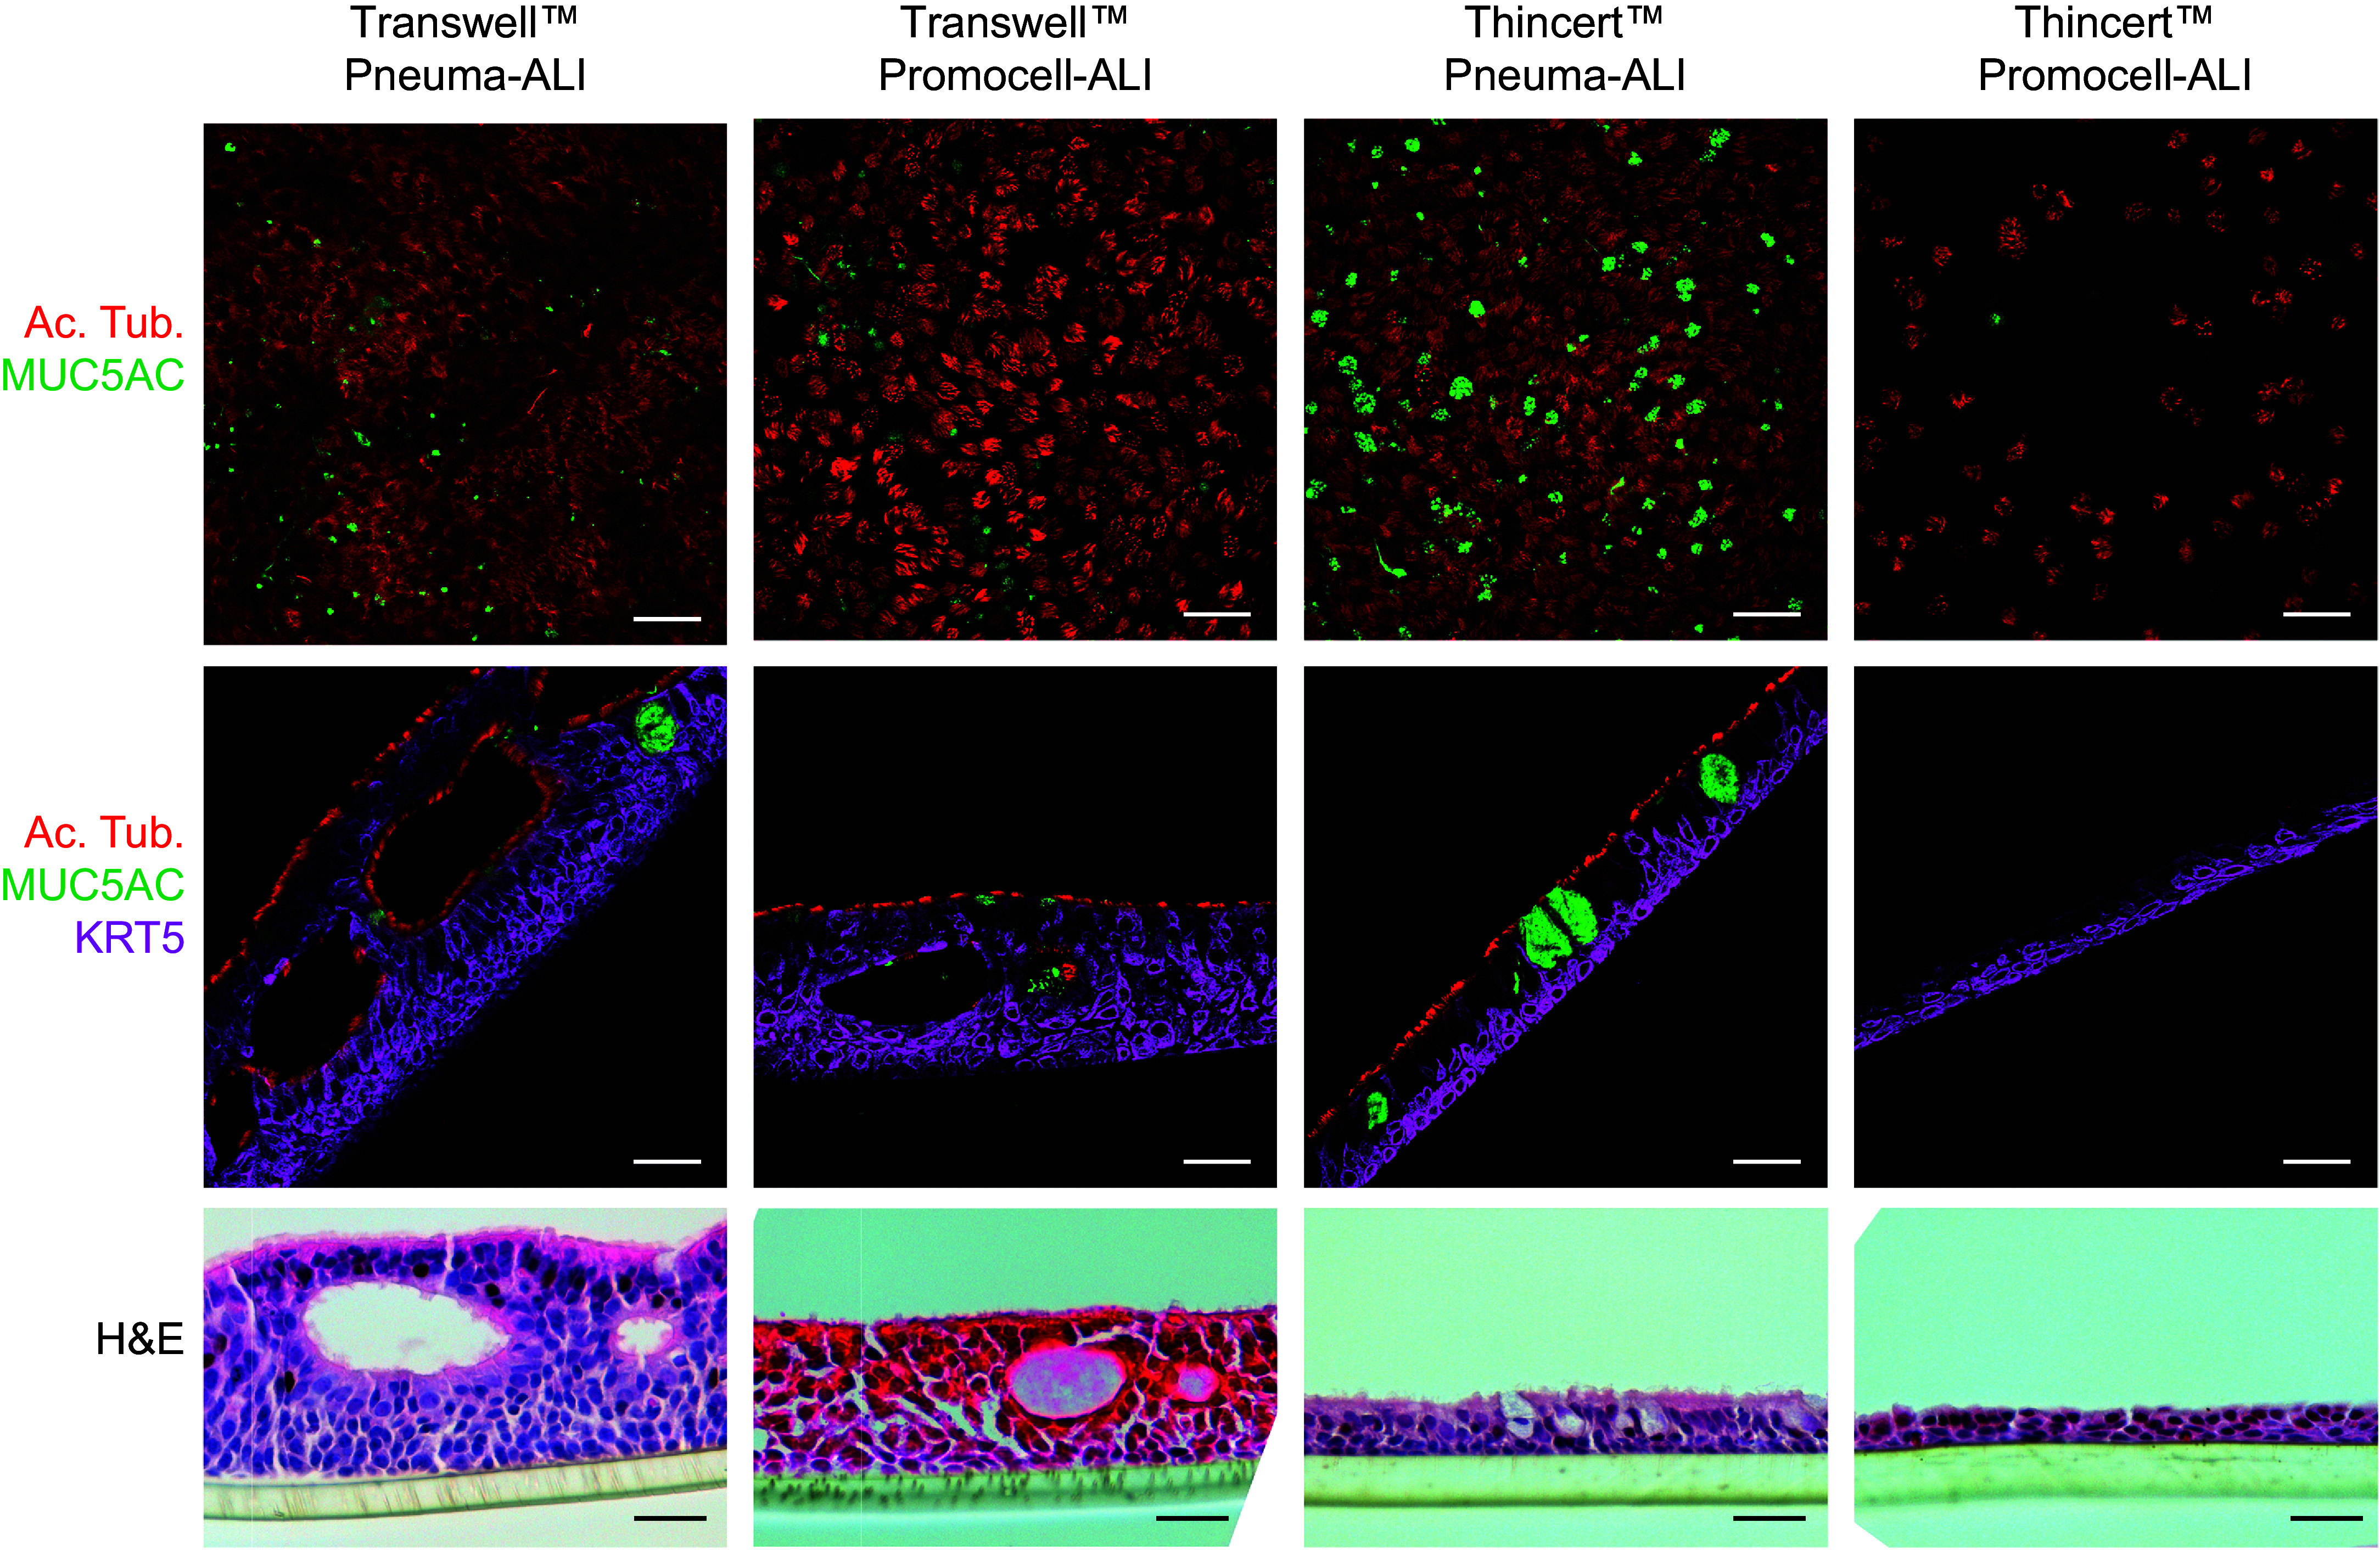
The human airway mucociliary epithelium can be recapitulated in vitro using primary cells cultured in an air-liquid interface (ALI), a reliable surrogate to perform pathophysiological studies. As tremendous variations exist among media used for ALI-cultured human airway epithelial cells, the aim of our study was to evaluate the impact of several media (BEGM, PneumaCult, Half & Half, and Clancy) on cell type distribution using single-cell RNA sequencing and imaging. Our work revealed the impact of these media on cell composition, gene expression profile, cell signaling, and epithelial morphology. We found higher proportions of multiciliated cells in PneumaCult-ALI and Half & Half, stronger EGF signaling from basal cells in BEGM-ALI, differential expression of the severe acute respiratory syndrome coronavirus 2 (SARS-CoV-2) entry factor ACE2, and distinct secretome transcripts depending on the media used. We also established that proliferation in PneumaCult-Ex Plus favored secretory cell fate, showing the key influence of proliferation media on late differentiation epithelial characteristics. Altogether, our data offer a comprehensive repertoire for evaluating the effects of culture conditions on airway epithelial differentiation and will aid in choosing the most relevant medium according to the processes to be investigated, such as cilia, mucus biology, or viral infection. We detail useful parameters that should be explored to document airway epithelial cell fate and morphology.

Keywords: airway epithelium; air–liquid interface cell culture; culture medium; differentiation; single-cell RNA sequencing.


Figures

Figure 1.
Figure 1.
Single-cell RNA sequencing analysis of human bronchial epithelial cells (HBECs) at 28 days of differentiation (ALI28) in four distinct media. (A) General characterization of HBEC differentiation in four cell culture media. (Top) Representative images of H&E staining of sections of HBECs at ALI28. Scale bars, 100 μm. For each condition and each of the two independent cell cultures, two inserts were sectioned and imaged. (Bottom) Representative images of immunostaining of HBECs at ALI28 for acetylated α-tubulin and MUC5AC. Scale bars, 30 μm. Nuclei were stained with DAPI and shown in blue on the merged images. For each condition and each of the two independent cell cultures, three inserts were stained and imaged. (B) Uniform manifold approximation and projection (UMAP) of the integrated dataset of HBECs at ALI28 containing all cells from the four distinct conditions, from two independent cultures from two healthy donors. (Top) UMAP colored by cell type. (Bottom) UMAP colored by medium. (C) UMAPs for each medium, colored by cell type, with color code identical to A. (D) Quantification of cell type proportions in each medium. (E) P value of t test using the propeller package, using the arcsine transformation, for each two-to-two medium comparison of cell type proportions. (F) F1 score derived from universal cell embeddings (UCE) label transfer against the Human Lung Cell Atlas core reference (8). The F1 score is calculated by comparing the predicted labels, obtained through the UCE label transfer method, against those manually annotated using marker genes and clustering; the maximal score is 1. Ac. Tub = acetylated α-tubulin; ALI = air–liquid interface; H&E = hematoxylin and eosin; H&H = Half & Half.
Figure 2.
Figure 2.
Genes and pathways regulated by each cell culture medium at ALI28 of bronchial epithelial cell differentiation. (A) Violin plot showing the top 30 regulated genes among all medium comparisons by pairs. Only genes expressed in at least 30% of cells of at least one cell cluster were selected. The top 30 genes were sorted by the lowest adjusted P value of each comparison by pair. For each gene, expression in the four tested media is shown. (B) Circle plots showing the inferred intercellular communication networks for EGF, NOTCH, and BMP signaling. The edge width is proportional to inferred interaction strengths considering ligand–receptor pairs. Black arrowheads show directionality of the inferred interactions. For B, the color code for cell types is identical to A. BMP = bone morphogenetic protein; EGF = epidermal growth factor; NOTCH = notch receptor.
Figure 3.
Figure 3.
Impact of distinct proliferation media on cell type composition and cell expression at ALI0 of epithelial cell differentiation. (A) Experimental strategy (left) and UMAPs of the integrated dataset at the onset of differentiation of HBECs containing all cells from the four distinct conditions, colored by cell type and by medium according to the indicated color codes (right). (B) Expression of the top 10 marker genes and of SPDEF for the five detected cell populations from A, displayed for each proliferation medium. (C) Quantification of cell type proportions from A for each proliferation medium. (D) UMAP of the integrated dataset composed of human nasal epithelial cell (HNECs) analyzed after the first expansion stage in either PneumaCult-Ex (Pneuma-Ex) or PneumaCult-Ex Plus (Pneuma-Ex+), colored by cell type. (E) Expression of SPDEF by each cell type of dataset from D in either Pneuma-Ex or Pneuma-Ex+, as indicated by color code displayed in D. (F) Identification of MUC5AC+/MKI67+ cells in the integrated dataset composed of HNECs analyzed after the first expansion stage in either Pneuma-Ex or Pneuma-Ex+. Cells were selected if they had normalized expression of MUC5AC of > 1 and MKI67 of > 0.5. The percentage of MUC5AC+/MKI67+ cells for each sample is indicated on the plot. ALI0 = onset of air–liquid interface; scRNA-seq = single-cell RNA sequencing; Sec. interm. = secretory intermediate.
Figure 4.
Figure 4.
Effect of distinct proliferation media on epithelial composition after ALI differentiation of nasal epithelial cultures. (A) Expression of FOXJ1 and MUC5AC (quantitative PCR) on ALI cultures after full differentiation of nasal epithelial cells in the indicated media. Data shown are the values for 2Ct(FOXJ1-TBP) and log10[2Ct(MUC5AC-TBP)] for three independent cultures from three donors. P values are the results of Mann-Whitney U tests. (B) Representative images for immunostaining of MUC5AC and acetylated α-tubulin on HNEC ALI cultures after full differentiation in the indicated media. Scale bars, 30 μm. Nuclei were stained with DAPI and are shown in blue on the merge images. For each condition, three independent cell cultures were performed, and three inserts were stained and imaged for each. (C) Western blot for MUC5AC and FOXJ1 on HNEC ALI cultures after full differentiation in the indicated media. Tubulin was used as loading control. For each condition, two lanes were loaded, each with an independent Transwell membrane from the same culture. (D) Quantification of the MUC5AC signal from C; P values are the results of Welch’s t tests. For each condition, three independent cell cultures were performed, and two inserts were used for western blot. Data from the additional cultures are shown in Figure E11. ns = not significant.
Figure 5.
Figure 5.
Effect of proliferation and differentiation media on ACE2 expression at ALI28 of epithelial cell differentiation. (A) Violin plot showing expression of severe acute respiratory syndrome coronavirus 2 (SARS-CoV-2) entry factors in each of the four media conditions used for HBECs at ALI28 (Figure 1B). (B) qPCR for ACE2 on three independent HNEC ALI cultures from three donors after proliferation and full differentiation in the indicated media. Data shown are the values for 2Ct(ACE2-TBP) for three independent cultures from three donors. P values are the results of Mann-Whitney U tests. (C) Western blot for ACE2 on HNEC ALI cultures after full differentiation in the indicated media. Tubulin was used as loading control. For each condition, three independent cell cultures were performed, and two inserts were used for western blot. Data from two additional independent cultures are shown in Figure E12. qPCR = quantitative polymerase chain reaction.
Figure 6.
Figure 6.
Effect of an alternative differentiation medium on epithelial composition after ALI differentiation of nasal epithelial cells. (Top) Representative images of immunostaining for MUC5AC and Ac. Tub. on HNEC ALI cultures after full differentiation in the indicated media. Phalloidin was used to stain for actin. Nuclei were stained with DAPI and are shown in blue on the merge images. Scale bars, 30 μm. (Bottom) H&E staining of sections of paraffin-embedded epithelia. Scale bars, 100 μm. For each condition, one cell culture was performed, and two inserts were stained and imaged. Additional images are shown in Figure E13.
Figure 7.
Figure 7.
Effect of cell culture inserts and differentiation media on epithelial composition after ALI differentiation of nasal epithelial cultures. (Top) Representative images of immunostaining on whole inserts for MUC5AC and Ac. Tub. on HNEC ALI cultures after full differentiation in the indicated media. Scale bars, 30 μm. (Middle) Representative images of immunostaining on sections of inserts for MUC5AC and Ac. Tub. on ALI cultures after full differentiation in the indicated media. Scale bars, 30 μm. (Bottom) Representative images of H&E staining of sections of paraffin-embedded inserts. Scale bars, 100 μm. For each condition, two inserts were stained and imaged.

Similar articles

Cited by

References

    1. Sikkema L, Ramírez-Substage C, Strobl DC, Gillett TE, Zappia L, Madissoon E, et al. Lung Biological Network Consortium An integrated cell atlas of the lung in health and disease. Nat Med . 2023;29:1563–1577. - PMC - PubMed
    1. Surve MV, Lin B, Reedy JL, Crossen AJ, Xu A, Klein BS, et al. Single-cell transcriptomes, lineage, and differentiation of functional airway microfold cells. Am J Respir Cell Mol Biol . 2023;69:698–701. - PMC - PubMed
    1. Hogan B, Tata PR. Cellular organization and biology of the respiratory system. Nat Cell Biol . 2019 doi: 10.1038/s41556-019-0357-7. - DOI - PubMed
    1. Deprez M, Zaragosi L-E, Truchi M, Bécavin C, Ruiz García S, Arguel MJ, et al. A single-cell atlas of the human healthy airways. Am J Respir Crit Care Med . 2020;202:1636–1645. - PubMed
    1. Zepp JA, Morrisey EE. Cellular crosstalk in the development and regeneration of the respiratory system. Nat Rev Mol Cell Biol . 2019;20:551–566. - PMC - PubMed