. 2024 Jul;631(8022):819-825.
doi: 10.1038/s41586-024-07597-5. Epub 2024 Jun 6.

Widespread horse-based mobility arose around 2200 BCE in Eurasia

Pablo Librado  1   2 Gaetan Tressières  3 Lorelei Chauvey  3 Antoine Fages  3   4 Naveed Khan  3   5 Stéphanie Schiavinato  3 Laure Calvière-Tonasso  3 Mariya A Kusliy  3   6 Charleen Gaunitz  3   7 Xuexue Liu  3 Stefanie Wagner  3   8 Clio Der Sarkissian  3 Andaine Seguin-Orlando  3 Aude Perdereau  9 Jean-Marc Aury  10 John Southon  11 Beth Shapiro  12 Olivier Bouchez  13 Cécile Donnadieu  13 Yvette Running Horse Collin  3   14 Kristian M Gregersen  15 Mads Dengsø Jessen  16 Kirsten Christensen  17 Lone Claudi-Hansen  17 Mélanie Pruvost  18 Erich Pucher  19 Hrvoje Vulic  20 Mario Novak  21 Andrea Rimpf  22 Peter Turk  23 Simone Reiter  24 Gottfried Brem  24 Christoph Schwall  25   26 Éric Barrey  27 Céline Robert  27   28 Christophe Degueurce  28 Liora Kolska Horwitz  29 Lutz Klassen  30 Uffe Rasmussen  31 Jacob Kveiborg  32 Niels Nørkjær Johannsen  33 Daniel Makowiecki  34 Przemysław Makarowicz  35 Marcin Szeliga  36 Vasyl Ilchyshyn  37 Vitalii Rud  38 Jan Romaniszyn  35 Victoria E Mullin  39 Marta Verdugo  39 Daniel G Bradley  39 João L Cardoso  40   41 Maria J Valente  42 Miguel Telles Antunes  43 Carly Ameen  44 Richard Thomas  45 Arne Ludwig  46   47 Matilde Marzullo  48 Ornella Prato  48 Giovanna Bagnasco Gianni  48 Umberto Tecchiati  48 José Granado  49 Angela Schlumbaum  49 Sabine Deschler-Erb  49 Monika Schernig Mráz  49 Nicolas Boulbes  50 Armelle Gardeisen  51 Christian Mayer  52 Hans-Jürgen Döhle  53 Magdolna Vicze  54 Pavel A Kosintsev  55   56 René Kyselý  57 Lubomír Peške  58 Terry O'Connor  59 Elina Ananyevskaya  60 Irina Shevnina  61 Andrey Logvin  61 Alexey A Kovalev  62 Tumur-Ochir Iderkhangai  63 Mikhail V Sablin  64 Petr K Dashkovskiy  65 Alexander S Graphodatsky  6 Ilia Merts  66   67 Viktor Merts  66 Aleksei K Kasparov  68 Vladimir V Pitulko  68   69 Vedat Onar  70 Aliye Öztan  71 Benjamin S Arbuckle  72 Hugh McColl  7 Gabriel Renaud  3   73 Ruslan Khaskhanov  74 Sergey Demidenko  75 Anna Kadieva  76 Biyaslan Atabiev  77 Marie Sundqvist  78 Gabriella Lindgren  79   80 F Javier López-Cachero  81 Silvia Albizuri  81 Tajana Trbojević Vukičević  82 Anita Rapan Papeša  20 Marcel Burić  83 Petra Rajić Šikanjić  84 Jaco Weinstock  85 David Asensio Vilaró  86 Ferran Codina  87 Cristina García Dalmau  88 Jordi Morer de Llorens  89 Josep Pou  90 Gabriel de Prado  91 Joan Sanmartí  92   93 Nabil Kallala  94   95 Joan Ramon Torres  96 Bouthéina Maraoui-Telmini  95 Maria-Carme Belarte Franco  92   97   98 Silvia Valenzuela-Lamas  99   100 Antoine Zazzo  101 Sébastien Lepetz  101 Sylvie Duchesne  3 Anatoly Alexeev  102 Jamsranjav Bayarsaikhan  103   104 Jean-Luc Houle  105 Noost Bayarkhuu  106 Tsagaan Turbat  106 Éric Crubézy  3 Irina Shingiray  107 Marjan Mashkour  101   108 Natalia Ya Berezina  109 Dmitriy S Korobov  75 Andrey Belinskiy  110 Alexey Kalmykov  110 Jean-Paul Demoule  111 Sabine Reinhold  112 Svend Hansen  112 Barbara Wallner  24 Natalia Roslyakova  113 Pavel F Kuznetsov  113 Alexey A Tishkin  67 Patrick Wincker  10 Katherine Kanne  44   114 Alan Outram  44 Ludovic Orlando  115
Affiliations

Widespread horse-based mobility arose around 2200 BCE in Eurasia

Pablo Librado et al. Nature. 2024 Jul.

Abstract

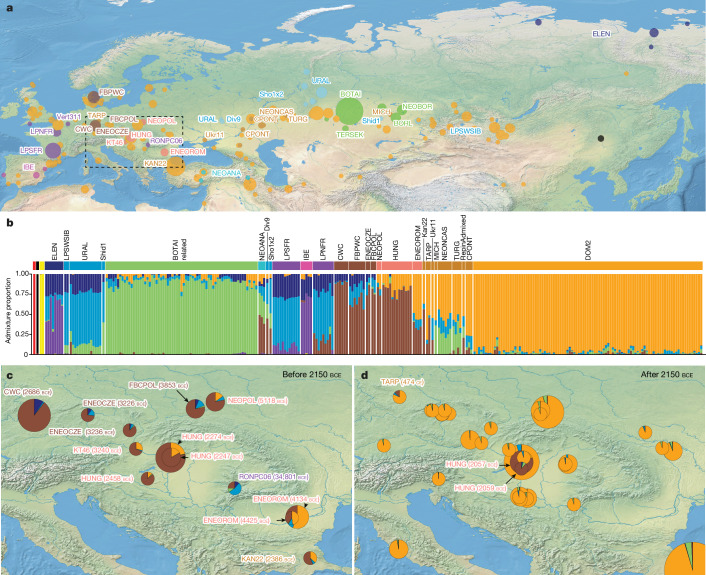
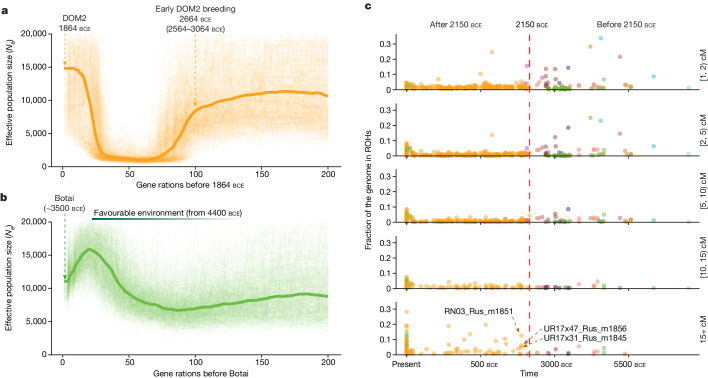
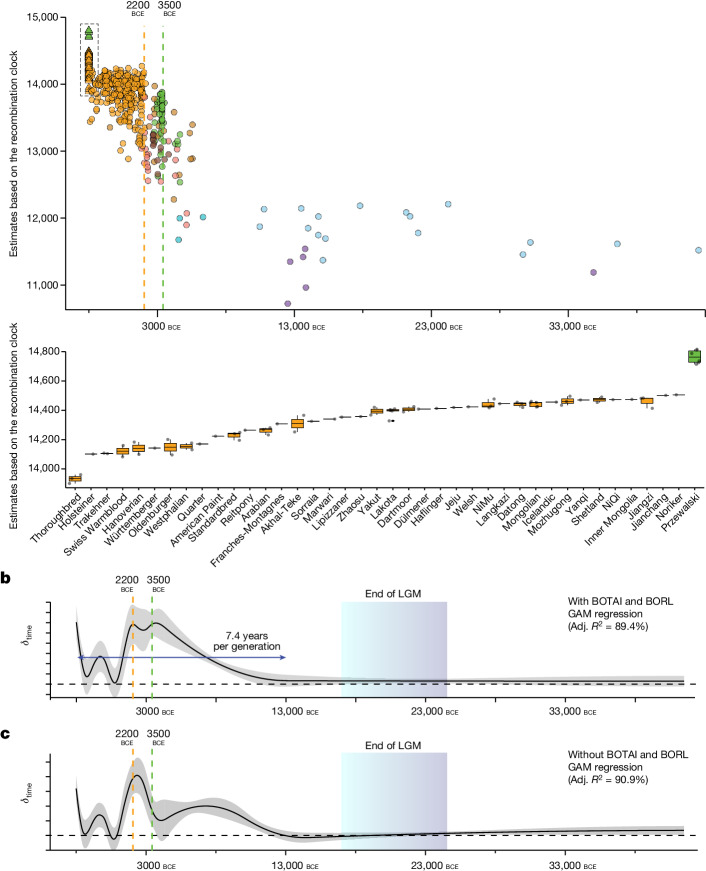
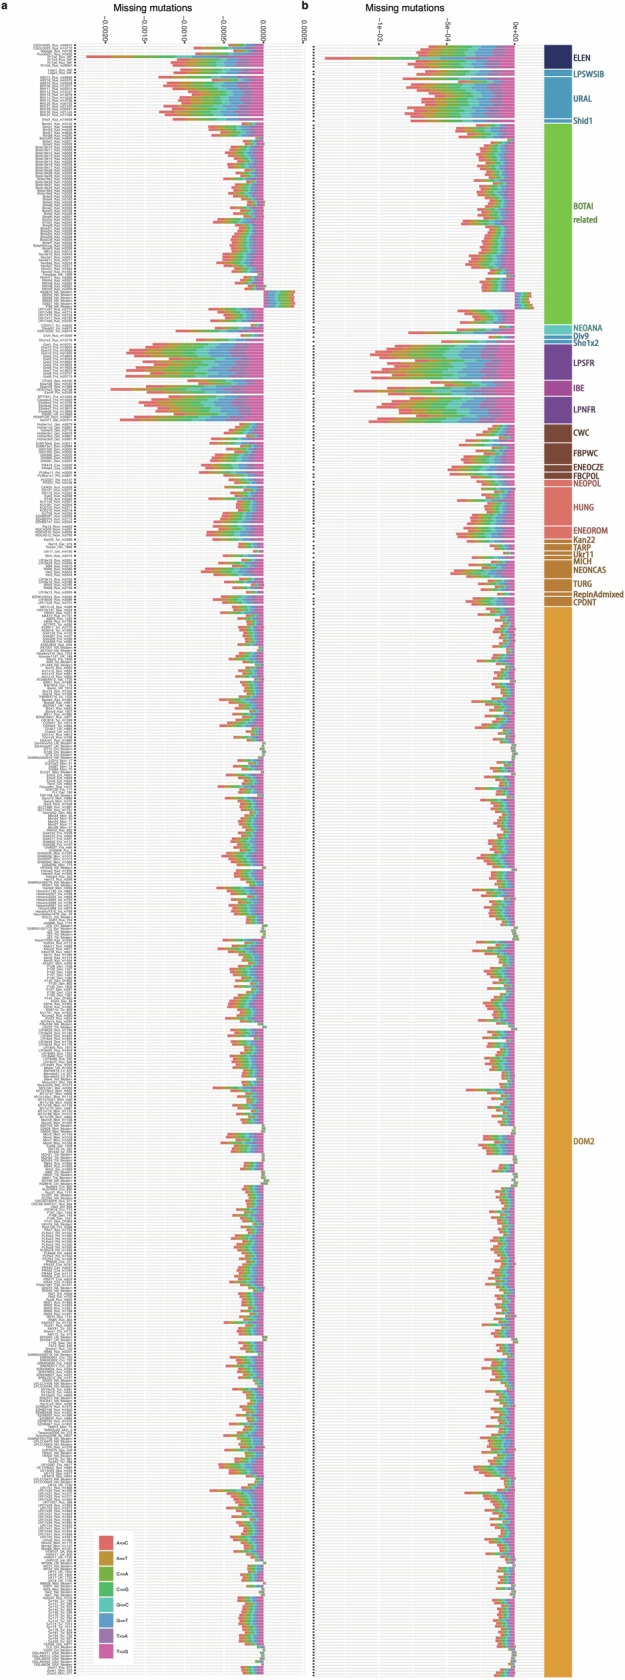
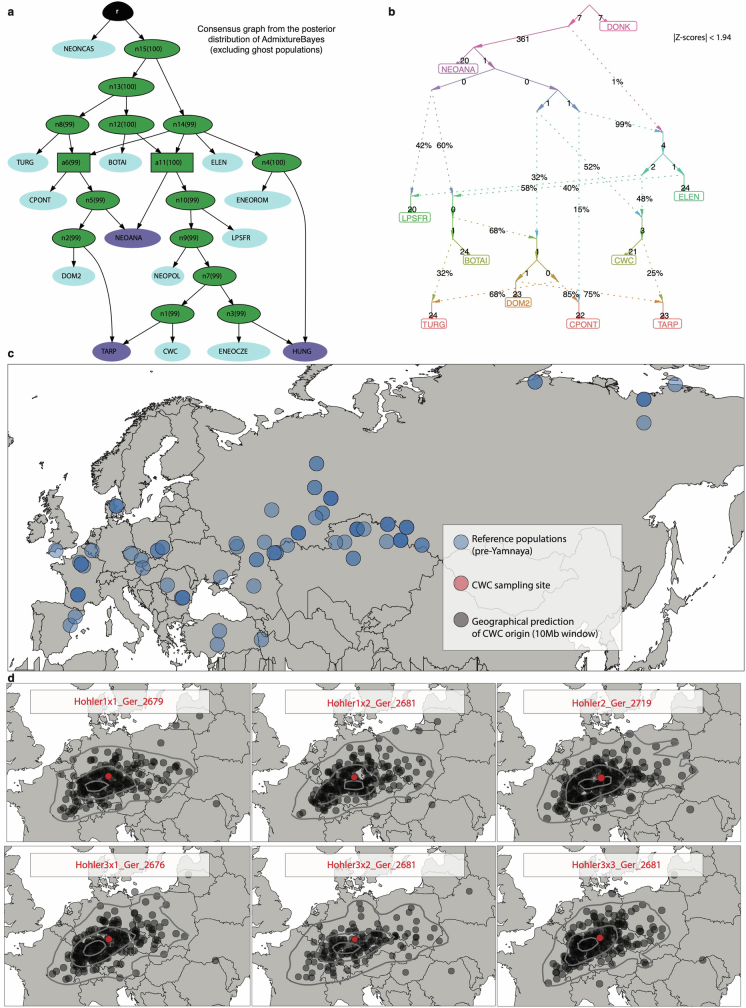
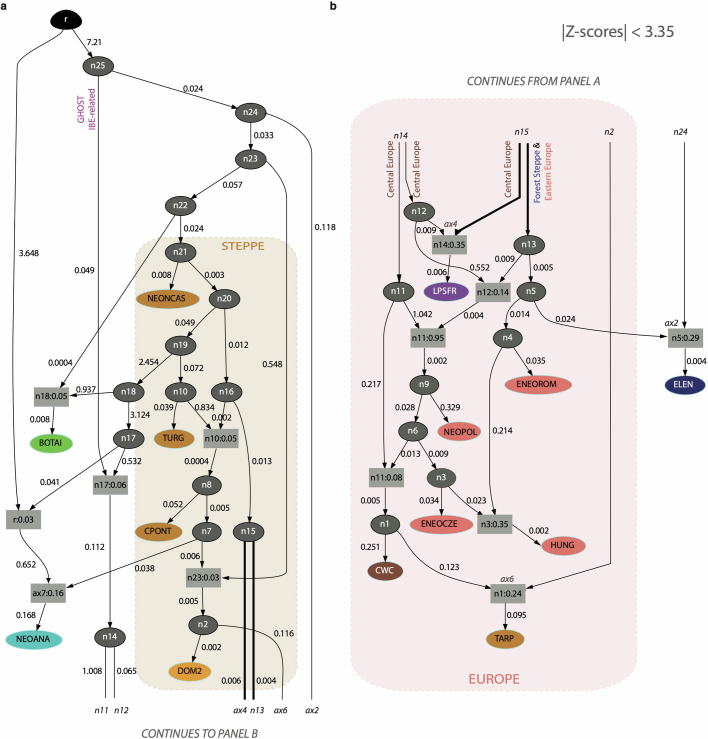
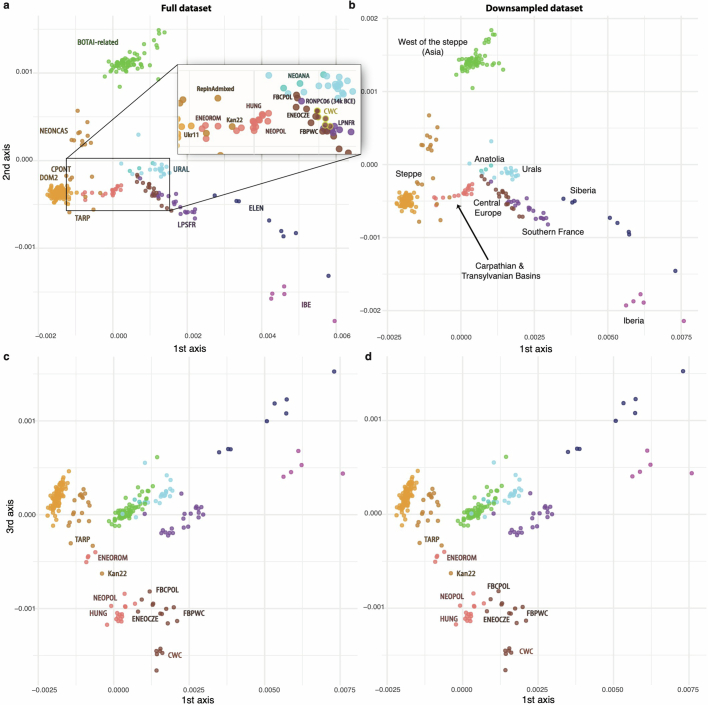
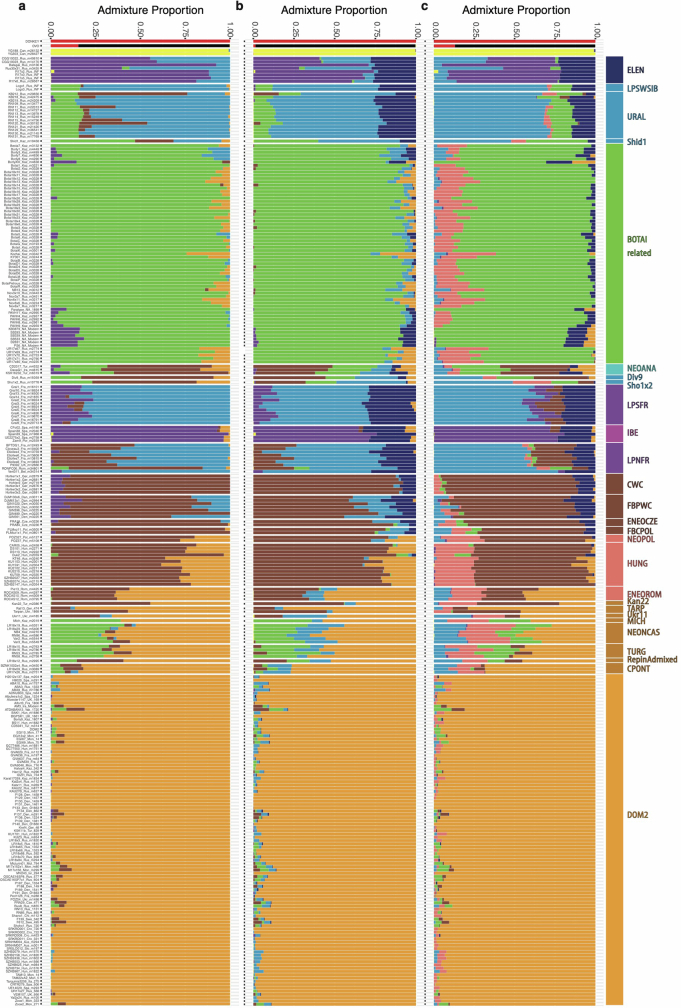
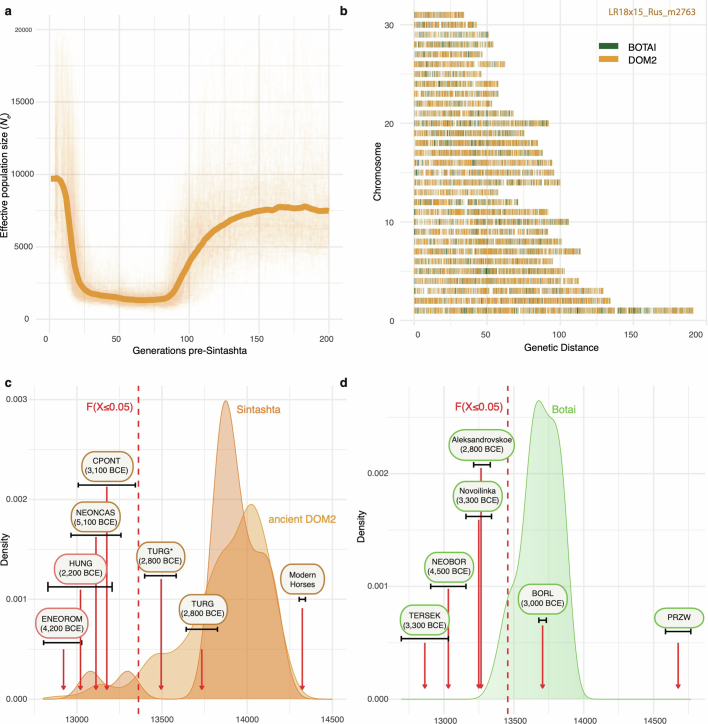
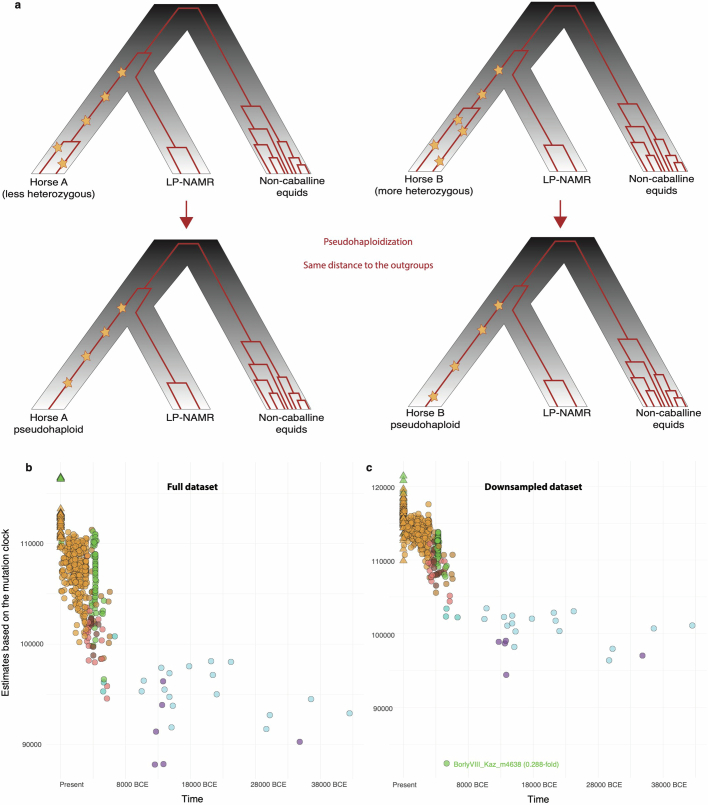
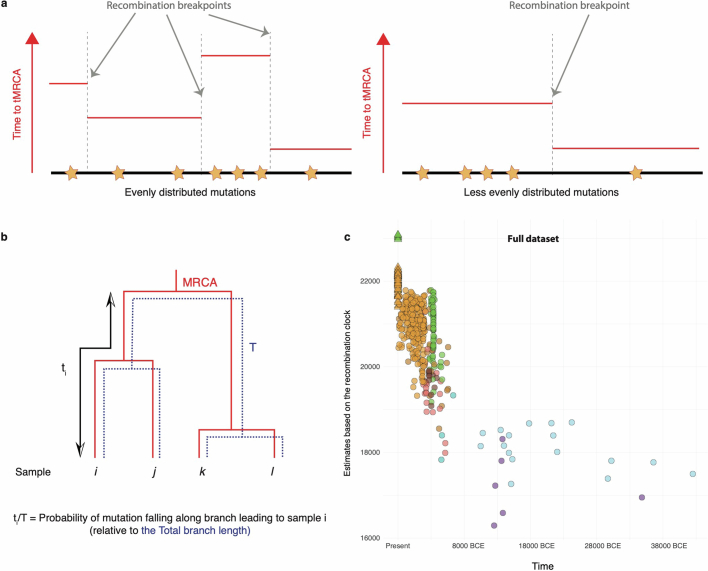
Horses revolutionized human history with fast mobility1. However, the timeline between their domestication and their widespread integration as a means of transport remains contentious2-4. Here we assemble a collection of 475 ancient horse genomes to assess the period when these animals were first reshaped by human agency in Eurasia. We find that reproductive control of the modern domestic lineage emerged around 2200 BCE, through close-kin mating and shortened generation times. Reproductive control emerged following a severe domestication bottleneck starting no earlier than approximately 2700 BCE, and coincided with a sudden expansion across Eurasia that ultimately resulted in the replacement of nearly every local horse lineage. This expansion marked the rise of widespread horse-based mobility in human history, which refutes the commonly held narrative of large horse herds accompanying the massive migration of steppe peoples across Europe around 3000 BCE and earlier3,5. Finally, we detect significantly shortened generation times at Botai around 3500 BCE, a settlement from central Asia associated with corrals and a subsistence economy centred on horses6,7. This supports local horse husbandry before the rise of modern domestic bloodlines.


Conflict of interest statement

The authors declare no competing interests.

Figures

Fig. 1
Fig. 1. Geographic distribution and genetic profiles of the 475 ancient horse genomes analysed in this study.
a, Geographic location of the archaeological sites. The size of each location is proportional to the number of horse genomes sequenced. The black dot points to the location of E. ovodovi outgroups. b, Struct-f4 genetic ancestry profiles considering K = 9 components. The top panel provides the colour legend for a. c,d, Genetic ancestry profiles (K = 9) across central Europe, the Carpathian and Transylvanian Basins before (c) and after (d) 2150 bce. The midpoint of the radiocarbon dating range obtained for each site is indicated between parentheses.
Fig. 2
Fig. 2. Horse demographic trajectory and inbreeding profiles.
a, GONE demographic reconstruction based on 24 early DOM2 horse genomes; the thicker line depicts the most likely effective population size up to 200 generations preceding about 1864 bce, and the thinner lines are 500 bootstrap pseudo-replicates. Conversions to calendar years bce assume either average generation times of 8 (7–12) years or our refined estimate for the time periods considered. b, Same as a but for a set of 28 Botai horse genomes. c, Total fraction of the genome encompassing ROHs of various sizes, in which each dot represents a horse genome. For example, the category [1, 2) cM indicates the fraction of a genome within ROHs that are longer than or equal to 1 cM, but shorter than 2 cM.
Fig. 3
Fig. 3. Horse generation times.
a, Number of generations evolved since the MRCA of all samples, as estimated from the recombination clock (y axis) for each radiocarbon-dated horse specimen (x axis, age of the specimen; n = 483). Samples are colour-coded according to Fig. 1a. The bottom panel breaks down the number of generations evolved for modern breeds. Each box plot summarizes the estimates per breed (Supplementary Table 1), including its corresponding centre (median), box boundaries (interquartile range) and whiskers (1.5 times the interquartile range). b, Time periods associated with significant changes in horse generation times. The graph represents the slope (δtime) of a GAM regressing radiocarbon dates and number of generations evolved since the MRCA while controlling for sequencing depth and population structure. This slope is, thus, proportional to the generation time at a particular time period. The double-sided arrow reports the average generation time in the past 15,000 years (Supplementary Information). The error band represents the 95% confidence interval for the GAM regressions. c, Same as b but excluding BOTAI and BORL population groups. LGM, Last Glacial Maximum.
Extended Data Fig. 1
Extended Data Fig. 1. QC filtering.
a) Histogram showing the distance between adjacent nucleotide transversions, if separated by less than 1Kbp. This revealed an excess of mutations at contiguous genomic positions (ie. 1 bp away). Although these could correspond to true single nucleotide polymorphism (SNPs) or multiple nucleotide variants (MNVs), they could also be enriched for spurious variants resulting from mis-mapping around small DNA insertions and deletions. b) Proportion of mutations within pre-defined MAF bins (Minor Allele Frequency), as a function of missingness across the specimens. Pre-defined MAF bins range from low- (pink) to high-frequency variants (green). The dashed line delimits the positions included (left) or excluded (right) from the analyses. The identifiability of low-frequency variants decreases with greater missingness, as expected. c) Same as panel a), for the ~7.1 M nucleotide transversions of the downsampled data set. d) Same as panel b), for the ~7.1 M nucleotide transversions of the downsampled data set.
Extended Data Fig. 2
Extended Data Fig. 2. Relative error rates.
Missing mutations per site in a test genome (y-axis), relative to a modern Icelandic horse (P5782_Ice_Modern) used as high-quality reference. a) for the full data set and SNP_pval 0. b) for the downsampled data set and SNP_val 0.
Extended Data Fig. 3
Extended Data Fig. 3. On the origins of CWC horses.
a) Consensus admixture graph generated from the posterior distribution of AdmixtureBayes, when applied to the same horse populations considered in Extended Data Fig. 4. The values between brackets summarize the proportion of graphs sampled from the posterior distribution that support a split or admixture node. Admixture from unsampled (ghosts) populations is not represented, in contrast to Extended Data Fig. 4. b) Best Admixtools2 population model assuming 8 migration edges. The drift and admixture estimates are based on our extended dataset. c) Reference panel used for modeling pre-CWC clines of genetic diversity. d) Geospatial projection of the six CWC horse genomes analyzed in this study, in 10Mb-long windows.
Extended Data Fig. 4
Extended Data Fig. 4. Most supported population graph.
This graph summarizes the evolutionary history of pre- and post-domestication horse lineages, with CWC horses not receiving any direct genetic contribution from the steppe. The model is split into 2 panels for clarity. The numbers reported within boxes reflect the admixture contributions from the nodes specified, while those adjacent to arrows indicate the amount of genetic drift leading to individual nodes. Population groups are detailed in Table S1 and colors are according to Fig. 1a.
Extended Data Fig. 5
Extended Data Fig. 5. Visual embedding of Struct-f4 affinities.
a) The two first dimensions of a Metric MultiDimensional Scaling (MDS) analysis, summarizing the genomic affinities between horses, based on Struct-f4. To improve visualization, this excludes the five outgroup specimens. Samples are color-coded following Fig. 1a, and population groups are labelled accordingly. Horses projecting intermediate to large population groups reflect ancient clines of ancestry, stretching from the East (closer to Botai) to the West (closer to Europe). CPONT individuals, from the Central Steppe, are the closest to DOM2 horses. b) Same as a) for the downsampled dataset. c) First and third dimension of the same MDS analysis, which reveals CWC horses as the most distant European horses to DOM2 horses. d) Same for the downsampled dataset.
Extended Data Fig. 6
Extended Data Fig. 6. Struct-f4 ancestry profiles.
Ancestry proportions for the 558 individuals considered in this study, assuming from K = 8 (left) to K = 10 (right) components. A total of 272 horses previously identified as DOM2 were merged into a single population (DOM2), including all modern breeds, to reduce computational costs. CWC horses show the typical ancestry profile of pre-domestication Europe.
Extended Data Fig. 7
Extended Data Fig. 7. GONE demographic reconstruction.
Effective population size (Ne) estimated from the patterns of linkage disequilibrium (LD) present in a nearly contemporaneous population of 14 horses affiliated to the Sintashta culture, up to 200 generations before their existence. b) Example of local ancestry for a TURG horse genome (LR18x15_Rus_m2763), modeled with Admixfrog as a mixture of Botai and early DOM2 horses. c) Raw generation time estimates for ancient horses from the steppe, the Carpathian and Transylvanian Basins, without correcting for population structure and uneven sequencing depths (Supplementary Information). TURG* represents the group of TURG horses, after masking their genomes for tracts introgressed from Botai horses. d) Same for Botai horses, which involved more generations than past and contemporaneous horses from the region, with the exception of BORL and Przewalski’s horses (PRZW), previously inferred to descend from Botai and saved from extinction through captive management. The dates reported correspond to rounded means of the different samples present in each group.
Extended Data Fig. 8
Extended Data Fig. 8. Mutation clock estimates.
a) Relationship of the ingroup Eurasian horses to the outgroups considered in this study, including non-caballine equids (E. ovodovi and the donkey) and ancient horses from North America (LP_NAMR). Leveraging this topology, we counted the number of mutations (represented as stars) that occurred in the branch leading to every single Eurasian horse. Following pseudohaploidization, positions that are truly heterozygous in Eurasian horses become ancestral or derived, and both outcomes are expected at equal probabilities. This approach is, thus, insensitive to the underlying heterozygosity of the sample, and, hence, to their demographic history. b) Estimates of the number of generations evolved from the outgroups, based on the full data set. c) Estimates based on the downsampled dataset.
Extended Data Fig. 9
Extended Data Fig. 9. Recombination clock estimates.
a) Schematic representation that illustrates the expectation that the variance along the genome is greater in an older specimen (left) as the result of more generations of evolution and, hence, more recombination events than in younger specimens with regards to the time to the most common recent ancestor (MRCA) of the whole sample set. It is thus expected that the distribution of mutations (stars) is less even in the younger specimen (right), which underwent fewer recombination events, and thus carry longer haplotype blocks, in which mutations are equally likely to have occurred or not. b) Schematic visualization of the ti (time to the MRCA) and T (total length of the genealogy) parameters constituting the recombination clock model, for an illustrative sample of four genomes. c) Number of generations evolved from the MRCA, as estimated by applying the recombination clock model to the full data set.
Extended Data Fig. 10
Extended Data Fig. 10. Coalescent simulations to validate both methods.
a) Illustration of the 10 simulated scenarios (A-J), together with their underlying parameters. b) Each boxplot summarizes the estimates obtained from n = 10 diploid samples, when using the method relying on the recombination clock (in generations of evolution from the MRCA). Boxplots are comprised of their corresponding centres (median), box boundaries (interquantile ranges), and whiskers (1.5 times the interquantile ranges). The estimated age of the samples perfectly correlates with the simulated age of sampling (Pearson correlation; r = 0.999; two-tailed p-value = 0). c) Same as b) for the mutation clock (Pearson correlation; r = 0.999; two-tailed p-value = 0).

References

    1. Kelekna, P. The Horse in Human History (Cambridge Univ. Press, 2009).
    1. Librado, P. et al. The origins and spread of domestic horses from the Western Eurasian steppes. Nature598, 634–640 (2021). - PMC - PubMed
    1. Anthony, D. W. The Horse, the Wheel, and Language: How Bronze-Age Riders from the Eurasian Steppes Shaped the Modern World (Princeton Univ. Press, 2007).
    1. Maier, R. et al. On the limits of fitting complex models of population history to f-statistics. eLife12, e85492 (2023). - PMC - PubMed
    1. Trautmann, M. et al. First bioanthropological evidence for Yamnaya horsemanship. Sci. Adv.10.1126/sciadv.ade2451 (2023). 10.1126/sciadv.ade2451 - DOI - PMC - PubMed

Publication types