. 2024 Aug 13;57(8):1780-1795.e6.
doi: 10.1016/j.immuni.2024.05.008. Epub 2024 Jun 5.

Collaboration between distinct SWI/SNF chromatin remodeling complexes directs enhancer selection and activation of macrophage inflammatory genes

Affiliations

Collaboration between distinct SWI/SNF chromatin remodeling complexes directs enhancer selection and activation of macrophage inflammatory genes

Jingwen Liao et al. Immunity. .

Abstract

Macrophages elicit immune responses to pathogens through induction of inflammatory genes. Here, we examined the role of three variants of the SWI/SNF nucleosome remodeling complex-cBAF, ncBAF, and PBAF-in the macrophage response to bacterial endotoxin (lipid A). All three SWI/SNF variants were prebound in macrophages and retargeted to genomic sites undergoing changes in chromatin accessibility following stimulation. Cooperative binding of all three variants associated with de novo chromatin opening and latent enhancer activation. Isolated binding of ncBAF and PBAF, in contrast, associated with activation and repression of active enhancers, respectively. Chemical and genetic perturbations of variant-specific subunits revealed pathway-specific regulation in the activation of lipid A response genes, corresponding to requirement for cBAF and ncBAF in inflammatory and interferon-stimulated gene (ISG) activation, respectively, consistent with differential engagement of SWI/SNF variants by signal-responsive transcription factors. Thus, functional diversity among SWI/SNF variants enables increased regulatory control of innate immune transcriptional programs, with potential for specific therapeutic targeting.

Keywords: ARID1A; BAF complex; BRD9; SWI/SNF complex; TLR; chromatin remodeling; enhancer; inflammation; macrophage; toll like receptor; transcriptional regulation.


Conflict of interest statement

Declaration of interests The authors declare no competing interests.

Figures
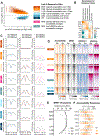
Figure 1.
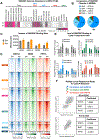
Figure 1.. SWI/SNF localization correlates with accessibility and H3K27ac changes upon Lipid A stimulation.
A. Scatterplot of 0 hour ATAC tag count (log2) against Lipid A-induced ATAC fold change (log2), for 15,160 gained sites (GA1-3) and 4,661 lost sites (LA1-3). See also Figure S1A for H3K27ac gained and lost sites (GH and LH). B. Enhancer enrichment for Lipid A-responsive sites showing the natural log of observed/expected ratio for each enhancer class. Enhancer classes are defined using public ChIP-seq data by Ostuni et al. according to their guidelines. C. ChIP signals of H3K4me1, H3K4me3, and H3K27ac at LipidA-responsive sites before and after stimulation. D. Heatmap of ATAC signals and BRG1, H3K4me1, and H3K27ac ChIP signals at LipidA-responsive sites before and after stimulation. E. Percentage of Lipid A-responsive sites bound by Brg1 after 0, 1, and 4 hours Lipid A stimulation. F. ATAC tag count at LipidA-responsive sites after 0, 1, and 4 hours Lipid A treatment. See also Figure S1.
Figure 2.
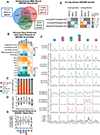
Figure 2.. All three SWI/SNF variants are present in BMDMs and responsive to Lipid A stimulation.
A. Protein abundance of SWI/SNF subunits identified in BRG1 IP-MS after 0 and 4 hours Lipid A stimulation, shown as percentage of BRG1 level. Core and variant-specific subunits are indicated on top. Paralogs not found in the IP are crossed out. B. Relative prevalence of each SWI/SNF variant before and after stimulation, calculated based on protein abundance of variant-specific subunits. C. Average number of ChIP peaks for BRG1, ARID1A, BRD9, and PHF10 after 0 and 4 hours Lipid A stimulation (n=2). BRG1 ChIP from GEO accession GSE99895 is included as a second replicate. Error bars show standard deviation. D. Heatmap of ARID1A, BRD9, and PHF10 ChIP signals at LipidA-responsive sites before and after stimulation. E. Average read density for BRG1, ARID1A, BRD9, and PHF10 ChIP at LipidA-responsive sites before and after stimulation. F. Scatterplot of predicted log2 fold change for ATAC (top) or H3K27ac (bottom) from multiple linear regression model against observed values at Lipid A-responsive sites. Coefficients for each SWI/SNF factor are reported. Arrows represent the level of correlation between each SWI/SNF factor and ATAC or H3K27ac. See also Figure S2.
Figure 3.
Figure 3.. SWI/SNF variants localize to different genomic locations after Lipid A stimulation.
A. Overlap between accessible sites that gained ARID1A, BRD9, or PHF10 (increase fold change ≥ 2). B. Enrichment for enhancer class and ATAC response among sites that gained one (A, B, P), two (AB, AP), or three (ABP) SWI/SNF variants, showing the natural log of observed/expected ratio. C. Percentage of SWI/SNF gained sites with accessibility changes in response to Lipid A. D. ATAC log2 fold change at SWI/SNF gained sites following 4 hours Lipid A stimulation. E. Percentage of ARID1A, BRD9, and PHF10 gained sites that cogained other SWI/SNF factors, among all accessible sites (left) or GA sites only (right). F. ATAC, ChIP (for BRG1, ARID1A, BRD9, PHF10, H3K4me1, H3K4me3, and H3K27ac), and Gro-Seq signals at SWI/SNF gained sites, before and after stimulation. G. RNA log2 fold change after 4 hours Lipid A stimulation, for transcripts annotated to SWI/SNF gained sites.
Figure 4.
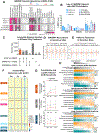
Figure 4.. SWI/SNF variants associate with different SRTFs and regulate different Lipid A-responsive genes.
A. Motifs enriched at sites bound by BRG1 at baseline (0 hour) or at sites that gained BRG1 ChIP signal (increase fold change ≥ 2) after 1 and 4 hours Lipid A stimulation. Motifs are ranked by enrichment log2(p-value). See also Figure S3. B. ChIP log2 fold change for BRG1 and various transcription factors after 1, 2, or 4 hours stimulation. C. Normalized ChIP signals for various transcription factors after stimulation at SWI/SNF gained sites. The highest read density for each TF is set as 100%. D. Gene group enrichment for transcripts annotated to SWI/SNF gained sites, showing the natural log of observed/expected ratio. E. Loci of Il12b, Ifit2/3, and Arl4c, showing ATAC reads and ChIP reads for H3K27ac, ARID1A, BRD9, PHF10, PU.1, FOS, RELA, and STAT2 before and after stimulation. Key genomic regions are highlighted.
Figure 5.
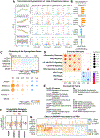
Figure 5.. SWI/SNF perturbations lead to reduction in accessibility and H3K27ac at Lipid A-responsive sites.
A. Protein abundance of SWI/SNF subunits identified in BRG1 IP-MS in unstimulated BMDMs with Arid1a deletion (top) or BRDK98 treatment (bottom), shown as percentage of BRG1 level. Core and variant-specific subunits are indicated on top. Paralogs not found in the IP are crossed out. B. Protein abundance for ARID1A, ARID1B, and core SWI/SNF subunits in BMDMs with Arid1a deletion or BRDK98 treatment. For core subunits, median protein abundance is shown, and the error bars represent interquartile range. C. Number of accessible regions sensitive to ACBI1, BRM014, or BRDK98 (reduction fold change ≥ 2), alone or a combination of two or more treatments. Sites sensitive to all three (most sensitive) are highlighted. D. LipidA-induced log2 fold change in ATAC signals and ChIP signals for BRG1, ARID1A, BRD9, and PHF10, comparing the most sensitive sites (defined in Figure 5C) to the least sensitive sites (unaffected by all three drugs). E. H3K27ac log2 fold change upon various SWI/SNF perturbations. Cells were pretreated by ACBI1, BRM014, and BRDK98 for 2 hours before 4 hours Lipid A stimulation. Arid1a and Pbrm1 deletion was induced with tamoxifen for 2 days, and dBrd9 pretreatment was conducted overnight. F. Heatmap of ATAC log2 fold change with ACBI1 treatment after 0, 1, or 4 hours Lipid A stimulation. Unstimulated and 1 hour-stimulated cells were treated with ACBI1 for a total of 2 hours while 4 hour-stimulated cells were treated for 6 hours. G. Median ATAC coverage for GA3 (top), MA (middle), and LA (bottom) sites with or without ACBI1 treatment. Error bars represent interquartile range. H. Enrichment for enhancer class and ATAC response among sites with Lipid A-induced sensitivity (sensitive at 4 hours but not at 0 hour) to ACBI1 (top), BRM014 (middle), and BRDK98 (bottom), each divided into deciles ranked by ATAC log2 fold change control vs. treatment after 4 hours Lipid A. Average ATAC log2 fold change is reported for each decile. Heatmap shows the natural log of observed/expected ratio. All cells were treated with SWI/SNF inhibitors for 6 hour except for unstimulated cells treated with BRM014 for 2 hours. See also Figure S4 and S5.
Figure 6.
Figure 6.. SWI/SNF perturbations lead to dysregulation of Lipid A responsive-genes.
A. Volcano plot showing transcriptional changes upon SWI/SNF perturbations for Lipid A activated, repressed, and nonresponsive genes. The effect at 1 hour is reported for 1 hour activated genes and the effect at 4 hours is reported for 4 hour activated, repressed, and nonresponsive genes. Zscores for genes in each group are plotted on the left, with the orange line showing the median level of the group. 1 hour-stimulated cells were treated with ACBI1 for 2 hours and with BRDK98 and BRDM014 for 1 hour and 15 minutes. 4 hour-stimulated cells were treated with all inhibitors for 6 hours. Arid1a deletion was induced with tamoxifen for 2 days. B. Percentage of genes dysregulated by SWI/SNF perturbations within each gene group, at timepoint specified in Figure 6A. C. RNA log2 fold change upon SWI/SNF perturbations after 4 hours Lipid A stimulation, for all differentially expressed genes (DEGs) subdivided into four downregulated clusters and two upregulated clusters. Median log2 fold change upon each perturbation for each cluster is represented below. D. Enrichment of hallmark gene among each DEG cluster. E. List of GO terms enriched among each DEG cluster. F. ATAC log2 fold change upon SWI/SNF perturbations at GA3 enhancers annotated to SWI/SNF dysregulated genes after 1 and 4 hours Lipid A stimulation. ATAC assessing the effect of Arid1a−/− at 1 hour is not done (N.D.). Treatment conditions were the same as Figure 6A. G. Log2 fold change in PRG expression upon SWI/SNF perturbations after 20 minutes (top) or 1 hour Lipid A stimulation. For both timepoints, cells were pretreated with BRM014 and BRDK98 for 15 minutes and with ACBI1 for 1 hour. Arid1a deletion was induced with tamoxifen for 2 days, and dBrd9 pretreatment was conducted overnight. See also Figure S6 and S7.

References

    1. Gosselin D, and Glass CK (2014). Epigenomics of macrophages. Immunol Rev 262, 96–112. - PMC - PubMed
    1. Amit I, Winter DR, and Jung S (2016). The role of the local environment and epigenetics in shaping macrophage identity and their effect on tissue homeostasis. Nat Immunol 17, 18–25. - PubMed
    1. Zhu F, Farnung L, Kaasinen E, Sahu B, Yin Y, Wei B, Dodonova SO, Nitta KR, Morgunova E, Taipale M, Cramer P, and Taipale J (2018). The interaction landscape between transcription factors and the nucleosome. Nature 562, 76–81. - PMC - PubMed
    1. Heinz S, Benner C, Spann N, Bertolino E, Lin YC, Laslo P, Cheng JX, Murre C, Singh H, and Glass CK (2010). Simple combinations of lineage-determining transcription factors prime cis-regulatory elements required for macrophage and B cell identities. Mol Cell 38, 576–589. - PMC - PubMed
    1. Glass CK, and Natoli G (2016). Molecular control of activation and priming in macrophages. Nature Immunol 17, 26–33. - PMC - PubMed

Publication types

Substances