. 2024 Aug 19;59(16):2143-2157.e9.
doi: 10.1016/j.devcel.2024.05.008. Epub 2024 Jun 5.

Neuronal activity-driven O-GlcNAcylation promotes mitochondrial plasticity

Affiliations

Neuronal activity-driven O-GlcNAcylation promotes mitochondrial plasticity

Seungyoon B Yu et al. Dev Cell. .

Abstract

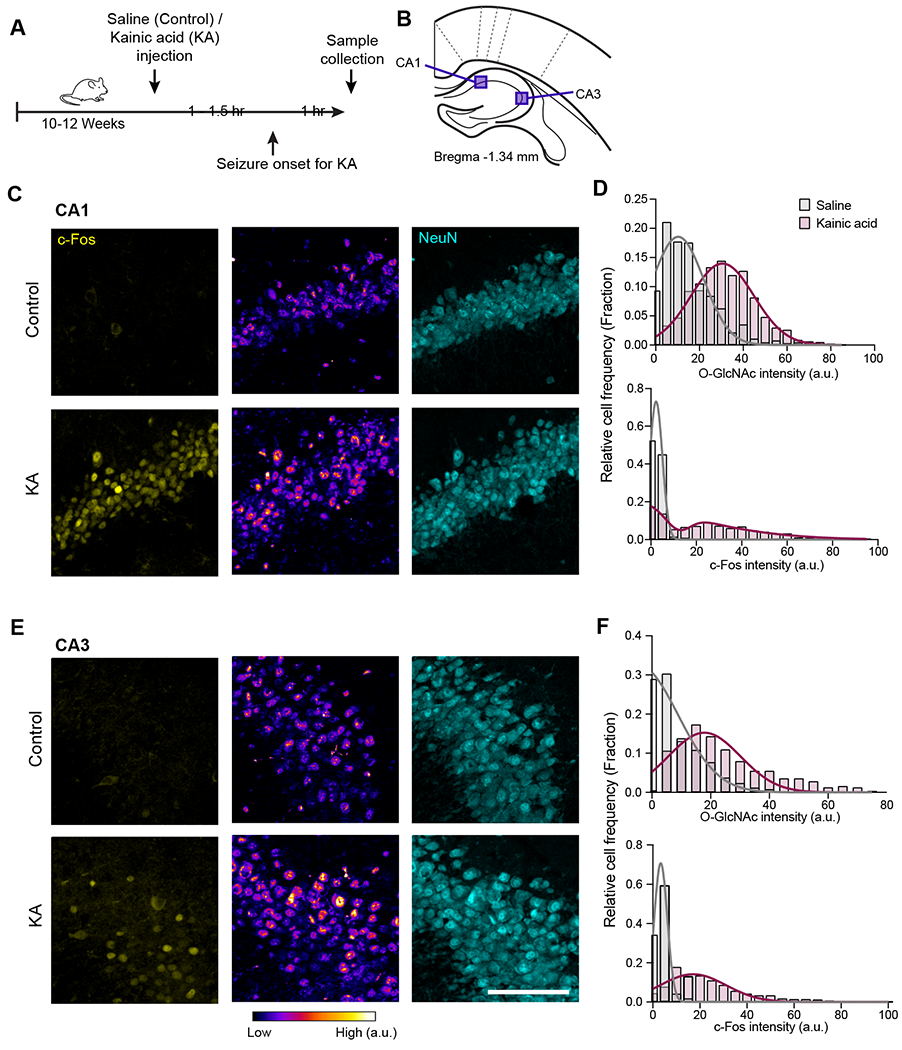
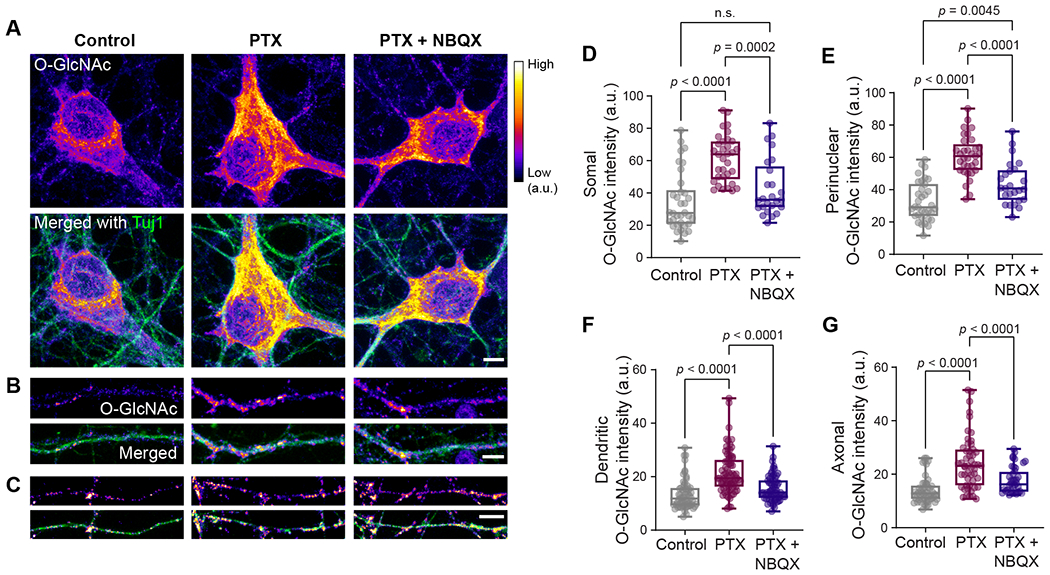
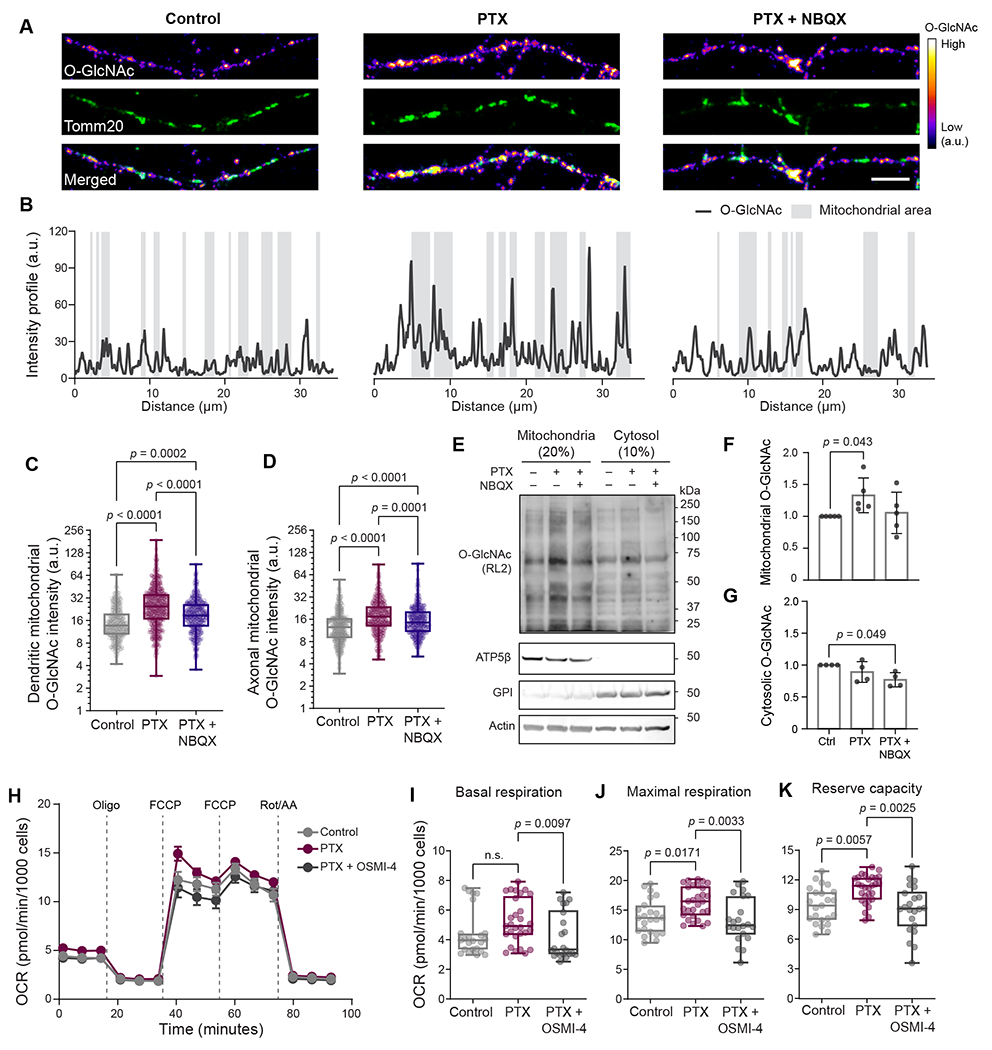
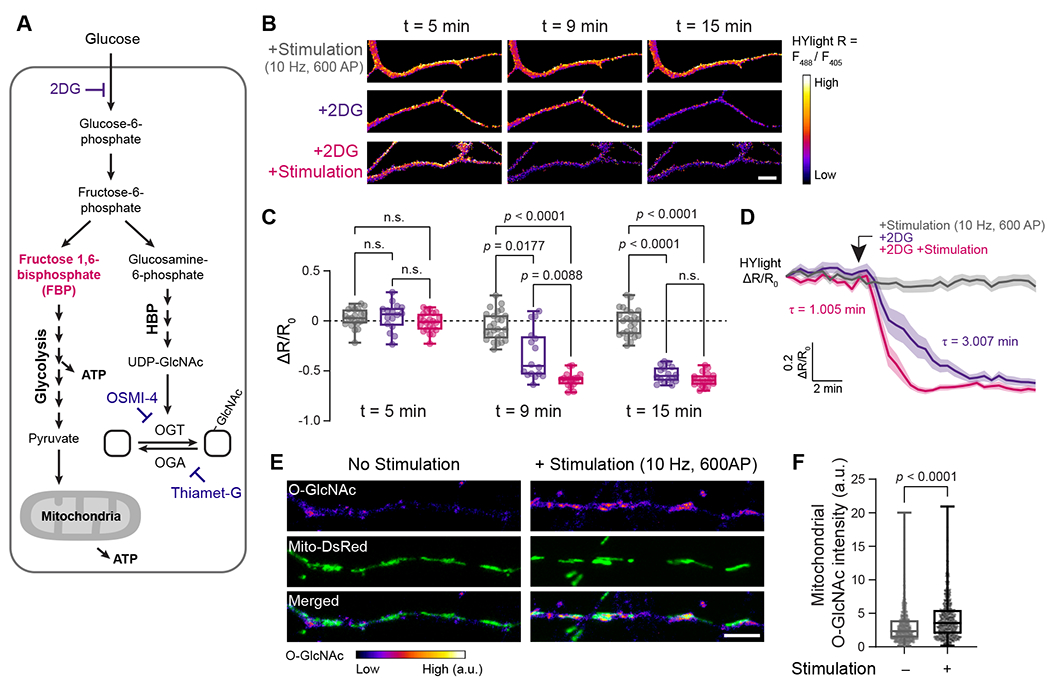
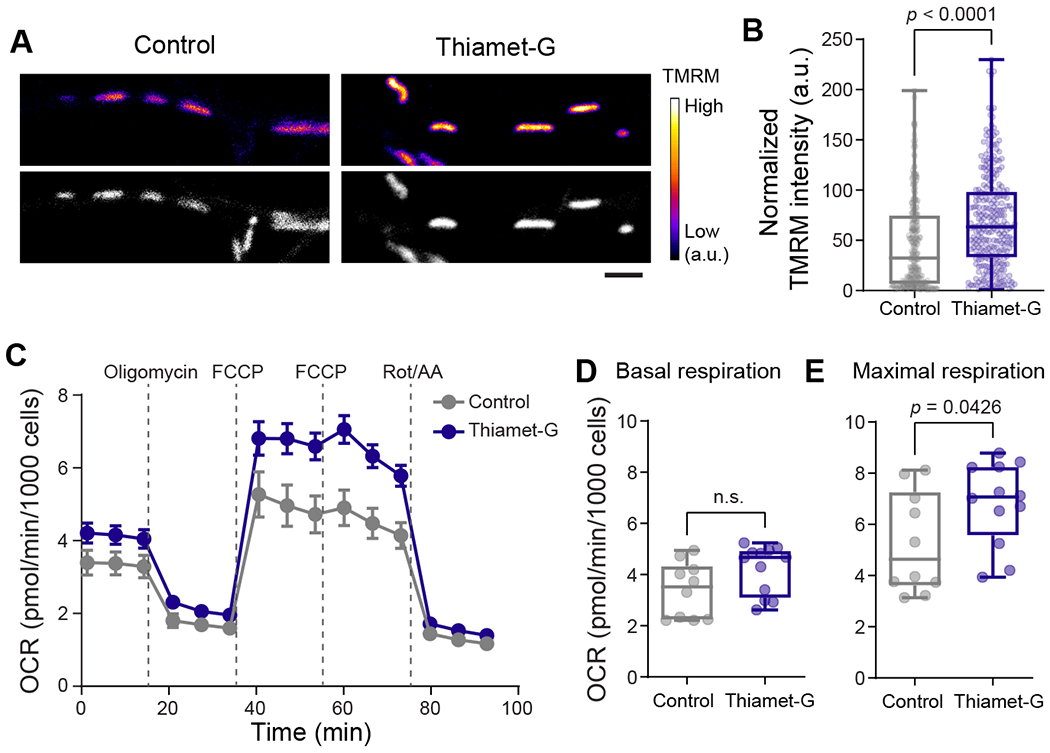
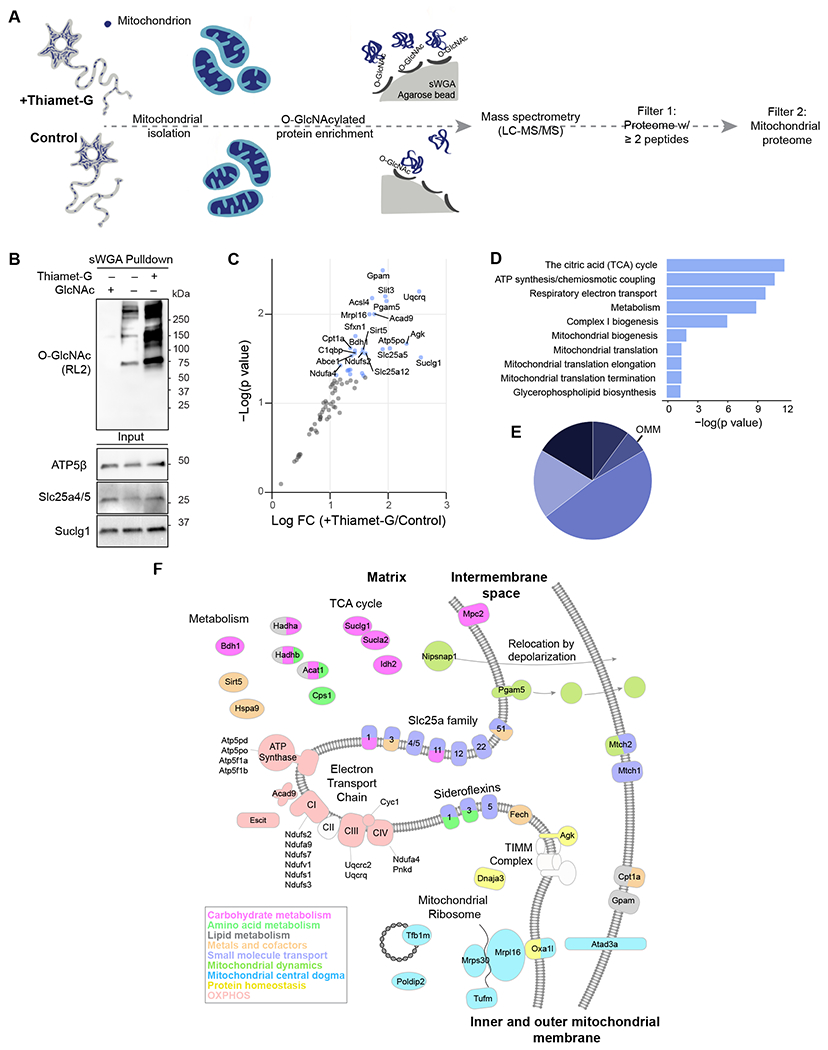
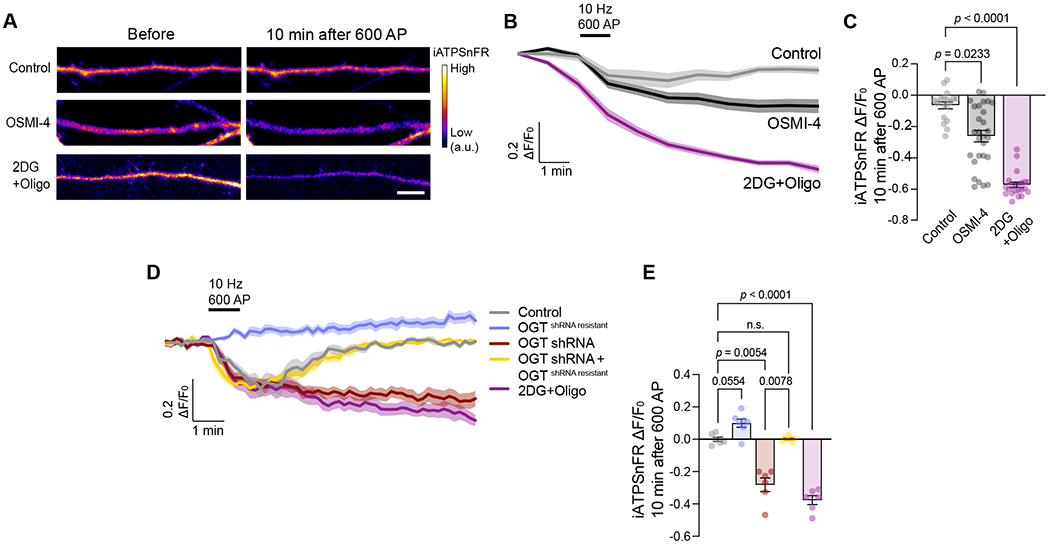
Neuronal activity is an energy-intensive process that is largely sustained by instantaneous fuel utilization and ATP synthesis. However, how neurons couple ATP synthesis rate to fuel availability is largely unknown. Here, we demonstrate that the metabolic sensor enzyme O-linked N-acetyl glucosamine (O-GlcNAc) transferase regulates neuronal activity-driven mitochondrial bioenergetics in hippocampal and cortical neurons. We show that neuronal activity upregulates O-GlcNAcylation in mitochondria. Mitochondrial O-GlcNAcylation is promoted by activity-driven glucose consumption, which allows neurons to compensate for high energy expenditure based on fuel availability. To determine the proteins that are responsible for these adjustments, we mapped the mitochondrial O-GlcNAcome of neurons. Finally, we determine that neurons fail to meet activity-driven metabolic demand when O-GlcNAcylation dynamics are prevented. Our findings suggest that O-GlcNAcylation provides a fuel-dependent feedforward control mechanism in neurons to optimize mitochondrial performance based on neuronal activity. This mechanism thereby couples neuronal metabolism to mitochondrial bioenergetics and plays a key role in sustaining energy homeostasis.

Keywords: ATP synthesis; O-GlcNAc transferase; O-GlcNAcylation; glycosylation; mitochondria; neuronal metabolism; synaptic activity.


Conflict of interest statement

Declaration of interests The authors declare no competing interests.

Figures

Figure 1.
Figure 1.. Neuronal activity enhances O-GlcNAcylation in neurons.
(A) Schematic illustration representing the experimental timeline for intraperitoneal injections of saline or kainic acid, seizure induction, and sample collection. (B) O-GlcNAc and c-Fos fluorescence intensities were analyzed in the indicated hippocampal areas (CA1 and CA3) from brain sections ranging from Bregma −1.22 mm to −1.45 mm. (C-F) Quantification and representative images of CA1 (C) and CA3 (E) hippocampal regions after saline (Control) or kainic acid (KA) injections and immunohistochemical staining with antibodies against c-Fos (yellow), O-GlcNAc (RL2, fire LUT), and NeuN (cyan). The distribution of c-Fos and O-GlcNAc intensities from NeuN-positive neurons were plotted for CA1 (D) and CA3 (F) hippocampal regions from saline (grey) and KA injected (magenta) brains. For each condition n = 655-811 neurons in CA1 and 508-566 neurons in CA3, 3 mice (Scale bars = 100 μm). See also Figure S1.
Figure 2.
Figure 2.. Neuronal excitation promotes O-GlcNAcylation in dendrites and axons
(A-C) Representative images of cortical neuron soma (A), dendrite (B), and axon (C) after 6 hours of DMSO (vehicle control), PTX or PTX+NBQX treatments and immunocytochemical staining with antibodies against βIII Tubulin (Tuj1) (green) and O-GlcNAc (RL2, fire LUT). (D-G) Quantification of O-GlcNAc intensities from somal (D), perinuclear (E), dendritic (F), and axonal (G) regions of cortical neurons after indicated treatments. n = 25-34 neuronal soma, 58-73 dendrites, 36-50 axons from three independent experiments. Data are shown as a Min-Max Box-whisker plot with associated p-values (n.s.= p>0.05) (one-way ANOVA with post hoc Tukey’s multiple comparison test. Scale bars = 5 μm). See also Figure S2.
Figure 3.
Figure 3.. Neuronal activity-driven O-GlcNAcylation regulates mitochondria.
(A) Representative images of neuronal processes after 6 hours of DMSO (vehicle control), PTX or PTX+NBQX treatments and immunocytochemical staining with antibodies against Anti- Tomm20 (green) to label mitochondria and anti-O-GlcNAc (RL2, fire LUT). Scale bar = 5 μm. (B) Fluorescence intensity of O-GlcNAc measured along the length of neuronal processes shown in (A). The gray shaded areas represent regions along the neuronal processes that are stained with Tomm20, indicative of mitochondrial areas. (C-D) The total intensity of O-GlcNAc immunofluorescence at the dendritic and axonal mitochondrial compartments after indicated treatments. n = 1000-1281 mitochondria analyzed for each group from three independent experiments. Data are shown as a Min-Max Box-whisker plot with associated p-values (one-way ANOVA with post hoc Tukey’s multiple comparison test). (E-G) Mitochondrial and cytoplasmic protein O-GlcNAcylation level changes. Mitochondrial and cytosolic fractions, obtained from cortical neurons treated with DMSO (vehicle control), PTX, or PTX+NBQX treatments for 6 hours, were separated by SDS gel electrophoresis and probed with anti-O-GlcNAc antibodies (RL2), anti- ATP5β (mitochondrial marker), anti-GPI and anti-actin (cytosolic markers) antibodies. The total intensity of the O-GlcNAc immunoreactive bands was normalized to the intensity of ATP5β (F) or actin (G) bands for each lane. O-GlcNAc levels in control cells were set as 1, and fold changes in response to indicated treatments were calculated. n = 4-5 independent experiments. Data are shown as mean values ± SEM with associated p-values (one-way ANOVA with post hoc Kruskal-Wallis multiple comparison test). (H) Mitochondrial oxygen consumption rate (OCR) measured from primary cortical neuron cultures using the “mito stress test” protocol after treatments with DMSO (vehicle control), PTX, or PTX+OSMI-4 for 6 hours. (I-K) Basal (OCRbasal) and maximal respiration (OCRFCCP) and reserve capacity (OCRFCCP - OCRbasal) for indicated treatments. Mean ± SEM for each time point, n= 24-32 wells per condition from three independent experiments. Data are shown as a Min-Max Box-whisker plot with associated p-values (n.s.= p>0.05) (one-way ANOVA with post hoc Tukey’s multiple comparison test). See also Figure S3.
Figure 4.
Figure 4.. Glycolysis and O-GlcNAcylation rise upon neuronal stimulation.
(A) Schematic representation of cellular glucose utilization pathways: glycolysis and hexosamine biosynthesis pathway (HBP). Genetically encoded sensor HYlight measures fructose1,6-bisphosphate (FBP) (magenta), the product of the committed step of glycolysis. Rate limiting steps and the inhibitors used in this study are also indicated: glycolysis inhibitor 2-deoxyglucose (2DG), O-GlcNAc transferase (OGT) inhibitor OSMI-4, O-GlcNAcase (OGA) inhibitor Thiamet-G. (B) Representative ratiometric HYlight (fire LUT) images from neuronal processes, before (t= 5 min), and after (t= 9 and 15 min) field stimulation (10Hz, 600AP) either with or without 2DG treatments. (C-D) The normalized HYlight emission ratio (R) induced by 488nm and 405nm excitations (ΔR/R0) at indicated time points, obtained from cortical neuron traces demonstrated as in (D) (gray: control with field stimulation; purple: only 2DG treatment; magenta: 2DG treatment with field stimulation). The arrowhead indicates the initiation time point of 2DG treatment and/or field stimulation (10Hz, 600AP). Data are shown as mean values ± SEM (D) and a Min-Max Box-whisker plot (C) with associated p-values (one-way ANOVA with post hoc Tukey’s multiple comparison test), n = 7-11 neurons from three independent experiments. Scale bar =10 μm. (E-F) Cortical neurons expressing MitoDsRed (green) to label mitochondria (as well as GCaMP6s to measure neuronal activity, see Figure S4) fixed and immunostained with anti-O-GlcNAc (RL2, fire LUT) antibody immediately after the field stimulation (10Hz, 600AP) or under baseline conditions. (F) The total intensity of O-GlcNAc immunofluorescence from dendritic and axonal mitochondrial compartments quantified from non-stimulated or stimulated neurons. Data are shown as a Min-Max Box-whisker plot with associated p-values (n.s.= p>0.05) (Mann-Whitney U test), n = 646-801 mitochondria from 17-21 neurons from three independent experiments. Scale bar = 5 μm. See also Figure S4.
Figure 5.
Figure 5.. O-GlcNAcylation enhances mitochondrial activity.
(A) Representative images demonstrating co-labeling of total mitochondria with MitoTracker (MT) Green (gray) and mitochondrial membrane potential with TMRM (fire LUT). (B) Mitochondrial membrane potential changes are represented as “Normalized TMRM intensity” by calculating the ratio of TMRM and MT Green intensities for each mitochondrion from neuronal processes. n= 268-281 mitochondria, four independent experiments. Data are shown as a Min-Max Box-whisker plot with associated p-values (Mann-Whitney U test). Scale bar = 2 μm. (C) Mitochondrial oxygen consumption rate (OCR) was measured from cortical neuron cultures using the “mito stress test” protocol after overnight treatments with DMSO (vehicle control) or Thiamet-G. (D-E) Basal (OCRbasal) and maximal respiration (OCRFCCP) for indicated treatments. n= 10-12 wells per condition from three independent experiments. Data are shown as a Min-Max Box-whisker plot with associated p-values (n.s.= p>0.05) (Mann-Whitney U test). See also Figure S5.
Figure 6.
Figure 6.. Mitochondrial O-GlcNAcome reveals mitochondrial plasticity mechanisms.
(A) Schematic outline of mass spectrometry sample preparation and analysis strategy. Cortical neurons at 12-15 DIV were treated with DMSO (vehicle control) or Thiamet-G overnight to capture dynamic O-GlcNAc modification. O-GlcNAc-modified proteins were enriched from crude mitochondrial fractions using succinylated wheat germ agglutinin (sWGA) beads. Label-free quantitative mass spectrometry (LC-MS/MS) data was further analyzed to select proteins with ≥ 2 peptides (Filter 1) and to identify mitochondrial proteins based on MitoCarta 3.0 and Mitominer databases (Filter 2). (B) Changes in the total sWGA-bound protein O-GlcNAcylation levels were evaluated by SDS gel electrophoresis and probed with anti-O-GlcNAc antibody (RL2). Crude mitochondrial fractions isolated from cortical neurons at 12-15 DIV were treated with DMSO (vehicle control) or Thiamet-G overnight to augment O-GlcNAc modification. O-GlcNAc modified proteins were enriched from crude mitochondrial fractions using sWGA beads, with free GlcNAc used as a control to validate the specificity of sWGA binding. Mitochondrial fractions (Input) were analyzed by SDS gel electrophoresis and probed with anti-ATP5β, anti-Slc25a4/5 and anti-Suclg1 antibodies. (C) Scatter plot analysis demonstrating the impact of Thiamet-G treatment on O-GlcNAcylated mitochondrial proteins. Annotated proteins (blue dots) represent p<0.05 (FC, fold change). (D) Pathway enrichment analysis, and (E) sub-mitochondrial localization of identified mitochondrial proteins. (F) Illustration of mitochondrial O-GlcNAcome, colored by MitoPathway assignments from MitoCarta3.0. n=3 biological replicates. See also Figure S5, Table S1 and S2.
Figure 7.
Figure 7.. O-GlcNAc transferase supports on-demand ATP synthesis.
(A) Representative images of neuronal processes expressing ATP sensor, iATPSnFR, before and 10 minutes following indicated pharmacological treatments and field stimulation (10 Hz, 600AP) (OGT inhibitor OSMI-4, and 2DG and Oligomycin (Oligo)). Scale bar = 5 μm. (B) Average fluorescence traces of iATPSnFR, with indicated pharmacological treatments and field stimulation (10 Hz, 600AP) (gray: control; black: OGT inhibitor OSMI-4; magenta: 2DG and Oligo). Data are shown as mean values ± SEM. (C) Quantification of ATP depletion (iATPSnFR ΔF/F0) from neuronal processes at 10 minutes post-stimulation (t = 12 min) for each condition. Data are shown as mean values ± SEM with associated p-values (one-way ANOVA with post hoc Kruskal-Wallis multiple comparison test), n = 14-24 neuronal processes, 4-8 cells, and three independent experiments. (D) Average iATPSnFR fluorescence traces from neuronal axons with indicated pharmacological treatments, genetic manipulations, and field stimulation (10 Hz, 600AP) (gray: control; magenta: 2DG and Oligomycin; blue: ncOGT overexpression (OGTshRNA resistant); red: OGT knockdown with shRNA (OGTshRNA); yellow: OGT knockdown with shRNA (OGTshRNA) and rescue with ncOGT (OGTshRNA resistant). (E) Quantification of ATP depletion (iATPSnFR ΔF/F0) from neuronal processes at 10 minutes post-stimulation (t = 12 min) for each condition. Data are shown as mean values ± SEM with associated p-values (one-way ANOVA with post hoc Kruskal-Wallis multiple comparison test), n = 6-7 neuronal axons, 6-7 neurons from four independent experiments.

Update of

References

    1. Pekkurnaz G, and Wang X (2022). Mitochondrial heterogeneity and homeostasis through the lens of a neuron. Nat Metab 4, 802–812. 10.1038/s42255-022-00594-w. - DOI - PMC - PubMed
    1. Howarth C, Gleeson P, and Attwell D (2012). Updated energy budgets for neural computation in the neocortex and cerebellum. J Cereb Blood Flow Metab 32, 1222–1232. 10.1038/jcbfm.2012.35. - DOI - PMC - PubMed
    1. Rangaraju V, Calloway N, and Ryan TA (2014). Activity-driven local ATP synthesis is required for synaptic function. Cell 156, 825–835. 10.1016/j.cell.2013.12.042. - DOI - PMC - PubMed
    1. Diaz-Garcia CM, Mongeon R, Lahmann C, Koveal D, Zucker H, and Yellen G (2017). Neuronal Stimulation Triggers Neuronal Glycolysis and Not Lactate Uptake. Cell Metab 26, 361–374 e364. 10.1016/j.cmet.2017.06.021. - DOI - PMC - PubMed
    1. Diaz-Garcia CM, and Yellen G (2019). Neurons rely on glucose rather than astrocytic lactate during stimulation. J Neurosci Res 97, 883–889. 10.1002/jnr.24374. - DOI - PMC - PubMed

Publication types

LinkOut - more resources