. 2024 Jun 18;5(6):101592.
doi: 10.1016/j.xcrm.2024.101592. Epub 2024 Jun 5.

A CD36-dependent non-canonical lipid metabolism program promotes immune escape and resistance to hypomethylating agent therapy in AML

Affiliations

A CD36-dependent non-canonical lipid metabolism program promotes immune escape and resistance to hypomethylating agent therapy in AML

He-Zhou Guo et al. Cell Rep Med. .

Abstract

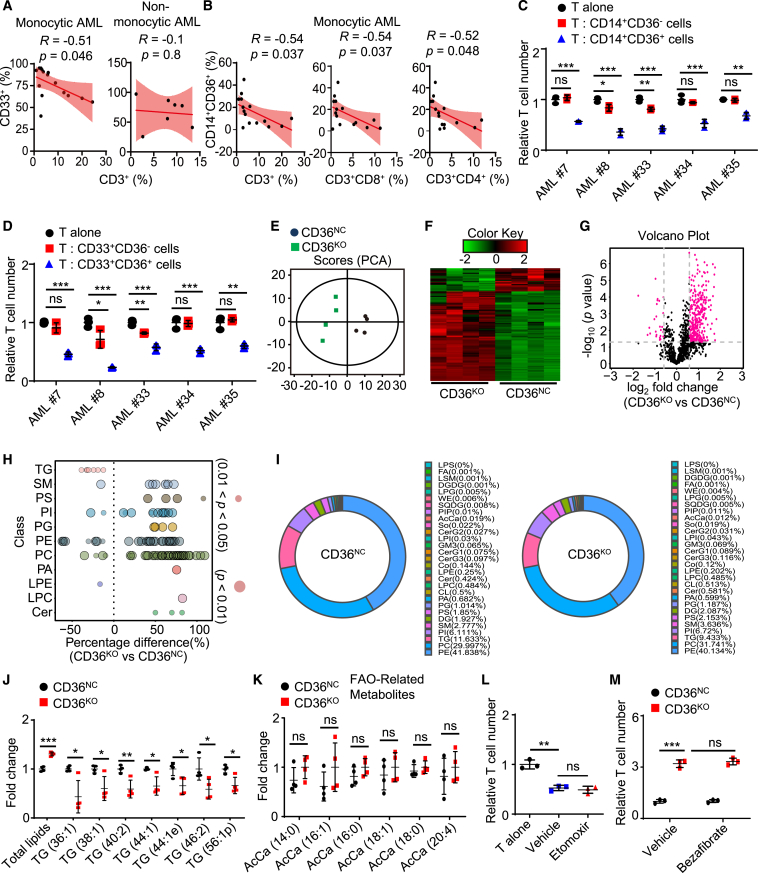
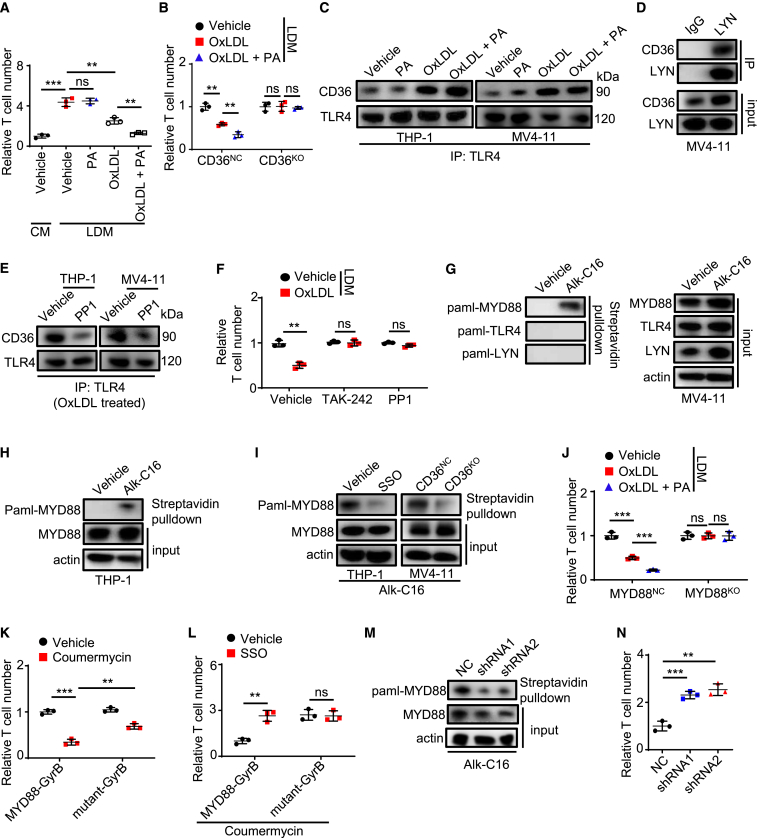
Environmental lipids are essential for fueling tumor energetics, but whether these exogenous lipids transported into cancer cells facilitate immune escape remains unclear. Here, we find that CD36, a transporter for exogenous lipids, promotes acute myeloid leukemia (AML) immune evasion. We show that, separately from its established role in lipid oxidation, CD36 on AML cells senses oxidized low-density lipoprotein (OxLDL) to prime the TLR4-LYN-MYD88-nuclear factor κB (NF-κB) pathway, and exogenous palmitate transfer via CD36 further potentiates this innate immune pathway by supporting ZDHHC6-mediated MYD88 palmitoylation. Subsequently, NF-κB drives the expression of immunosuppressive genes that inhibit anti-tumor T cell responses. Notably, high-fat-diet or hypomethylating agent decitabine treatment boosts the immunosuppressive potential of AML cells by hijacking CD36-dependent innate immune signaling, leading to a dampened therapeutic effect. This work is of translational interest because lipid restriction by US Food and Drug Administration (FDA)-approved lipid-lowering statin drugs improves the efficacy of decitabine therapy by weakening leukemic CD36-mediated immunosuppression.


Conflict of interest statement

Declaration of interests The authors declare no competing interests.

Figures

None
Graphical abstract
Figure 1
Figure 1
CD36 on AML cells suppresses T cell proliferation (A and B) C57BL/6 mice or NOG mice (n = 5 per group) intravenously injected with 2 × 106 Cd36NC or Cd36KO C1498 cells were treated with or without antibodies (150 μg/mouse, 3 times/week, intraperitoneal [i.p.]) for 2 weeks after injection and were monitored for survival. (C–F) 1 × 107 CD36NC or CD36KO MV4-11 cells were subcutaneously injected into PBMC-NOG mice (n = 5 per group). Tumor size (C), human T cells in PB (D and E), and PD-1+ cells in human CD3+CD8+ T cells in PB (F) were monitored 30 days after injection. (G–K) C57BL/6 mice (n = 5 per group) intravenously injected with 5 × 106 Cd36NC or Cd36KO C1498-OVA cells were sacrificed 18 days after injection. Leukemia cells (G), tetramer+ T cells (H), and the expression of activation (I) or inhibitory (J) markers in tetramer+ T cells in spleen were examined. (K) CD8+ T cells purified from GFP splenocytes of the recipients were further used for T cell killing assay. (L) C1498 cells (5 × 105 cells per mouse) were subcutaneously implanted into C57BL/6 mice. Meanwhile, spleen T cells (3 × 106 cells per mouse) from naive mice or Cd36KO C1498 cell-challenged mice were adoptively transferred into these mice, respectively (n = 5 per group). Tumor size was monitored. Arrow indicates the day of rechallenge in 3 mice that had eliminated leukemia with a higher number of C1498 cells (1 × 106 cells per mouse). (M) CD36NC and CD36KO MV4-11 cells were used for CFSE assay. The percentages of proliferating T cells were determined by CFSE dilution (n = 3). (N and O) Different kinds of MV4-11 cells (N) or C1498 cells (O) were used for T cell proliferation assay. T cells were counted after co-culture (n = 3). Data are shown as mean ± SD. ∗p < 0.05, ∗∗p < 0.01, and ∗∗∗p < 0.001. ns, not significant.
Figure 2
Figure 2
CD36 on AML cells mediates T cell suppression independently of FAO (A and B) Flow cytometry analysis of the BMMCs from 15 patients with monocytic or 7 non-monocytic AML. Scatterplot showing the correlations between different cell types. (C and D) Different kinds of AML cells sorted from 5 patients with monocytic AML were used for T cell proliferation assay. (E–K) Principal-component analysis (E), heatmap (F), volcano plot (G), bubble plot (H), pie chart (I), and representative lipids altered (J and K) showing the changes of lipidome in CD36NC and CD36KO MV4-11 cells (n = 4). (L and M) MV4-11 cells stimulated with etomoxir (50 μM) or bezafibrate (5 μM) for 3 days were further used for T cell proliferation assay (n = 3). Data are shown as mean ± SD. ∗p < 0.05, ∗∗p < 0.01, and ∗∗∗p < 0.001. ns, not significant.
Figure 3
Figure 3
OxLDL and PA synergize to suppress T cell activity via CD36-mediated innate immune signaling in AML cells (A and B) THP-1 cells (A) or MV4-11 cells (B) stimulated in CM or LDM supplied with different lipids (palmitate [PA], 20 μM; OxLDL, 25 μg/mL) for 3 days were further used for T cell proliferation assay (n = 3). (C–E) Immunoblot analysis of TLR4 (C and E) or LYN (D) precipitated proteins. (C and E) AML cells were treated with different reagents (PA, 20 μM; OxLDL, 25 μg/mL; PP1, 10 μM) for 5 h before immunoprecipitation. (F) MV4-11 cells treated with LDM supplied with different reagents (OxLDL, 25 μg/mL; TAK-242, 10 μM; PP1, 10 μM) for 3 days were further used for T cell proliferation assay (n = 3). (G–I) AML cells labeled with a chemical probe (alk-C16) for 4 h in the absence (G and H) or presence of SSO (50 μM) (I) were used for palmitoylation assay. (J) MYD88NC or MYD88KO MV4-11 cells stimulated in LDM supplied with different lipids (PA, 20 μM; OxLDL, 25 μg/mL) for 3 days were further used for T cell proliferation assay (n = 3). (K and L) MYD88-GyrB or MYD88 mutant-GyrB MV4-11 cells stimulated with different reagents (coumermycin, 1 ng/mL; SSO, 50 μM) for 3 days were further used for T cell proliferation assay (n = 3). (M and N) ZDHHC6NC or ZDHHC6KD MV4-11 cells were used for MYD88 palmitoylation assay (M) or T cell proliferation assay (n = 3) (N). Data are shown as mean ± SD. ∗∗p < 0.01 and ∗∗∗p < 0.001. ns, not significant.
Figure 4
Figure 4
CD36 upregulates NF-κB signaling and expression of PD-L1 and ARG1 to suppress T cell activity (A) The expression of p-p65 and p65 in Cd36NC and Cd36KO C1498 cells was detected by western blot. (B) MV4-11 cells stimulated in LDM supplied with different reagents (PA, 20 μM; OxLDL, 25 μg/mL; SC75741, 5 μM) for 3 days were further used for T cell proliferation assay (n = 3). (C and D) Different kinds of MV4-11 cells were used for T cell proliferation assay (n = 3). SC75741 (5 μM) was added. (E) C57BL/6 mice (n = 8 per group) intravenously injected with different kinds of C1498 cells (2 × 106/mice) were treated with antibodies (150 μg/mouse, 3 times/week, i.p.) for 2 weeks after injection and were monitored for survival. (F) Chromatin IP followed by sequencing (ChIP-seq) occupancy profiles of p65 at PD-L1 gene locus in THP-1 cells. (G and H) C57BL/6 mice (n = 5 per group) intravenously injected with 2 × 106 Cd36NC or Cd36KO C1498 cells were treated with or without antibodies (150 μg/mouse, 3 times/week, i.p.) for 2 weeks and were sacrificed 18 days after injection for analysis (G) or monitored for survival (H). (G) The expression of PD-L1 in BM C1498 cells was detected by flow cytometry. (I) The expression of ARG1 in CD36NC and CD36KO MV4-11 cells was detected by flow cytometry (n = 3). (J) CD36NC or CD36KO MV4-11 cells were used for T cell proliferation assay (n = 3). Nor-NOHA (0.5 mM) was added. (K) Different kinds of AML cells sorted from 3 patients were probed for p-p65, PD-L1, and ARG1. Data are shown as mean ± SD. ∗∗p < 0.01 and ∗∗∗p < 0.001. ns, not significant.
Figure 5
Figure 5
Statin delays AML progression by targeting CD36 (A and B) HFD C57BL/6 mice (n = 5 per group) intravenously injected with 1 × 106 Cd36NC or Cd36KO C1498 cells were treated with or without reagents (fluvastatin, 40 mg/kg, 5 times/week, intragastric [i.g.]; antibodies, 150 μg/mouse, 3 times/week, i.p.) for 2 weeks after injection and were monitored for survival. (C–F) NOG mice (C) or PBMC-NOG mice (D–F) subcutaneously injected with 1 × 107 MV4-11 cells were treated with or without fluvastatin (40 mg/kg, 5 times/week, i.g.) for 2 weeks after injection (n = 5 per group). Tumor was monitored for 13 (C) or 28 days (D–F) after injection. (E) Tumors from 3 recipients were dissected for immunohistochemistry staining with anti-human CD3 antibody. Right corner images were magnified from the red highlighted region. Black arrowheads indicate CD3+ cells. Scale bar, 100 μm. (F) Quantification of human T cells in PB. (G and H) NOG mice (n = 5 per group) intravenously implanted with 5 × 106 BMMCs from patients with AML were treated with or without fluvastatin (40 mg/kg, 5 times/week, i.g.) for 2 weeks starting 7 days after implantation. 3 days after the last treatment, percentages of human AML cells (G) and human T cells (H) in BM were tested. Data are shown as mean ± SD. ∗p < 0.05, ∗∗p < 0.01, and ∗∗∗p < 0.001. ns, not significant.
Figure 6
Figure 6
AML cells enhance the CD36 immunosuppressive pathway in response to decitabine treatment (A and B) Drug sensitivity AUC (area under the curve) values of decitabine in AML cell lines based on data from the Cancer Target Discovery and Development (CTD2) network. (C and D) The mRNA (C) and protein (D) levels of CD36 in 4 decitabine-resistant and 4 decitabine-sensitive AML cell lines are shown. (E and F) AML cells were stimulated with decitabine for 3 days. Then, the mRNA (E) and protein (F) levels of CD36 were determined (n = 3). (G) CD36 promoter methylation profile based on the ages of patients with AML in TCGA database. The beta value indicates the level of DNA methylation, ranging from 0 (unmethylated) to 1 (fully methylated). (H) AML cells stimulated with decitabine (4 μM) for 3 days were used for next-generation sequencing based on bisulfite sequencing PCR (n = 3). Heatmaps show the CpG methylation level at the promoter region of CD36. Two amplicons were used. (I and J) HFD or CD C57BL/6 mice (n = 6 per group) intravenously injected with 1 × 106 different kinds of C1498 cells were treated with or without decitabine (0.4 mg/kg, 3 times/week, i.p.) for 2 weeks after injection and were monitored for survival. (K) THP-1 cells were stimulated with decitabine for 3 days. Then, the protein levels of PD-L1 and ARG1 were detected by flow cytometry (n = 3). (L) MV4-11 cells stimulated with decitabine (4 μM) for 3 days were further used for T cell proliferation assay (n = 3). Nor-NOHA (0.5 mM) was added. (M) C57BL/6 mice (n = 5 per group) intravenously injected with 2 × 106 Cd36NC or Cd36KO C1498 cells were treated with different reagents (decitabine, 0.4 mg/kg, 3 times/week, i.p.; antibodies, 150 μg/mouse, 3 times/week, i.p.) for 2 weeks after injection and were monitored for survival. (N and O) CD33+ cells from 12 patients with AML were stimulated with decitabine (4 μM) for 2 days. Then, the protein levels of ARG1, PD-L1, and CD36 were detected by flow cytometry. (P) CD33+ cells from 6 patients with AML stimulated with or without decitabine (4 μM) or SSO (50 μM) for 3 days were further used for T cell proliferation assay (n = 3). Data are shown as mean ± SD. ∗p < 0.05, ∗∗p < 0.01, and ∗∗∗p < 0.001. ns, not significant.
Figure 7
Figure 7
Statin combined with decitabine delays AML progression (A and B) C57BL/6 mice (n = 5 per group) intravenously implanted with 2 × 106 Cd36NC or Cd36KO C1498 cells were treated with different reagents (decitabine [Dec], 0.4 mg/kg, 3 times/week, i.p.; antibodies, 150 μg/mouse, 3 times/week, i.p.; fluvastatin [Flu], 40 mg/kg, 5 times/week, i.g.) for 2 weeks after implantation and were monitored for survival. (C–E) NOG or PBMC-NOG mice (n = 5 per group) subcutaneously injected with 1 × 107 MV4-11 cells (C and D) or THP-1 cells (E) were treated with different drugs (Dec, 0.4 mg/kg, 3 times/week, i.p.; Flu, 40 mg/kg, 5 times/week, i.g.) for 2 weeks after injection. Tumor size or human T cells in PB were monitored 13 (E) or 28 days (C and D) after injection. (F–I) Response rates for selected subgroups (F and I) and blood lipid values for selected subgroups (H) were shown. (G) Odds ratios for achievement of CR estimated by multivariate analyses. Data are shown as mean ± SD. ∗p < 0.05, ∗∗p < 0.01, and ∗∗∗p < 0.001. ns, not significant.

References

    1. Lübbert M., Suciu S., Baila L., Rüter B.H., Platzbecker U., Giagounidis A., Selleslag D., Labar B., Germing U., Salih H.R., et al. Low-dose decitabine versus best supportive care in elderly patients with intermediate- or high-risk myelodysplastic syndrome (MDS) ineligible for intensive chemotherapy: final results of the randomized phase III study of the European Organisation for Research and Treatment of Cancer Leukemia Group and the German MDS Study Group. J. Clin. Oncol. 2011;29:1987–1996. doi: 10.1200/jco.2010.30.9245. - DOI - PubMed
    1. Kantarjian H.M., Thomas X.G., Dmoszynska A., Wierzbowska A., Mazur G., Mayer J., Gau J.P., Chou W.C., Buckstein R., Cermak J., et al. Multicenter, randomized, open-label, phase III trial of decitabine versus patient choice, with physician advice, of either supportive care or low-dose cytarabine for the treatment of older patients with newly diagnosed acute myeloid leukemia. J. Clin. Oncol. 2012;30:2670–2677. doi: 10.1200/jco.2011.38.9429. - DOI - PMC - PubMed
    1. DiNardo C.D., Jonas B.A., Pullarkat V., Thirman M.J., Garcia J.S., Wei A.H., Konopleva M., Döhner H., Letai A., Fenaux P., et al. Azacitidine and Venetoclax in Previously Untreated Acute Myeloid Leukemia. N. Engl. J. Med. 2020;383:617–629. doi: 10.1056/NEJMoa2012971. - DOI - PubMed
    1. Pollyea D.A., Stevens B.M., Jones C.L., Winters A., Pei S., Minhajuddin M., D'Alessandro A., Culp-Hill R., Riemondy K.A., Gillen A.E., et al. Venetoclax with azacitidine disrupts energy metabolism and targets leukemia stem cells in patients with acute myeloid leukemia. Nat. Med. 2018;24:1859–1866. doi: 10.1038/s41591-018-0233-1. - DOI - PMC - PubMed
    1. Jones C.L., Stevens B.M., D'Alessandro A., Reisz J.A., Culp-Hill R., Nemkov T., Pei S., Khan N., Adane B., Ye H., et al. Inhibition of Amino Acid Metabolism Selectively Targets Human Leukemia Stem Cells. Cancer Cell. 2018;34:724–740.e724. doi: 10.1016/j.ccell.2018.10.005. - DOI - PMC - PubMed

MeSH terms