. 2024 Jun 6;7(8):e202402828.
doi: 10.26508/lsa.202402828. Print 2024 Aug.

Mitochondrial lipidomes are tissue specific - low cholesterol contents relate to UCP1 activity

Affiliations

Mitochondrial lipidomes are tissue specific - low cholesterol contents relate to UCP1 activity

Sarah Brunner et al. Life Sci Alliance. .

Abstract

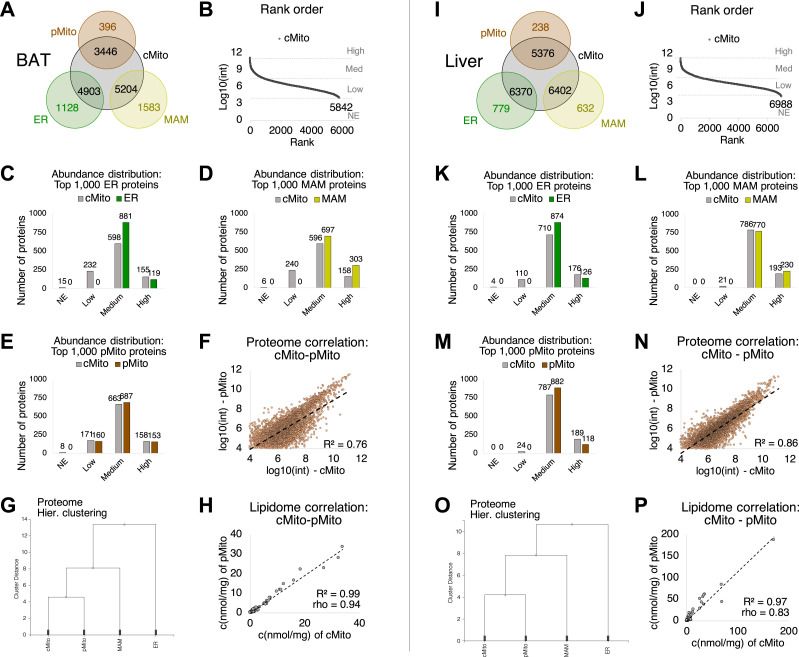
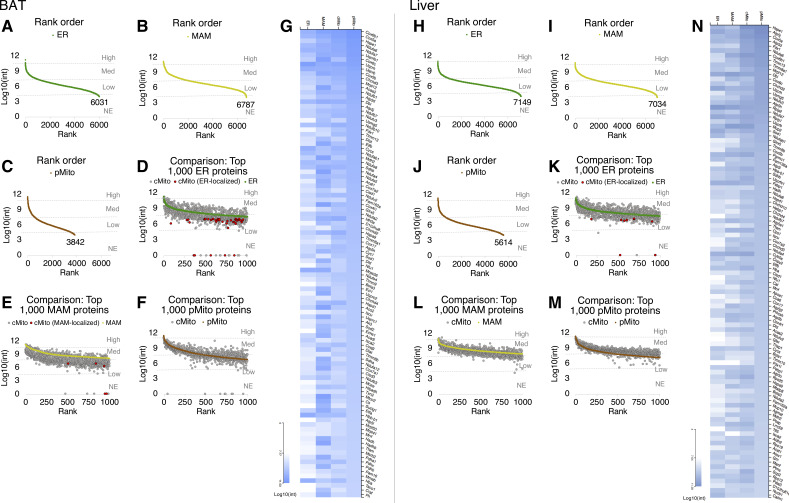
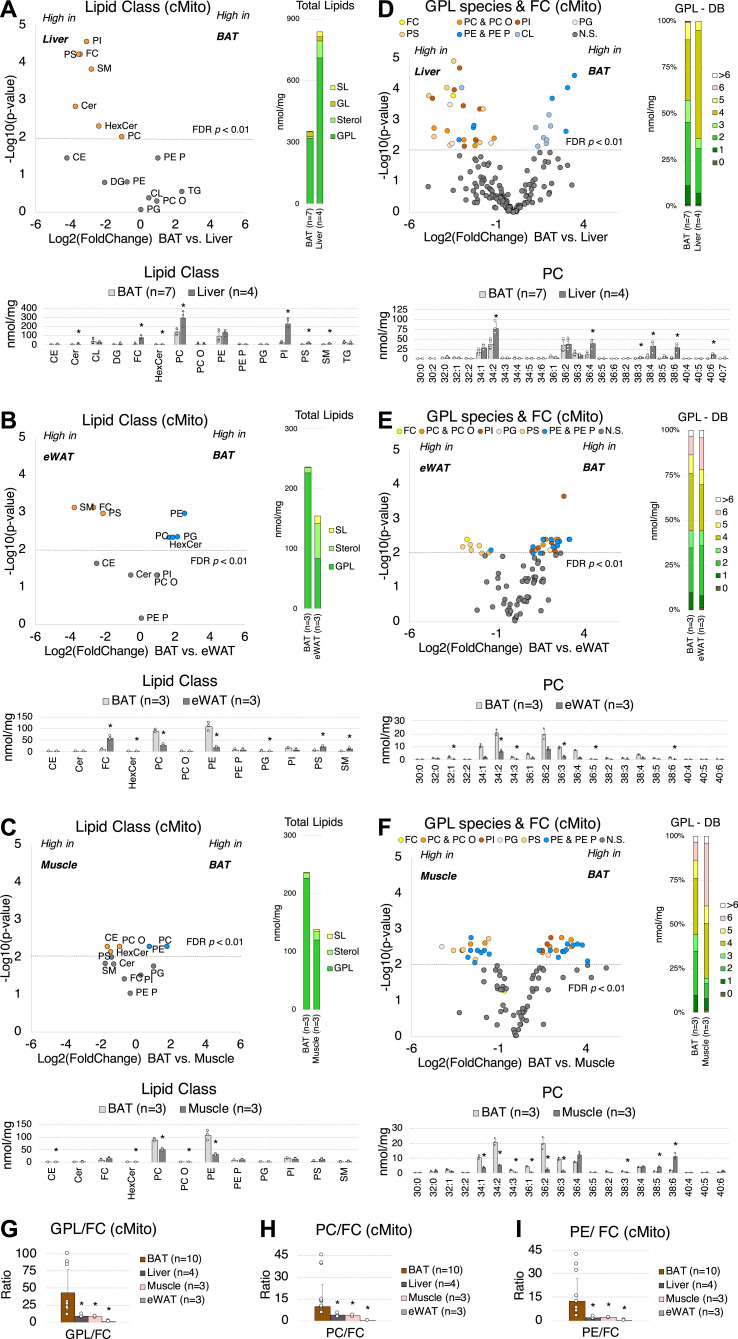
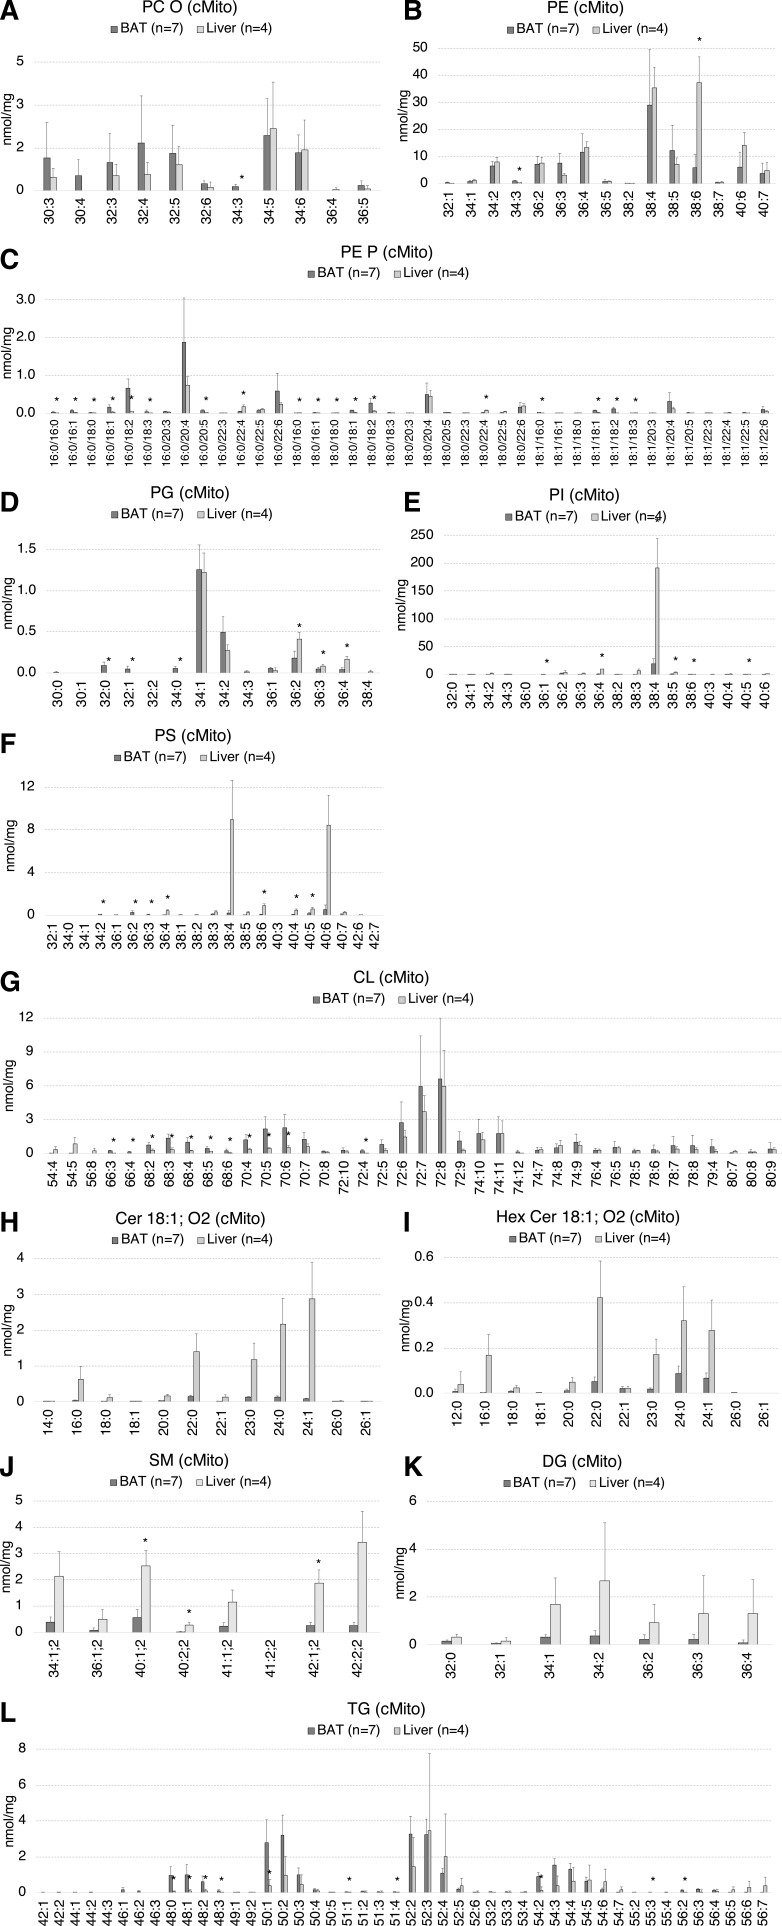
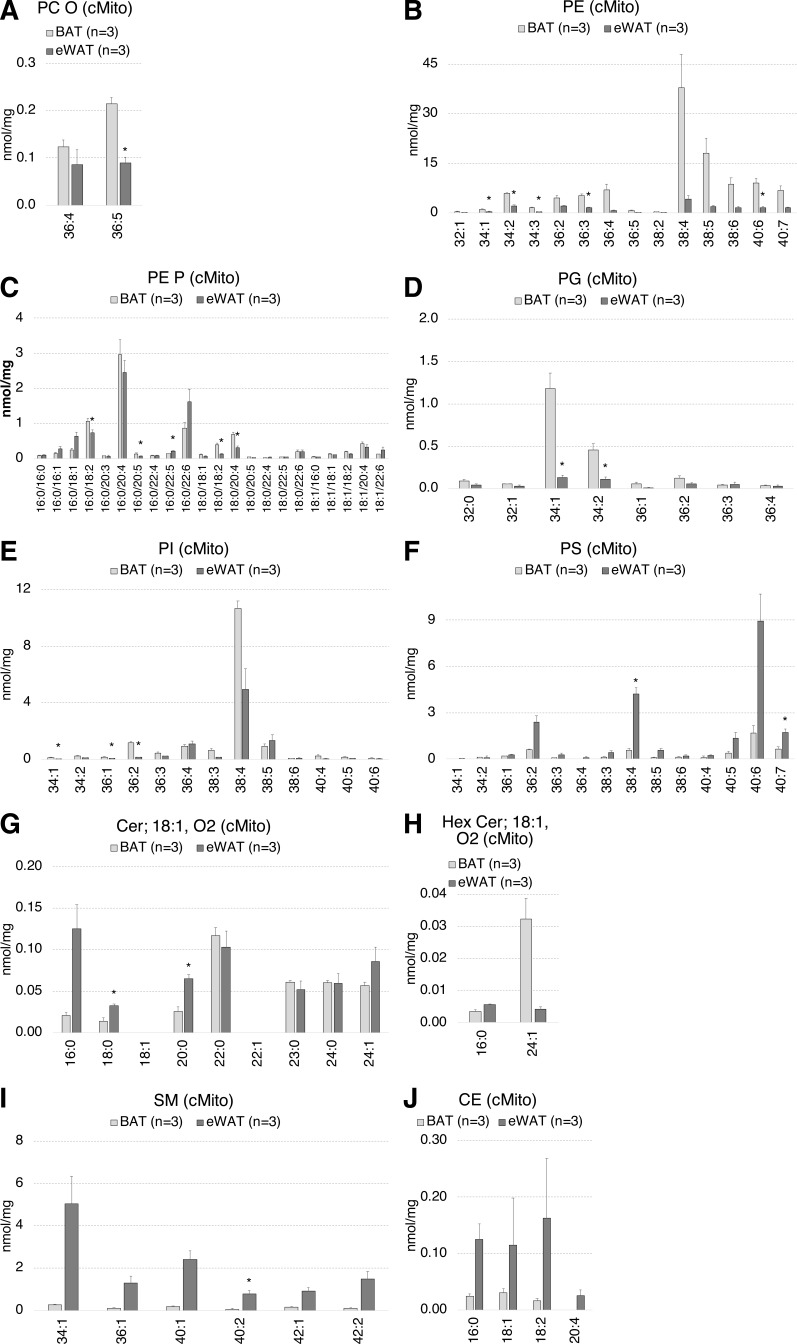
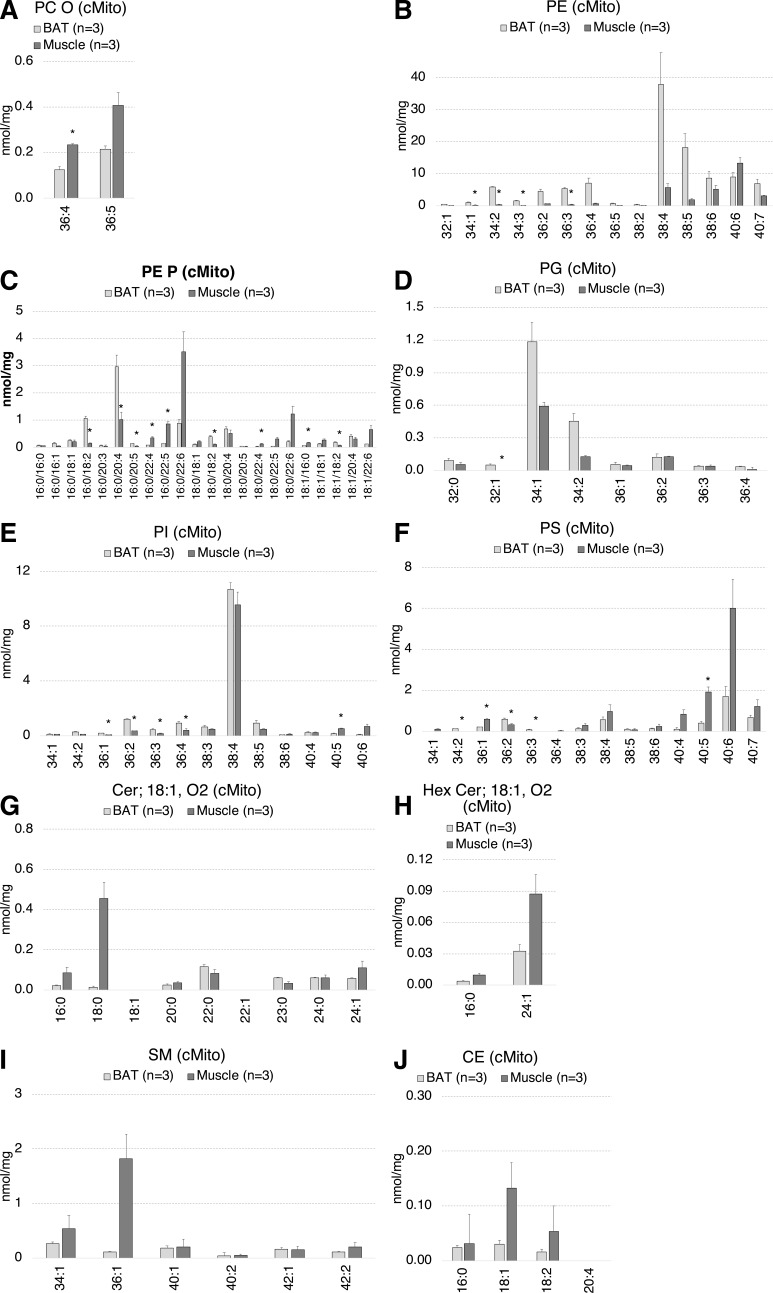
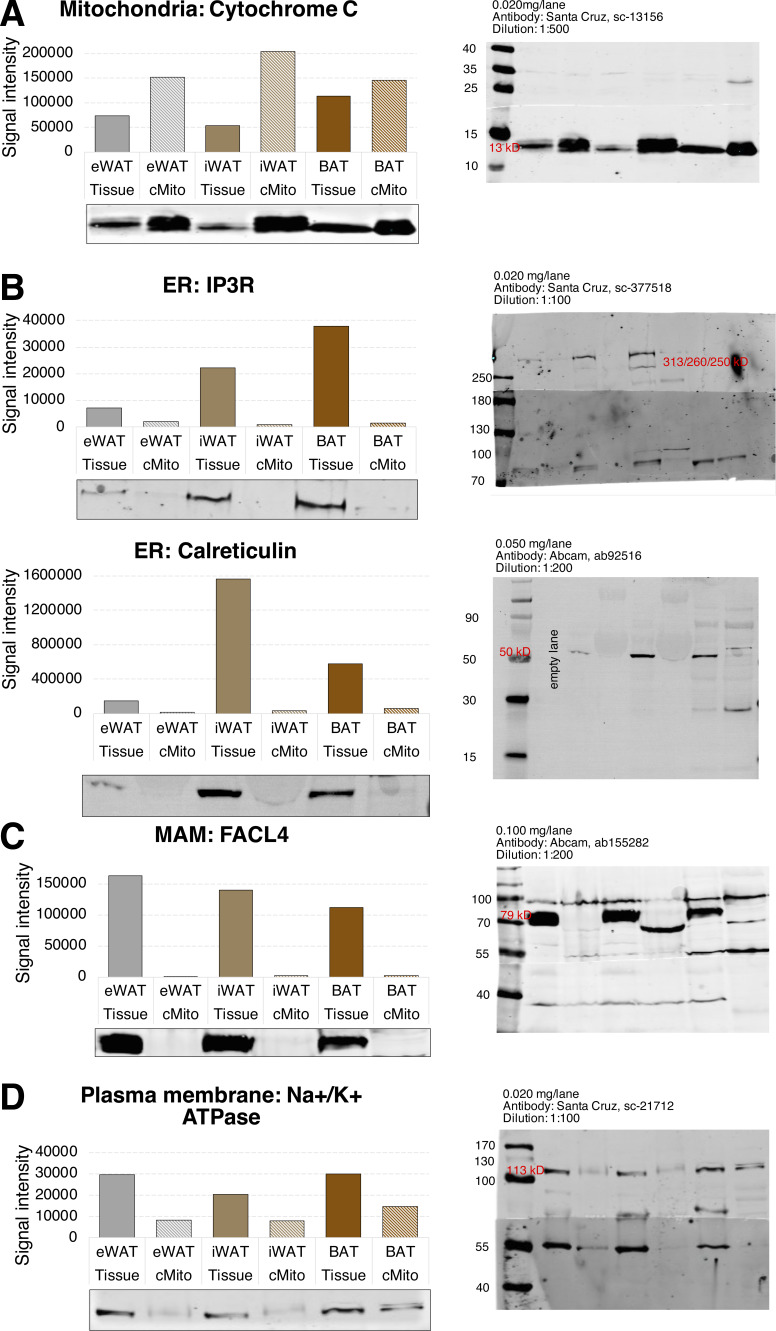
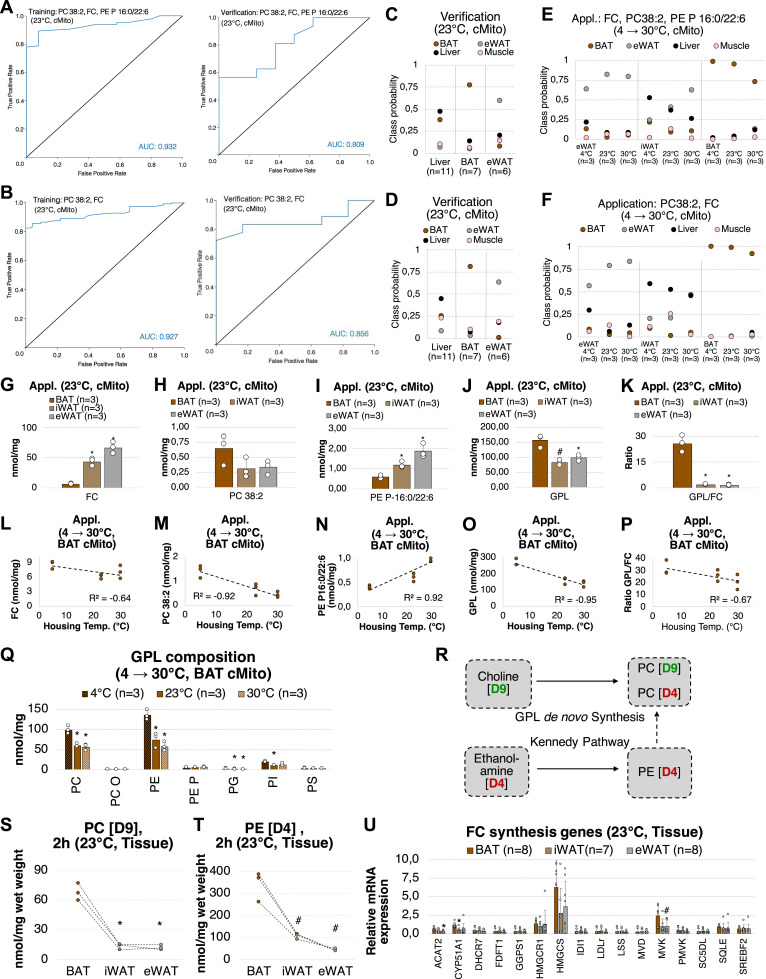
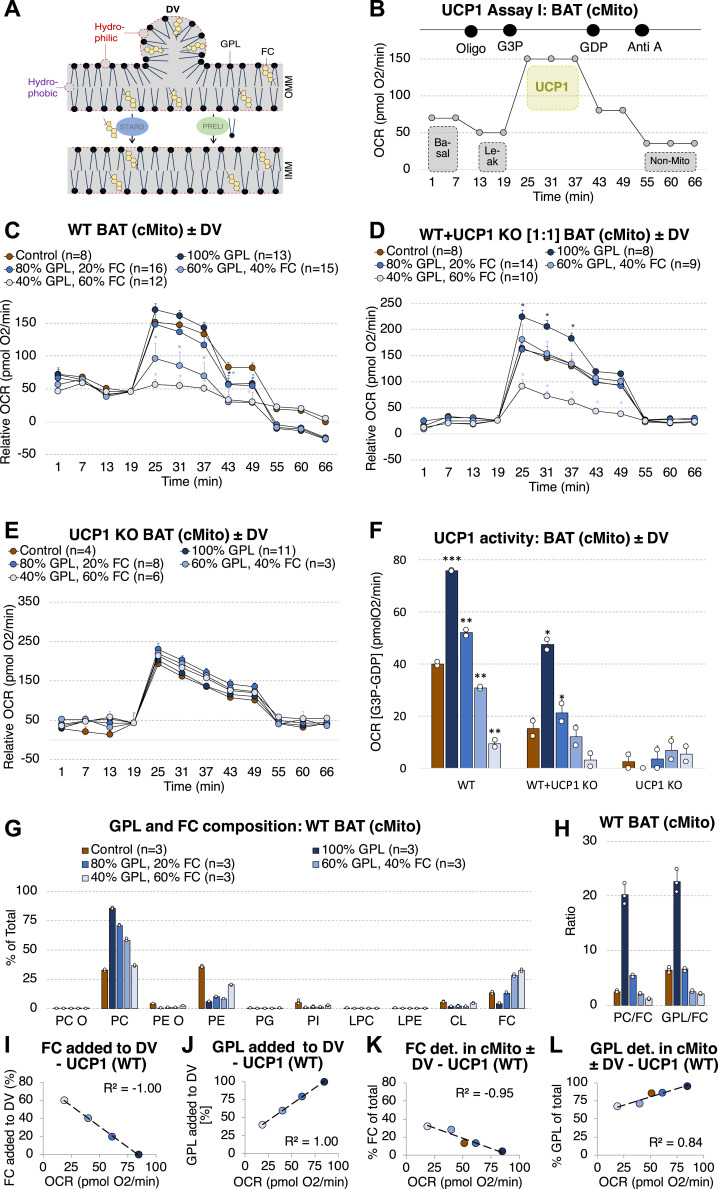
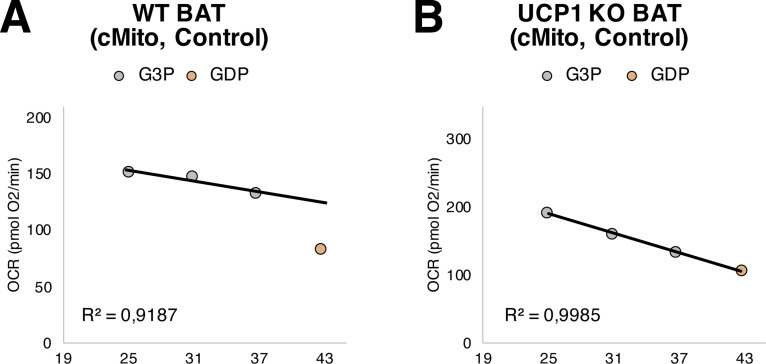
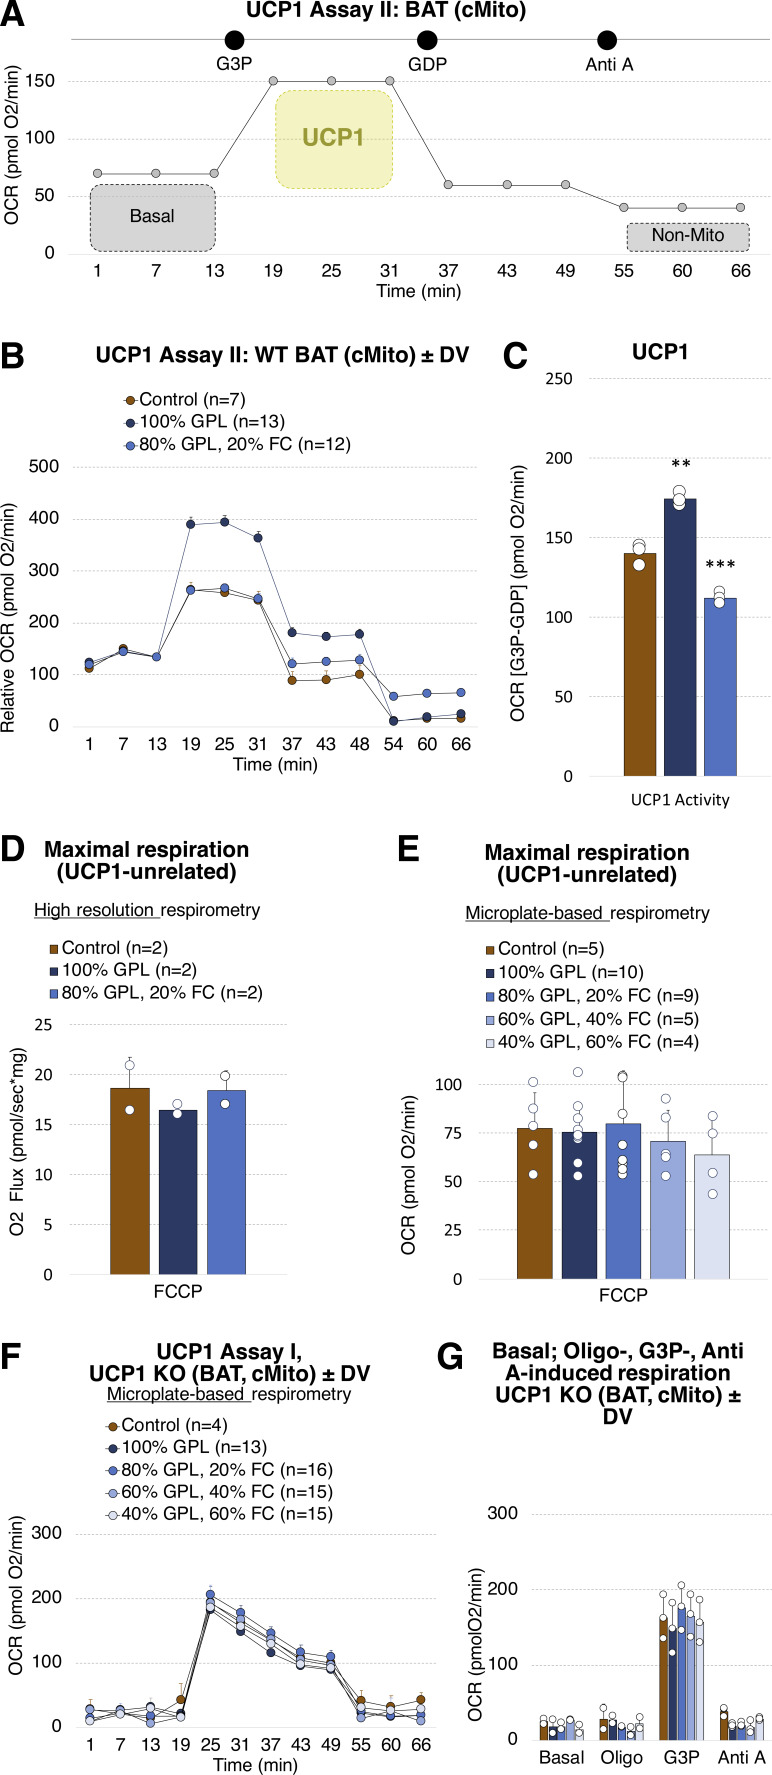
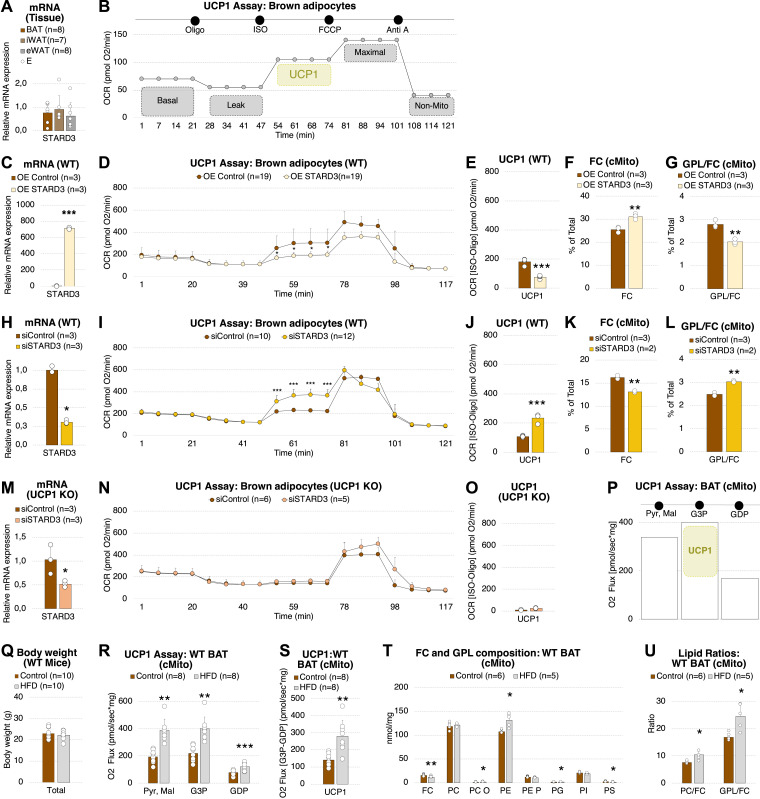
Lipid composition is conserved within sub-cellular compartments to maintain cell function. Lipidomic analyses of liver, muscle, white and brown adipose tissue (BAT) mitochondria revealed substantial differences in their glycerophospholipid (GPL) and free cholesterol (FC) contents. The GPL to FC ratio was 50-fold higher in brown than white adipose tissue mitochondria. Their purity was verified by comparison of proteomes with ER and mitochondria-associated membranes. A lipid signature containing PC and FC, calculated from the lipidomic profiles, allowed differentiation of mitochondria from BAT of mice housed at different temperatures. Elevating FC in BAT mitochondria prevented uncoupling protein (UCP) 1 function, whereas increasing GPL boosted it. Similarly, STARD3 overexpression facilitating mitochondrial FC import inhibited UCP1 function in primary brown adipocytes, whereas a knockdown promoted it. We conclude that the mitochondrial GPL/FC ratio is key for BAT function and propose that targeting it might be a promising strategy to promote UCP1 activity.


Conflict of interest statement

The authors declare that they have no conflict of interest.

Figures

Figure 1.
Figure 1.. Mitochondria isolated by differential centrifugation are highly enriched and contain negligible fractions of ER and MAM.
(A, B, C, D, E, F, G, H, I, J, K, L, M, N, O, P) Data from BAT organelles are shown in (A, B, C, D, E, F, G, H), those from liver are shown in (I, J, K, L, M, N, O, P). (A, I) Venn diagrams of proteins detected in cMito and pMito or ER or MAM. (B, J) Rank order of proteins after a full proteome analysis for cMito. (C, D, E, K, L, M) Distribution of the top 1,000 ranked proteins according to their signal intensities in ER (C, K), MAM (D, L), and pMito (E, M) in comparison with cMito after classification into not expressed (NE; log10 [int] < 4), low (log10 [int] 4–6), medium (log10 [int] 7–9), and high (log10 [int] > 9) expressed proteins. (F, N) Correlation of signal intensities from all proteins detected in pMito and cMito. (G, O) Hierarchical cluster analysis of the 1,000 most abundant pMito proteins compared with cMito, ER, and MAM. All proteomic data were obtained from ER, MAM, cMito, and pMito samples prepared from pooled BAT of 5–15 mice or liver of five mice. (H, P) Lipidome correlation between lipid species quantified in pMito (isolated from pooled BAT of 15 mice or liver of five mice) and cMito (means of n = 7 preparations with each isolated from liver samples or pooled BAT of five mice) after a lipidomic analysis. R2 indicates Pearson’s, rho indicates Spearman’s correlation coefficients. Source data are available for this figure.
Figure S1.
Figure S1.. Mitochondria isolated by differential centrifugation are highly enriched and contain negligible fractions of ER and MAM.
(A, B, C, D, E, F, G, H, I, J, K, L, M, N) Data from BAT organelles are shown in (A, B, C, D, E, F, G), those from liver are shown in (H, I, J, K, L, M, N). (A, B, C, H, I, J) Rank order of proteins after a full proteome analysis for ER (A, H), MAM (B, I), and pMito (C, J) fractions. (D, E, F, K, L, M) Comparison of signal intensities in the top 1,000 ranked ER (D, K), MAM (E, L), and pMito (F, M) proteins with cMito; Red dots indicate ER-localized (D, K) or MAM-localized (E) proteins, identified with PubMed, UniProt or the Gene Ontology Resource. (G, N) Heatmap of top 100 ranked pMito proteins after hierarchical cluster analysis. All proteomic data were obtained from ER, MAM, cMito, and pMito samples prepared from pooled BAT of 5–15 mice or liver of five mice.
Figure 2.
Figure 2.. The mitochondrial lipidome including GPL and FC of BAT mitochondria significantly differs to those of the liver, WAT, and muscle.
(A) Lipid class composition of mitochondria from BAT (n = 7) versus liver (n = 4). (B) BAT (n = 3) versus eWAT (n = 3). (C) BAT (n = 3) versus skeletal muscle (n = 3). Volcano plots show significant differences (−Log10 [P-value]) of log2 fold change in lipid classes. Orange dots indicate lipid species significantly decreased in BAT and blue dots indicate lipid species significantly increased in BAT; Stacked barplots show total lipid levels and distribution into SL, GL, Sterols, and GPL (means); Barplots show lipid class compositions (means +SD), *P < 0.01 after FDR correction. (D) GPL species and FC composition of mitochondria from BAT (n = 7) versus liver (n = 4). (E) BAT (n = 3) versus eWAT (n = 3). (F) BAT (n = 3) versus skeletal muscle (n = 3); Volcano plots show significant differences (−Log10 [P-value]) of log2 fold change in GPL species and FC. Each dot represents a specific lipid species and the color indicates to which lipid class it belongs; Stacked barplots show distribution of saturation in GPL as number of double bonds (means); Barplots show PC species composition (means ± SD), *P < 0.01 after FDR correction. (G) GPL/FC. (H) PC/FC. (I) PE/FC. Calculated from all analyzed mitochondria samples of BAT (n = 10), liver (n = 4), muscle (n = 3) and eWAT (n = 3); GPL included PC, PC O, PE, PE P, PS, PI, PG; Shown are means ± SD, *P < 0.01 indicates a significant difference relative to BAT, determined using a two-sided t test. Each mitochondrial sample was isolated from tissue pooled of n = 5 mice. Source data are available for this figure.
Figure S2.
Figure S2.. The mitochondrial lipid species profiles including PC O, PE, PE P, PG, PI, PS, CL, SM, and TG of BAT mitochondria significantly differ to those of liver.
(A, B, C, D, E, F, G, H, I, J, K, L) Lipid species composition of mitochondria from BAT (n = 7) versus liver (n = 4). (A, B, C, D, E, F, G, H, I, J, K, L) PC O (A), PE (B), PE P (C), PG (D), PI (E), PS (F), CL (G), Cer (H), Hex-Cer (I), SM (J), DG (K), and TG (L). Shown are means ± SD, *P < 0.01 indicates a significant difference relative to BAT, determined using a two-sided t test. Each mitochondrial sample was isolated from tissue pooled of n = 5 mice.
Figure S3.
Figure S3.. The mitochondrial lipid species profiles including PC O, PE, PE P, PG, PI, PS, Cer, and SM of BAT mitochondria significantly differ to those of eWAT.
(A, B, C, D, E, F, G, H, I, J) Lipid species composition of mitochondria from BAT (n = 3) versus eWAT (n = 3). (A, B, C, D, E, F, G, H, I, J) PC O (A), PE (B), PE P (C), PG (D), PI (E), PS (F), Cer (G), Hex-Cer (H), SM (I), CE (J). Shown are means ± SD, *P < 0.01 indicates a significant difference relative to BAT, determined using a two-sided t test. Each mitochondrial sample was isolated from tissue pooled of n = 5 mice.
Figure S4.
Figure S4.. The mitochondrial lipid species profiles including PC O, PE, PE P, PG, PI, and PS of BAT mitochondria significantly differ to those of skeletal muscle.
(A, B, C, D, E, F, G, H, I, J) Lipid species composition of mitochondria from BAT (n = 3) versus skeletal muscle (n = 3). (A, B, C, D, E, F, G, H, I, J) PC O (A), PE (B), PE P (C), PG (D), PI (E), PS (F), Cer (G), Hex-Cer (H), SM (I), CE (J). Shown are means ± SD, *P < 0.01 indicates a significant difference relative to BAT, determined using a two-sided t test. Each mitochondrial sample was isolated from tissue pooled of n = 5 mice.
Figure S5.
Figure S5.. Western Blot analyses showing that cMito preparations of WAT and BAT have similar purities.
(A, B, C, D) Protein levels of Cyt C (A), IP3R and Calreticulin (B), FACL4 (C), and Na+/K+-ATPase (D) as organelle markers for mitochondria, ER, MAM, and plasma membrane in eWAT, iWAT and BAT and thereof isolated mitochondria. Each mitochondrial sample was isolated from tissue pooled of n = 5 mice. The protein’s signal intensities were determined using the Image Studio Lite Quantification Software after background correction.
Figure 3.
Figure 3.. A BAT-specific lipid signature comprising PC38:2 and FC as well as the GPL/FC ratio can be related to adipose tissue browning.
(A, B) ROC curves of prediction models based on Random Forest (RF) containing either three lipid species (PC38:2, FC, PE P 16:0/22/6) (A) or 2 lipid species (PC38:2, FC) (B) for training (BAT, n = 6; liver, n = 3; eWAT, n = 3; muscle, n = 3) and verification (liver, n = 11; BAT, n = 7; eWAT n = 6; muscle was not tested) sample sets. (C, D) Classification probabilities, which indicate the individual prediction confidences for BAT, eWAT, the liver and muscle, of both models tested on the verification sample sets. A score of 1 equals to 100% confidence. Shown are the means. (E, F) Classification probabilities of the models tested on a new set of mitochondria isolated from eWAT, iWAT, and BAT of mice housed at 4°C, 23°C, and 30°C of n = 3 per condition. Shown are means. iWAT was not part of the training sample set and, hence, cannot be predicted as such. g, FC, h, PC 38:2, i, PE P 16:0/22:6, j, GPL, k, GPL/FC ratio in BAT, iWAT and eWAT mitochondria from mice housed at 23°C. (E, F) Samples are identical to those used in (E, F); Shown are means of n = 3 ± SD. (L, M, N, O, P) Correlation of FC, (m) PC 38:2, (N) PE P 16:0/22:6, (O) GPL, and (P) GPL/FC from BAT mitochondria with mice housing temperatures. R2 indicate Pearson’s correlation coefficients. (Q) GPL composition of BAT mitochondria from mice housed at 4°C, 23°C, and 30°C. Shown are means ± SD of three mice. (R) Labeling strategy to quantify de novo PC and PE synthesis in mice. PE (D4) to PC (D4) conversion was not detected in adipose tissue. (S, T) PC (D9), (T) PE (D4) levels detected 2 h after i.p. injection of choline (D9) and ethanolamine (D4) in BAT, iWAT, and eWAT of n = 3 mice housed at 23°C. Associated samples originating from the identical mouse are linked by dashed lines. (U) mRNA expression of cholesterol synthesis genes in BAT (n = 8), iWAT (n = 7), and eWAT (n = 8) from mice housed at 23°C. Shown are means ± SD. (G, H, I, J, K, Q, S, T) *P < 0.01, #P < 0.05 indicate a significant difference relative to BAT 23°C (cMito, (G, H, I, J, K)), BAT 4°C (cMito, (Q)), or BAT 23°C (S, T); determined using a two-sided t test. Each mitochondrial sample was isolated from tissue pooled of n = 5 mice. Source data are available for this figure.
Figure 4.
Figure 4.. 1UCP1 function in BAT mitochondria depends on their GPL/FC ratio.
(A) Scheme illustrating principles for fusion of GPL- and FC-containing DV with mitochondria. (B) Microplate-based respirometry assay applied to profile UCP1 activity in mitochondria isolated from BAT of mice housed at 23°C. The oxygen consumption rate (OCR) was measured at (1) basal conditions, after injections of (2) oligomycin (to inhibit CV, equals basal leak respiration), (3) G3P (to fuel electron transport chain and UCP1 activity), (4) GDP (to inhibit UCP1 activity), and (5) antimycin A (to block electron transport chain, equals non-mitochondrial respiration). (C, D, E) Mitochondrial bioenergetics of BAT WT (C), mixed WT-UCP1 KO (1:1) (D), and UCP1 KO mitochondria. Shown are means ± SD. *P < 0.05, indicate a significant difference for the comparisons control versus 100% GPL or 80% GPL-20% FC or 60% GPL-40% FC or 40% GPL-60% FC; determined using a two-sided t test. (E) loaded with donor vesicles (DV) containing varying ratios in GPL (PC, PA) and FC. Shown are data normalized to the OCR determined before G3P injection (19.0 min). (B, C, D, F) UCP1 activity calculated by subtraction of the OCR at (4) (GDP) from (3) (G3P) determined in (B, C, D). (G, H) Lipid class composition, (H) PC/FC and GPL/FC of BAT mitochondria that were untreated or loaded with DV containing varying ratios in GPL (POPC, POPA) and FC (n = 3). Measured with mass spectrometry. Shown are means ± SD. *P < 0.05, **P < 0.01, ***P < 0.001 indicate a significant difference for the comparisons control versus 100% GPL, 100% GPL versus 80% GPL-20% FC, 80% GPL-20% FC versus 60% GPL-40% FC and 60% GPL-40% FC versus 40% GPL-60% FC; determined using a two-sided t test. (I, J) Correlation of UCP1 activity with contents of FC (I) or GPL (J) added to DV. (K, L) Correlation of UCP1 activity with contents of FC (K) or GPL (L) measured with mass spectrometry in BAT mitochondria incubated with donor vesicles. R2 indicate Pearson’s correlation coefficients. Each mitochondrial sample was isolated from tissue pooled of n = 5 mice. Source data are available for this figure.
Figure S6.
Figure S6.. GDP reduces UCP1-dependent O2 consumption in mitochondria isolated from BAT of WT mice, but has no effect in those isolated from BAT of UCP1 KO animals.
(A) Oxygen consumption rate after G3P (25-31-37 min) and GDP injection (43 min) in control mitochondria (not incubated with donor vesicles) isolated from BAT of WT mice. Shown are means of n = 8. OCRs at 25-31-37 min were related by linear regression, the coefficient of determination is indicated as R2. (B) Oxygen consumption rate after G3P (25-31-37 min) and GDP injection (43 min) in control mitochondria (not incubated with donor vesicles) isolated from BAT of UCP1 KO mice. Shown are means of n = 4. OCRs at 25-31-37-43 min were related by linear regression, the coefficient of determination is indicated as R2. Analyzed with the microplate-based respirometry assay shown in Fig 4A.
Figure S7.
Figure S7.. GPL/FC influences UCP1 activity in mitochondria isolated from BAT of WT mice, independently of oligomycin application before G3P injection.
Basal respiration and maximal respiratory capacity unrelated to UCP1 are not affected. (A) Microplate-based respirometry assay applied to profile UCP1 activity in mitochondria isolated from BAT of mice housed at 23°C. The oxygen consumption rate (OCR) was measured at (1) basal conditions, after injections of (2) G3P (to fuel electron transport chain and UCP1 activity), (3) GDP (to inhibit UCP1 activity) and (4) antimycin A (to block electron transport chain, equals non-mitochondrial respiration). (B) Bioenergetics of BAT WT mitochondria loaded without or with donor vesicles (DV) containing 100% GPL or 80% GPL and 20% FC. Shown are data normalized to the OCR determined before G3P injection (19.0 min). (B, C) UCP1 activity calculated by subtraction of the OCR at (3) (GDP) from (2) (G3P) determined in (B). (D) FCCP-induced maximal respiratory capacity determined with high-resolution respirometry of BAT WT mitochondria loaded without or with donor vesicles (DV) containing 100% GPL or 80% GPL-20% FC. (E) FCCP-induced maximal respiratory capacity determined with microplate-based respirometry of BAT WT mitochondria loaded without or with donor vesicles (DV) containing 100% GPL, 80% GPL-20% FC, 60% GPL-40% FC or 40% GPL-60% FC. Shown are means ± SD. *P < 0.05, **P < 0.01, ***P < 0.001 indicate a significant difference for the comparisons control versus 100% GPL and 100% GPL versus 80% GPL-20% FC; determined using a two-sided t test. (F) Mitochondrial bioenergetics of UCP1 KO mitochondria loaded with donor vesicles (DV) containing varying ratios in GPL (PC, PA) and FC. Determined with the microplate-based respirometry Assay I described in Fig 4B. (G) Basal, oligo-induced (= basal uncoupled), G3P-induced, GDP-induced, and Anti A-induced (=non-mitochondrial) respiration, illustrated as bar plots. (F) Shown are means calculated from the OCRs shown in panel (F) ± SD.
Figure 5.
Figure 5.. UCP1 function depends on STARD3-mediated cholesterol import and the dietary fat content.
(A) STARD3 mRNA expression in BAT (n = 8), iWAT (n = 7), and eWAT (n = 8) from WT animals. (B) Microplate-based respirometry assay applied to profile UCP1 activity in primary brown adipocytes. The oxygen consumption rate (OCR) was measured at (1) basal conditions, after injections of (2) oligomycin (Complex V inhibition), (3) ISO (UCP1 induction), (4) FCCP (maximal O2 consumption), and (5) antimycin A (inhibition of electron transport chain). (B, C, D, E, F, G) STARD3 mRNA expression (n = 3), (D) Mitochondrial bioenergetics (n = 19), measured with the assay described in (B, E) UCP1 activity calculated by subtraction of the OCR at (2) (Oligo) from (3) (ISO), determined in (D) (n = 19), (F) FC (n = 3) and (G), GPL/FC (n = 3) of WT primary brown adipocytes overexpressing (OE) STARD3 and thereof isolated mitochondria. (H) STARD3 mRNA expression (n = 3). (I) Mitochondrial bioenergetics (n = 10–12). (J) UCP1 activity (n = 10–12). (K, L) FC (n = 3) and (L), GPL/FC (n = 3) of WT primary brown adipocytes treated with siRNA against STARD3 and thereof isolated mitochondria. (M) STARD3 mRNA expression (n = 3). (N, O) Mitochondrial bioenergetics (n = 5–6) and (O), UCP1 activity (n = 5–6) of UCP1 KO primary brown adipocytes treated with siRNA against STARD3. (P) High-resolution respirometry assay to profile UCP1 activity in mitochondria isolated from BAT of mice used in the dietary intervention experiments (control or HFD for 14 d). OCR was measured after injections of (1) Pyr and Mal (complex I substrates), (2) G3P (to fuel electron transport chain and UCP1 activity) and (3) GDP (to inhibit UCP1 activity). (Q) Body weight (n = 10). (R) O2 flux after applying the UCP1 assay described in p (n = 8). (S) UCP1 activity calculated by subtraction of the O2 flux at (3) (GDP) from (2) (G3P) determined in r (n = 8). (T) Lipid class composition (n = 5–6). (U) PC/FC and GPL/FC of mitochondria isolated from BAT of mice fed a control or HFD for 14 d. Shown are means ± SD. *P < 0.05, **P < 0.01, ***P < 0.001 indicate a significant difference determined using a two-sided t test. Each mitochondrial sample was isolated from tissue pooled of n = 5 mice. SDs for panels (D, I, N) are partly too small to be visible. They can be found in the Source Data. Source data are available for this figure.

References

    1. Asif K, Memeo L, Palazzolo S, Frion-Herrera Y, Parisi S, Caligiuri I, Canzonieri V, Granchi C, Tuccinardi T, Rizzolio F (2021) Stard3: A prospective target for cancer therapy. Cancers 13: 4693. 10.3390/cancers13184693 - DOI - PMC - PubMed
    1. Balaz M, Becker AS, Balazova L, Straub L, Muller J, Gashi G, Maushart CI, Sun W, Dong H, Moser C, et al. (2019) Inhibition of mevalonate pathway prevents adipocyte browning in mice and men by affecting protein prenylation. Cell Metab 29: 901–916.e8. 10.1016/j.cmet.2018.11.017 - DOI - PubMed
    1. Balboa E, Castro J, Pinochet MJ, Cancino GI, Matias N, Saez PJ, Martinez A, Alvarez AR, Garcia-Ruiz C, Fernandez-Checa JC, et al. (2017) Mln64 induces mitochondrial dysfunction associated with increased mitochondrial cholesterol content. Redox Biol 12: 274–284. 10.1016/j.redox.2017.02.024 - DOI - PMC - PubMed
    1. Becher T, Palanisamy S, Kramer DJ, Eljalby M, Marx SJ, Wibmer AG, Butler SD, Jiang CS, Vaughan R, Schoder H, et al. (2021) Brown adipose tissue is associated with cardiometabolic health. Nat Med 27: 58–65. 10.1038/s41591-020-1126-7 - DOI - PMC - PubMed
    1. Bian Y, Zheng R, Bayer FP, Wong C, Chang YC, Meng C, Zolg DP, Reinecke M, Zecha J, Wiechmann S, et al. (2020) Robust, reproducible and quantitative analysis of thousands of proteomes by micro-flow lc-ms/ms. Nat Commun 11: 157. 10.1038/s41467-019-13973-x - DOI - PMC - PubMed