. 2024 Jul;65(7):100573.
doi: 10.1016/j.jlr.2024.100573. Epub 2024 Jun 4.

Adipose-derived mesenchymal stem cells' adipogenesis chemistry analyzed by FTIR and Raman metrics

Affiliations

Adipose-derived mesenchymal stem cells' adipogenesis chemistry analyzed by FTIR and Raman metrics

Karolina Augustyniak et al. J Lipid Res. 2024 Jul.

Abstract

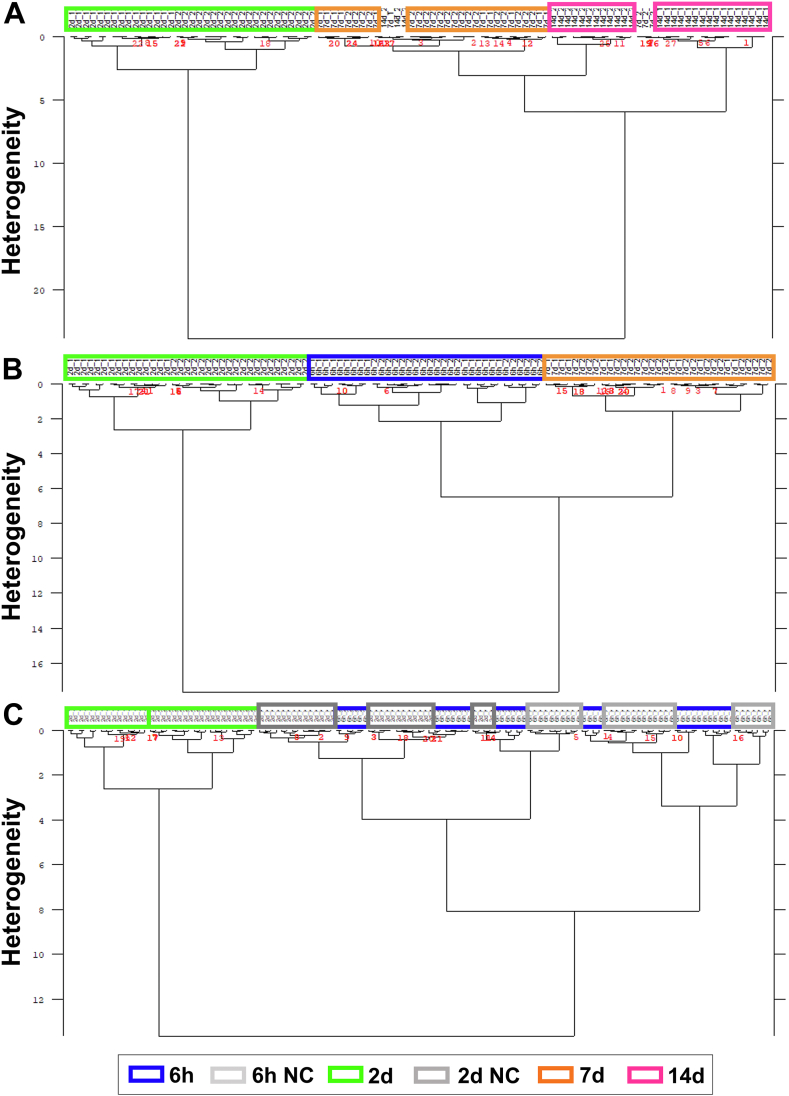
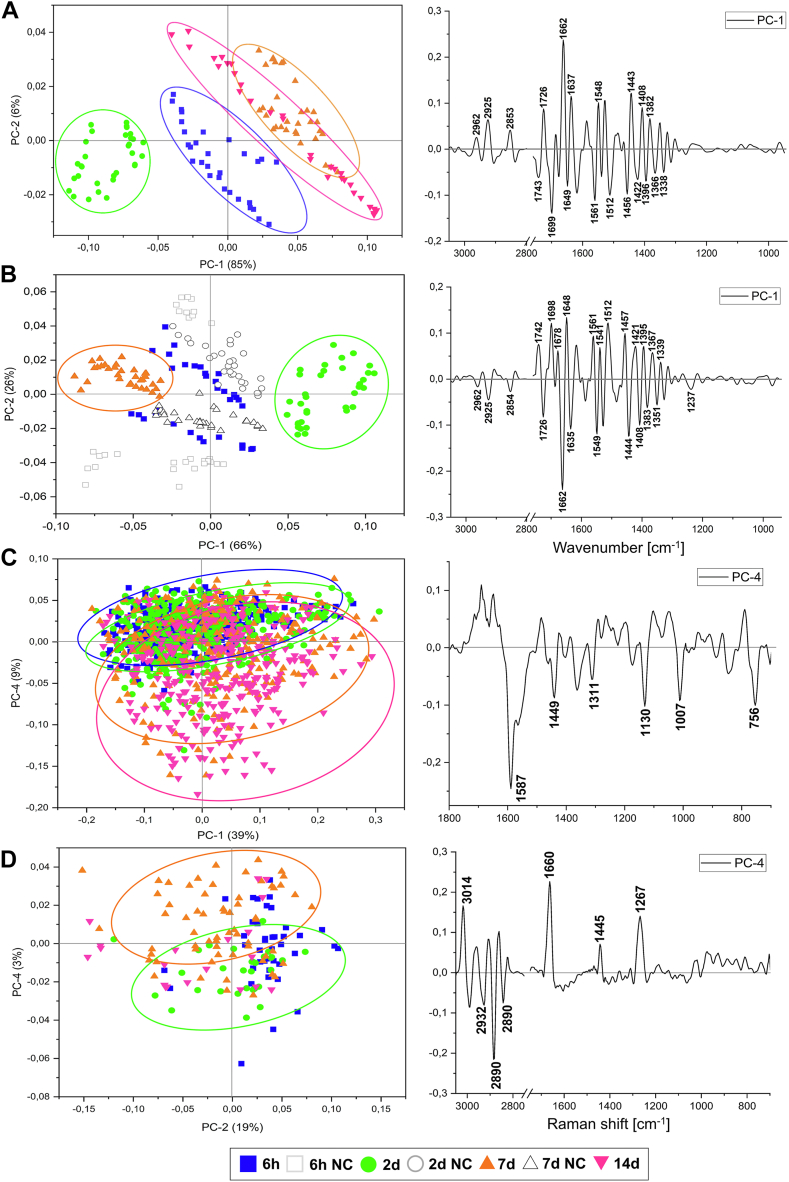
The full understanding of molecular mechanisms of cell differentiation requires a holistic view. Here we combine label-free FTIR and Raman hyperspectral imaging with data mining to detect the molecular cell composition enabling noninvasive monitoring of cell differentiation and identifying biochemical heterogeneity. Mouse adipose-derived mesenchymal stem cells (AD-MSCs) undergoing adipogenesis were followed by Raman and FT-IR imaging, Oil Red, and immunofluorescence. A workflow of the data analysis (IRRSmetrics4stem) was designed to identify spectral predictors of adipogenesis and test machine-learning (ML) methods (hierarchical clustering, PCA, PLSR) for the control of the AD-MSCs differentiation degree. IRRSmetrics4stem provided insights into the chemism of adipogenesis. With single-cell tracking, we established IRRS metrics for lipids, proteins, and DNA variations during AD-MSCs differentiation. The over 90% predictive efficiency of the selected ML methods proved the high sensitivity of the IRRS metrics. Importantly, the IRRS metrics unequivocally recognize a switch from proliferation to differentiation. This study introduced a new bioassay identifying molecular markers indicating molecular transformations and delivering rapid and machine learning-based monitoring of adipogenesis that can be relevant to other differentiation processes. Thus, we introduce a novel, rapid, machine learning-based bioassay to identify molecular markers of adipogenesis. It can be relevant to identification of differentiation-related molecular processes in other cell types, and beyond the cell differentiation including progression of different cellular pathophysiologies reconstituted in vitro.

Keywords: adipogenesis; mesenchymal stem cells; prediction of differentiation stage; regenerative medicine; spectroscopic molecular imaging.


Conflict of interest statement

Conflict of interest The authors declare that they have no known competing financial interests or personal relationships that could have appeared to influence the work reported in this paper.

Figures

Scheme 1
Scheme 1
The flowchart representing data processing for IRRSmetrics4stem approach.
Fig. 1
Fig. 1
AD-MSCs undergoing differentiation and the control cell culture (Negative Control; NC). A: bright field images. B: oil Red staining (ORO) showing lipid droplets stained in red (magnification 200×). C: immunofluorescence images: EGFP (green) – actin cytoskeleton; DAPI (blue) – nuclei; AF555 (orange) – lipids (magnification 200×); Images for NCs are displayed in supplemental Fig. S1. D: the percentage of area stained with ORO for subsequent phases of adipogenic differentiation. E: the percentage of condensed-like, small-size nuclei for subsequent stages of the adipogenic differentiation in comparison to control cells.
Fig. 2
Fig. 2
Exemplary chemical maps showing the distribution of proteins (IR: 1651 cm−1), triacylglycerols (IR: 1742 cm−1), lipids (RS: 2853 cm−1), nucleic acids (RS: 790 cm−1), and cytochromes (RS: 756 cm−1) in the consecutive phases of AD-MSCs adipogenesis. The maps were constructed based on integral intensities of the marker IR and RS bands.
Fig. 3
Fig. 3
HCA dendrograms calculated for the second derivative FTIR spectra in the regions of 3050-2800 cm−1 and 1750-920 cm−1. Clustering of the adipogenesis phases at selected time points after its induction: (A) 2, 7, and 14 days; (B) 6 h, 2 and 7 days; (C) 6 h and 2 days with the corresponding negative controls (NC).
Fig. 4
Fig. 4
Averaged vibrational spectra from subsequent stages of adipogenic differentiation. A: second derivate FTIR spectra. B: Raman spectra – proteinaceous profile. C: Raman normal spectra – lipidic profile. Plots represent two spectral regions of 3050-1410 cm−1 (left) and 1400-700 cm−1 for RS and 1400-950 cm−1 for FTIR (right).
Fig. 5
Fig. 5
Box diagrams representing semi-quantitative analysis of biomolecules determined from the selected bands. Panel I. FTIR metrics: (A) shortening of acyl chains in fatty acids [(2989-2944 cm−1)/(2868-2837 cm−1)]; (B) triacylglycerols (1761-1727 cm−1); (C) acylation of fatty acids chains (1430-1410 cm−1); (D) alternation of secondary structures in proteins [(amide II/amide I; 1595-1482 cm−1)/(1708-1609 cm−1)], and (E) DNA (990-949 cm−1). Panel II. Raman metrics: (A) unsaturation of lipids [(1280-1250 cm−1)/(1320-1285 cm−1); (B) phospholipids (730-715 cm−1); (C) ratio of cross-linked and total phenylalanine amino acid residue [(1050-1026 cm−1)/(1020-994 cm−1)], and (D) cytochromes [(1595-1575 cm−1)+(1140-1120 cm−1)+(760-740 cm−1)]. (A) calculated from the RS spectra with the lipidic profile, (B), (C), and (D) calculated from the RS spectra with the proteinaceous profile.
Fig. 6
Fig. 6
The scores (left) and loadings (right) plots from Principal Component Analysis performed on (A), (B) FTIR spectra (3050-950 cm−1); (C) proteinaceous Raman spectra (1800-700 cm−1), and (D) lipidic RS spectra (3050-700 cm−1) collected from the investigated experimental groups of the differentiated AD-MSCs. Each point corresponds to a single spectrum.
Scheme 2
Scheme 2
The workflow of the developed IRRSmetrics4stem approach.

References

    1. Alenzi F.Q.B., Bahkali A.H. Stem cells: biology and clinical potential. Afr. J. Biotechnol. 2011;10:19929–19940.
    1. Chagastelles P.C., Nardi N.B. Biology of stem cells: an overview. Kidney Int. Suppl. (2011) 2011;1:63–67. - PMC - PubMed
    1. Saeedi P., Halabian R., Fooladi A.A.I. A revealing review of mesenchymal stem cells therapy, clinical perspectives and Modification strategies. Stem Cell Invest. 2019;6:34. - PMC - PubMed
    1. Keung E., Nelson P., Conrad C. Concise review: adipose-derived stem cells as a novel tool for future regenerative medicine. Stem Cells. 2013;30:804–810. - PubMed
    1. Han Y., Li X., Zhang Y., Han Y., Chang F., Ding J. Mesenchymal stem cells for regenerative medicine. Cells. 2013;8:886. - PMC - PubMed

Publication types

LinkOut - more resources