. 2024 Oct;17(5):825-842.
doi: 10.1016/j.mucimm.2024.05.007. Epub 2024 Jun 4.

Metabolically active neutrophils represent a permissive niche for Mycobacterium tuberculosis

Affiliations

Metabolically active neutrophils represent a permissive niche for Mycobacterium tuberculosis

J Tucker Andrews et al. Mucosal Immunol. 2024 Oct.

Abstract

Mycobacterium tuberculosis (Mtb)-infected neutrophils are often found in the airways of patients with active tuberculosis (TB), and excessive recruitment of neutrophils to the lung is linked to increased bacterial burden and aggravated pathology in TB. The basis for the permissiveness of neutrophils for Mtb and the ability to be pathogenic in TB has been elusive. Here, we identified metabolic and functional features of neutrophils that contribute to their permissiveness in Mtb infection. Using single-cell metabolic and transcriptional analyses, we found that neutrophils in the Mtb-infected lung displayed elevated mitochondrial metabolism, which was largely attributed to the induction of activated neutrophils with enhanced metabolic activities. The activated neutrophil subpopulation was also identified in the lung granulomas from Mtb-infected non-human primates. Functionally, activated neutrophils harbored more viable bacteria and displayed enhanced lipid uptake and accumulation. Surprisingly, we found that interferon-γ promoted the activation of lung neutrophils during Mtb infection. Lastly, perturbation of lipid uptake pathways selectively compromised Mtb survival in activated neutrophils. These findings suggest that neutrophil heterogeneity and metabolic diversity are key to their permissiveness for Mtb and that metabolic pathways in neutrophils represent potential host-directed therapeutics in TB.


Conflict of interest statement

DECLARATIONS OF COMPETING INTEREST

The authors have no competing interests to declare.

Figures

Fig. 1
Fig. 1
Metabolic profile of mouse lung phagocytes in Mtb infection using SCENITH. To profile the metabolic activities in lung phagocytes, lungs were harvested from C57BL/6 mice infected with 103 mCherry-Erdman Mtb intranasally at 3 weeks post-infection. (A) Translation level of lung phagocytes in Mtb-infected mice. Mean ± SEM are shown. n = 5. (B) Translation level of Mtb-infected and bystander lung phagocytes. n = 5. (C) Mitochondrial dependence, glycolytic capacity and glucose dependence of lung phagocytes in Mtb-infected mice obtained by SCENITH. Mean ± SEM are shown. n = 5. (D) Mitochondrial dependenceand glycolytic capacity of Mtb-infected and bystander lung phagocytes obtained by SCENITH. n = 8. Mean ± SEM are shown. n = 5. Data in A–C were representative of two independent experiments. Data in D were pooled from two independent experiments. Two-way ANOVA was used to test statistical significance in A and C. Paired t test was used in B and D. * p < 0.05, ** p < 0.01, *** p < 0.001, **** p < 0.0001. AM = alveolar macrophage; ANOVA = analysis of variance; Eos = eosinophil; IM = interstitial macrophage; Mono = monocyte; Mtb = Mycobacterium tuberculosis; SCENITH = single-cell energetic metabolism by profiling translation inhibition; SEM = standard error of the mean.
Fig. 2
Fig. 2
Neutrophils exhibit distinct metabolism from macrophages in Mtb infection in vitro. (A) OCR and ECAR of BMN at 6 hours post-Mtb infection at MOI = 5. (B) OCR and ECAR of (BMDM) at 6 hours post-Mtb infection at MOI = 5. Basal OCR, glycolysis and ECAR/OCR ratio were calculated. Mean ± SEM are shown. n = 3. (C) Intracellular cytokine expression from neutrophils in Mtb-infected mice at 3 weeks post-infection assessed by flow cytometry. Lung cells were treated ex vivo with PBS, 2-DG, oligomycin, or UK5099. Mean ± SEM are shown. n = 8. Data in A and B were representative of two independent experiments. Data in C were pooled from two independent experiments. Student’s t test was used in A, B, and C. * p < 0.05, ** p < 0.01, *** p < 0.001. 2-DG = 2-deoxyglucose; BMDM = bone marrow-derived macrophages; BMN = bone marrow neutrophils; ECAR = extracellular acidification rate; MOI = multiplicity of infection; Mtb = Mycobacterium tuberculosis; OCR = oxygen consumption rate; PBS = phosphate-buffered saline; SEM = standard error of the mean.
Fig. 3
Fig. 3
Neutrophils in Mtb-infected lung have a short lifespan that is long enough to support Mtb replication in vivo. To measure the turnover rate of neutrophils, mice were infected with 103 Erdman Mtb for 2 weeks. EdU was injected intraperitoneally on day 14 post-infection. (A) Percentages of EdU labeled total neutrophils (normalized to max.) in lungs, spleens, and blood of Mtb-infected mice at the indicated times after EdU injection, with the 90% confidence intervals shown in color together with the calculated half-lives (red numbers) in each tissue. The curves were calculated via nonlinear regression for the decay kinetics of EdU-labeled neutrophils. Data are from at least three mice per time point. (B) 3D confocal images of lung neutrophils sorted from SSB-GFP, symc’::mCherry Mtb-infected mice at 2 and 4 weeks. Representative images were shown. <scale bar = 10 μm>. (C) Percentage of Mtb displaying SSB-GFP foci in neutrophils sorted from SSB-GFP, symc’::mCherry Mtb-infected mice at 2 and 4 weeks. Each point represents one experiment with five mice. Horizontal bar indicates the mean of three or four pooled independent experiments. Data in A and B were representative of two independent experiments. Data in C were pooled from three or four independent experiments. Student’s t test was used in C. 3D = three-dimensional; EdU = 5-ethynyl-2’-deoxyurdine; GFP = green fluorescent protein; Mtb = Mycobacterium tuberculosis; SSB = single-stranded DNA-binding protein.
Fig. 4
Fig. 4
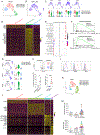
Heterogenous neutrophil populations identified by scRNA-seq in Mtb-infected mouse and NHP lungs. (A) UMAP plot displaying neutrophil clusters in the Mtb-infected mouse lung. (B) UMAP plot showing the expression level of ADT-Ly6G. (C) UMAP and violin plots showing expression of selected signature genes from the neutrophils in the Mtb-infected mouse lung. (D) Heat map of differential expression of marker genes in each mouse neutrophil cluster. (E) Pathway enrichment analysis of transcripts differentially expressed in Neutrophil_2 versus Neutrophil_1. (F) Gene set enrichment analysis of MDSC signatures and leukocyte activation in Neutrophil_1 and Neutrophil_2. NES, P. adj and false discovery rate (q value) are indicated. (G) UMAP and violin plots showing expression of ADT-CD64, H2-Ab1, and Nos2 in each neutrophil cluster. To measure CD64 expression in lung neutrophils, lungs were harvested from C57BL/6 mice infected with 103 Erdman Mtb after 3 weeks. (H) Flow cytometry analysis of CD64 expression in lung neutrophils from uninfected and Erdman Mtb-infected mice at 3 weeks post-infection. (I) Flow cytometry analysis pro-IL-1β, MHCII, and iNOS expression for lung CD64+ and CD64− neutrophils in Erdman Mtb-infected mice at 3 weeks post-infection. (J) CD64 expression and MHCII MFI in CD64− and CD64+ neutrophils in mice infected with 103 H37Rv Mtb at 4 weeks post aerosol infection. (K) UMAP plot displaying neutrophil clusters in the Mtb-infected NHP lung. (L) Heat map of differential expression of marker genes in each NHP neutrophil cluster. (M) Quantification of CD64 expression in neutrophils across tissues from six non-human primates. Each marker indicates one sample of peripheral blood, uninvolved (granuloma-free) lung, or a lung granuloma and each color represents a different animal. Blood was not available from one animal and the samples of uninvolved lung from four animals had insufficient numbers of neutrophils for analysis, thus data was not included for these animals. Data in H, I and J were representative of two independent experiments. n = 2–5. Student’s t test was used in J. * p < 0.05, *** p < 0.001. CD = cluster of differentiation; IL = interleukin; iNOS = inducible nitric oxide synthase; MDSC = myeloid-derived suppressor cells; MFI = mean fluorescence intensity; MHC = major histocompatibility complex; Mtb = Mycobacterium tuberculosis; NES = normalized enrichment score; NHP = non-human primates; scRNA = single-cell ribonucleic acid; UMAP = uniform manifold approximation and projection.
Fig. 5
Fig. 5
CD64+ neutrophils in the Mtb-infected lung are metabolically active. To characterize the metabolic activities in CD64+ and CD64− neutrophils, lungs were harvested from C57BL/6 mice 3 weeks after intranasal infection with 103 mCherry-Erdman Mtb. (A–B) Translation level (A) and mitochondrial dependence (B) were measured by SCENITH in CD64− and CD64+ neutrophils. (C–D) MFI of MitoTracker Deep Red staining (C) and Bodipy 493/503 staining (D) measured by flow cytometry in CD64− and CD64+ neutrophils. The linked dots represent CD64− and CD64+ neutrophils from the same mouse. (E) Percentages of EdU labeled CD64− and CD64+ neutrophils (normalized to max.) in lungs of Mtb-infected mice at the indicated times after EdU injection, with the 90% confidence intervals shown in gray together with the calculated half-lives. The curves were calculated via nonlinear regression for the decay kinetics of EdU-labeled neutrophils. Data are from at least three mice per time point. (F–G) ECAR (F) and OCR (G) of sorted total CD64− and CD64+ neutrophils purified from Mtb-infected mice. Glycolysis, glycolytic capacity, basal and max OCR, and SRC were calculated. Mean ± SEM are shown. n = 3. (H) UMAP displaying signature scores of glycolysis and oxidative phosphorylation in each mouse neutrophil cluster. (I) The expression of metabolic targets in CD64+ and CD64− neutrophils. The linked dots represent CD64− and CD64+ neutrophils from the same mouse. Data in A–G were representative of at least two independent experiments. Data in I were pooled from two independent experiments. Paired t test was used in A–D and I. Student’s t test was used in F and G. * p < 0.05, ** p < 0.01, *** p < 0.001, **** p < 0.0001. CD = cluster of differentiation; ECAR = extracellular acidification rate; EdU = 5-ethynyl-2’-deoxyurdine; MFI = mean fluorescence intensity; Mtb = Mycobacterium tuberculosis; OCR = oxygen consumption rate; SCENITH = single-cell energetic metabolism by profiling translation inhibition; SEM = standard error of the mean; SRC = spare respiratory capacity; UMAP = uniform manifold approximation and projection.
Fig. 6
Fig. 6
IFNγ promotes the generation of CD64+ neutrophils in Mtb infection. (A, B) MFI of CD64 (A) and Bodipy 493/503 (B) were measured in bone marrow neutrophils under various conditions by flow cytometry. BMN were infected with or without Mtb (MOI = 5) in the presence or absence of IFNγ. Mean ± SEM are shown. n = 5. To investigate the impact of IFNγ on CD64+ neutrophils, lungs were harvested from WT and IFNγ KO mice 2 weeks after infection with 103 Erdman Mtb. (C) ECAR and (D) MFI of MHCII of BMNs at 6 hours post-Mtb infection at MOI 5, with or without IFNγ (100 ng/mL). n = 4. (E, F) The numbers of total neutrophils (E) and CD64+ neutrophils (F) in Mtb-infected WT and IFNγ KO mice. Mean ± SEM are shown. n = 8. Data in A and B were representative of at least two independent experiments. Data in C–F were pooled from two independent experiments. Student’s t test was used in C–F. One-way ANOVA was used in A and B. * p < 0.05, ** p < 0.01, *** p < 0.001. ANOVA = analysis of variance; BMN = bone marrow neutrophils; CD = cluster of differentiation; ECAR = extracellular acidification rate; IFN = interferon; KO = knockout; MFI = mean fluorescence intensity; MHC = major histocompatibility complex; MOI = multiplicity of infection; Mtb = Mycobacterium tuberculosis; SEM = standard error of the mean; WT = wild-type.
Fig. 7
Fig. 7
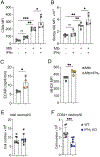
Perturbation of lipid uptake selectively decreases Mtb burden in CD64+ neutrophils. (A) MFI of mCherry and CFU in CD64− and CD64+ neutrophils sorted from the mouse lung after 2 weeks of infection with 103 mCherry-Mtb. n = 8. (B) Phagocytosis in CD64− and CD64+ neutrophils from the mouse lung after 2 weeks of infection with 103 mCherry-Mtb. n = 4. (C) Percentage of Mtb displaying SSB-GFP foci in neutrophils. Each dot represents one experiment with five mice. Neutrophils were sorted from the mouse lung after 2 weeks of infection with 103 SSB-GFP, smyc’::mCherry Mtb. Horizontal bars indicate the mean of three pooled independent experiments. (D–E) Flow cytometry analysis of BODIPY FL C16 (C) and expression of CD36 (D) in CD64− and CD64+ neutrophils from the mouse lung after 2 weeks of infection with 103 mCherry-Mtb. n = 3 or 4. (F) MFI of BODIPY FL C16 in neutrophils from Mtb-infected WT and CD36KO mice at 2 weeks post-infection. Mean ± SD are shown. n = 3. (G) Flow cytometry analysis of percentage of IFNγ in CD4+ T cells in the lung of Mtb-infected WT and CD36KO mice at 2 weeks post-infection. Mean ± SD are shown. n = 3. (H–I) MFI of mCherry and CFU from CD64− neutrophils (H) and CD64+ neutrophils (I) in mCherry-Mtb infected WT and CD36KO mice at 2 weeks post-infection. Mean ± SD are shown. n = 4. (J) Flow cytometry analysis of Bodipy 493/503 staining in Mtb-infected WT or CD36KO bone marrow neutrophils at 6 hours post-infection at MOI 5. n = 5. (K) Flow cytometry analysis of Bodipy 493/503 staining in CD64+ neutrophils treated with or without 100 μM SSO for 2 hours. Lungs were harvested from Mtb-infected WT mice at 2 weeks post-infection. Data in A were pooled from two independent experiments. Data in B, D–K were representative of two independent experiments. F and G were from the same experiment. H and I were from the same experiment. Paired t test was used in A, B, D, E and K. Student’s t test was used in C, F–J. * p < 0.05, ** p < 0.01. CD = cluster of differentiation; CFU = colony-forming unit; GFP = green fluorescent protein; IFN = interferon; MFI = mean fluorescence intensity; Mtb = Mycobacterium tuberculosis; SD = standard deviation; SSB = single-stranded DNA-binding protein; SSO = sulfosuccinimidyl oleate; WT = wild-type.

Similar articles

Cited by

References

    1. Cohen SB et al. Alveolar macrophages provide an early Mycobacterium tuberculosis Niche and initiate dissemination. Cell Host Microbe 24, 439–446. e4 (2018). - PMC - PubMed
    1. Huang L, Nazarova EV, Tan S, Liu Y & Russell DG Growth of Mycobacterium tuberculosis in vivo segregates with host macrophage metabolism and ontogeny. J. Exp. Med 215, 1135–1152 (2018). - PMC - PubMed
    1. Mendonca LE et al. Human alveolar macrophage metabolism is compromised during Mycobacterium tuberculosis infection. Front. Immunol 13:1044592. - PMC - PubMed
    1. Ryndak MB & Laal S Mycobacterium tuberculosis primary infection and dissemination: a critical role for alveolar epithelial cells. Front. Cell Infect. Microbiol 9, 299 (2019). - PMC - PubMed
    1. Kinhikar AG et al. Potential role for ESAT6 in dissemination of M. tuberculosis via human lung epithelial cells. Mol. Microbiol 75, 92–106 (2010). - PMC - PubMed

MeSH terms

Substances

LinkOut - more resources