. 2024 Aug 7;44(32):e1306232024.
doi: 10.1523/JNEUROSCI.1306-23.2024.

Cerebral Gray Matter May Not Explain Sleep Slow-Wave Characteristics after Severe Brain Injury

Affiliations

Cerebral Gray Matter May Not Explain Sleep Slow-Wave Characteristics after Severe Brain Injury

Narges Kalantari et al. J Neurosci. .

Abstract

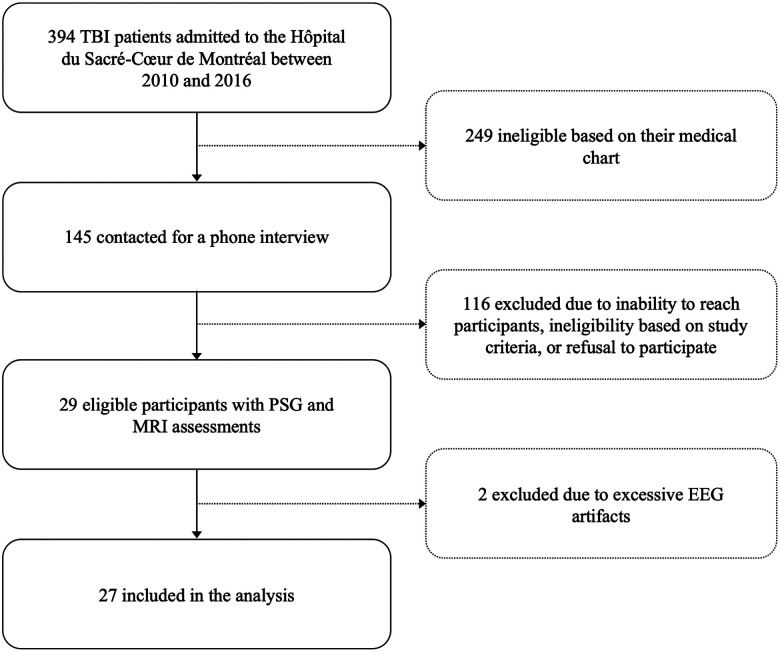
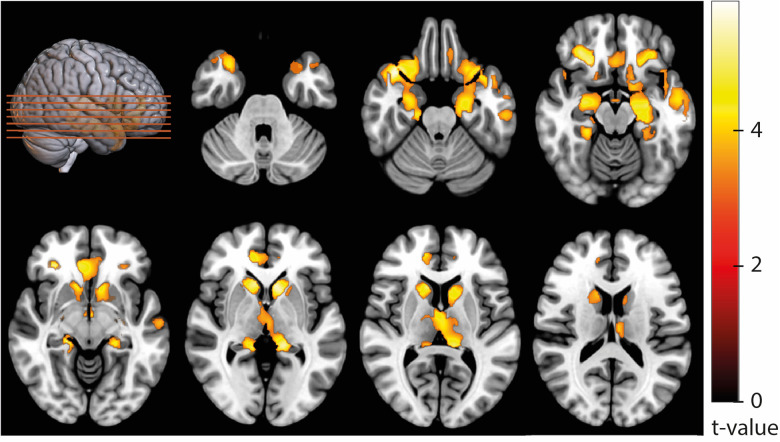
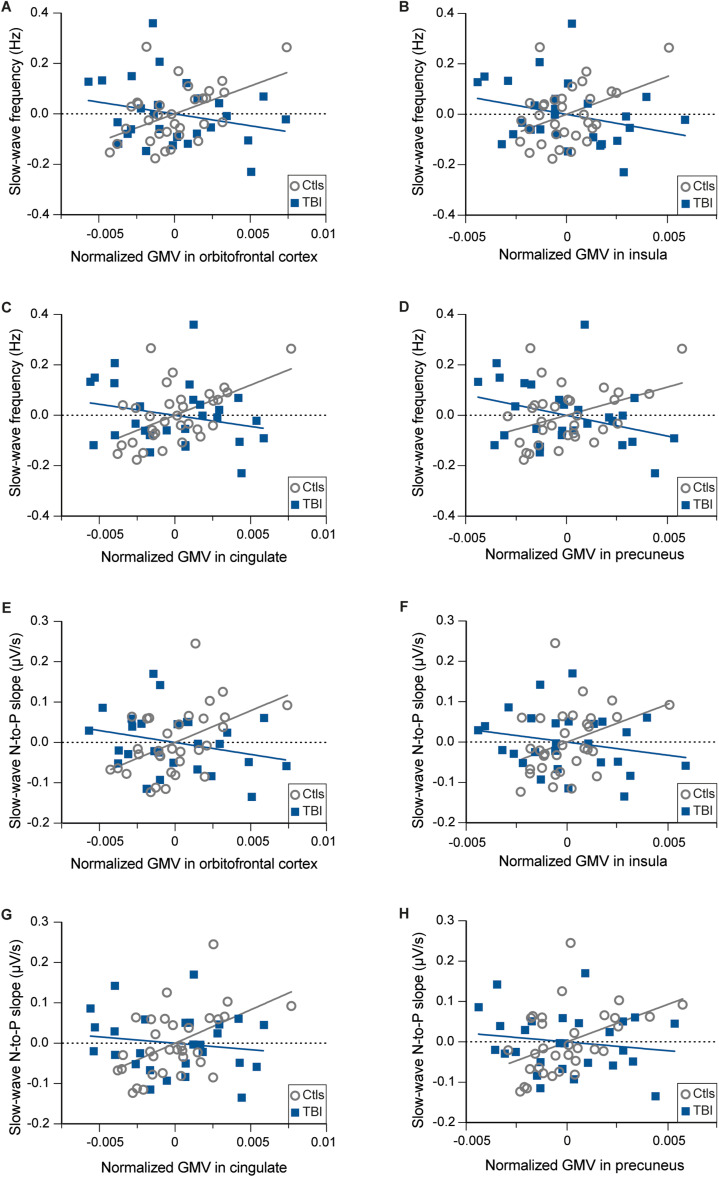
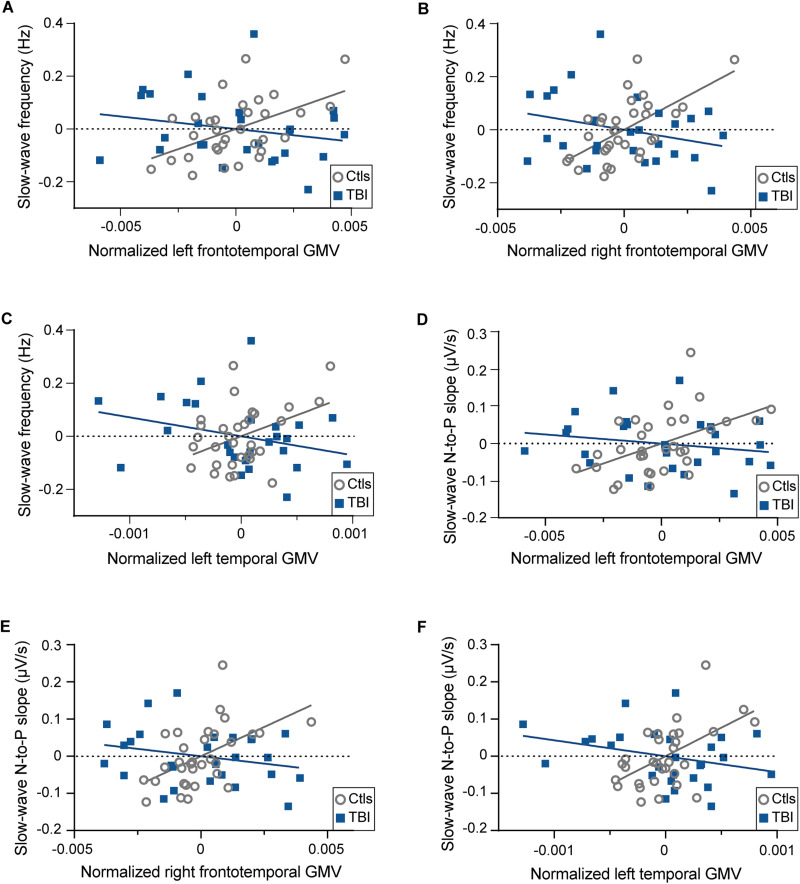
Sleep slow waves are the hallmark of deeper non-rapid eye movement sleep. It is generally assumed that gray matter properties predict slow-wave density, morphology, and spectral power in healthy adults. Here, we tested the association between gray matter volume (GMV) and slow-wave characteristics in 27 patients with moderate-to-severe traumatic brain injury (TBI, 32.0 ± 12.2 years old, eight women) and compared that with 32 healthy controls (29.2 ± 11.5 years old, nine women). Participants underwent overnight polysomnography and cerebral MRI with a 3 Tesla scanner. A whole-brain voxel-wise analysis was performed to compare GMV between groups. Slow-wave density, morphology, and spectral power (0.4-6 Hz) were computed, and GMV was extracted from the thalamus, cingulate, insula, precuneus, and orbitofrontal cortex to test the relationship between slow waves and gray matter in regions implicated in the generation and/or propagation of slow waves. Compared with controls, TBI patients had significantly lower frontal and temporal GMV and exhibited a subtle decrease in slow-wave frequency. Moreover, higher GMV in the orbitofrontal cortex, insula, cingulate cortex, and precuneus was associated with higher slow-wave frequency and slope, but only in healthy controls. Higher orbitofrontal GMV was also associated with higher slow-wave density in healthy participants. While we observed the expected associations between GMV and slow-wave characteristics in healthy controls, no such associations were observed in the TBI group despite lower GMV. This finding challenges the presumed role of GMV in slow-wave generation and morphology.

Keywords: electroencephalography; gray matter atrophy; region-of-interest analysis; sleep slow waves; traumatic brain injury.


Conflict of interest statement

The authors declare no competing financial interests.

Figures

Figure 1.
Figure 1.
A flow diagram of patient recruitment.
Figure 2.
Figure 2.
SPM clusters with lower GMV in TBI subjects relative to healthy controls. Voxel-wise maps depicting regions where GMV was significantly smaller in TBI as compared with that in control participants. Significant clusters are overlayed on the MNI152 T1 template. Only slices with significant volume differences between TBI and controls are depicted.
Figure 3.
Figure 3.
Associations between GMV and slow-wave frequency and slope in TBI and healthy control participants. The graphs depict residual scatterplots, adjusted for the effect of age, for the association between ROI GMVs and slow-wave frequency (panels AD) and negative-to-positive slope (panels EH) for healthy controls and TBI participants. GMVs were normalized against the total intracranial volume (GMV in mm3 / TIV * 1,000).
Figure 4.
Figure 4.
Associations between GMVs identified through whole-brain analysis, wherein GMV was significantly lower in TBI compared with that in healthy participants, and slow-wave frequency and slope in TBI and healthy controls. The graphs depict residual scatterplots, adjusted for the effect of age, for the association between GMVs and slow-wave frequency (panels AC) and negative-to-positive slope (panels DF) for healthy controls and TBI participants. GMVs were normalized against the total intracranial volume (GMV in mm3 / TIV * 1,000).

Similar articles

References

    1. Aeschbach D, Borbély AA (1993) All-night dynamics of the human sleep EEG. J Sleep Res 2:70–81. 10.1111/j.1365-2869.1993.tb00065.x - DOI - PubMed
    1. Ashburner J (2007) A fast diffeomorphic image registration algorithm. Neuroimage 38:95–113. 10.1016/j.neuroimage.2007.07.007 - DOI - PubMed
    1. Ashburner J, Friston KJ (2000) Voxel-based morphometry–the methods. Neuroimage 11:805–821. 10.1006/nimg.2000.0582 - DOI - PubMed
    1. Bachmann V, Klein C, Bodenmann S, Schäfer N, Berger W, Brugger P, Landolt HP (2012) The BDNF Val66Met polymorphism modulates sleep intensity: EEG frequency- and state-specificity. Sleep 35:335–344. 10.5665/sleep.1690 - DOI - PMC - PubMed
    1. Baracchi F, Opp MR (2008) Sleep-wake behavior and responses to sleep deprivation of mice lacking both interleukin-1 beta receptor 1 and tumor necrosis factor-alpha receptor 1. Brain Behav Immun 22:982–993. 10.1016/j.bbi.2008.02.001 - DOI - PMC - PubMed

MeSH terms

LinkOut - more resources