. 2024 Jun 6;15(1):4829.
doi: 10.1038/s41467-024-49206-z.

Development and organization of the retinal orientation selectivity map

Affiliations

Development and organization of the retinal orientation selectivity map

Dominic J Vita et al. Nat Commun. .

Abstract

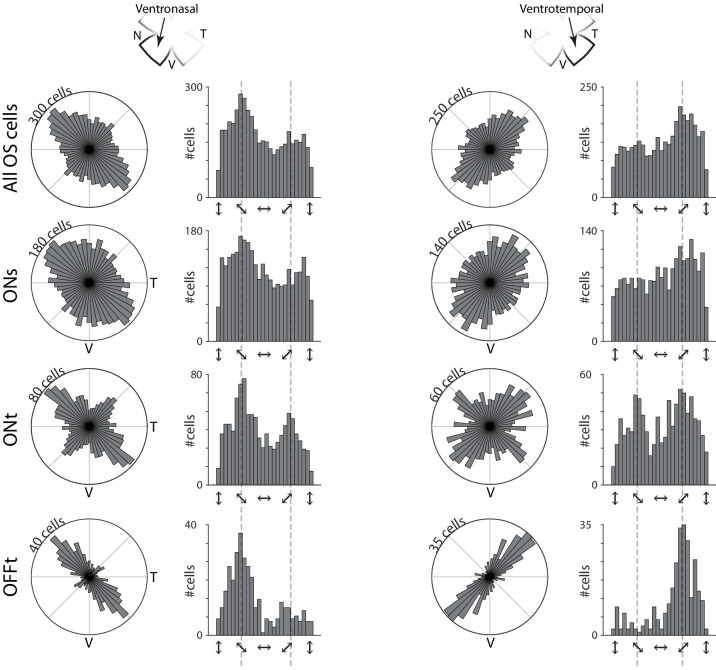
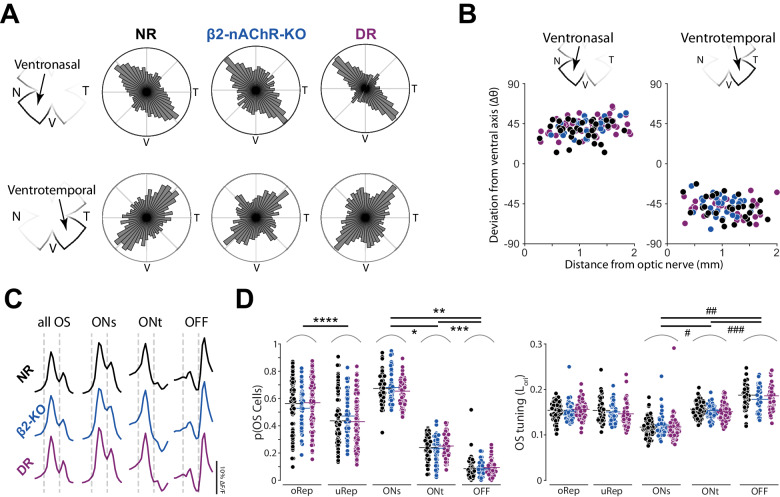
Orientation or axial selectivity, the property of neurons in the visual system to respond preferentially to certain angles of visual stimuli, plays a pivotal role in our understanding of visual perception and information processing. This computation is performed as early as the retina, and although much work has established the cellular mechanisms of retinal orientation selectivity, how this computation is organized across the retina is unknown. Using a large dataset collected across the mouse retina, we demonstrate functional organization rules of retinal orientation selectivity. First, we identify three major functional classes of retinal cells that are orientation selective and match previous descriptions. Second, we show that one orientation is predominantly represented in the retina and that this predominant orientation changes as a function of retinal location. Third, we demonstrate that neural activity plays little role on the organization of retinal orientation selectivity. Lastly, we use in silico modeling followed by validation experiments to demonstrate that the overrepresented orientation aligns along concentric axes. These results demonstrate that, similar to direction selectivity, orientation selectivity is organized in a functional map as early as the retina.


Conflict of interest statement

The authors declare no competing interests.

Figures

Fig. 1
Fig. 1. The mouse retina has three major functional groups of orientation selective neurons.
A Schematic of ventronasal and ventrotemporal retina demonstrating the location of each imaging field of view (FOV). Each FOV (data points on panel) is 425 × 425 µm2 and consists of 590 ± 170 segmented neurons (avg ± stdev). T temporal, N nasal, V ventral. B Average projection of an example FOV and the results of a semiautomatic pipeline to segregate individual neurons. C Heatmap showing orientation selectivity tuning (Lori) vs. direction selectivity tuning (Ldir) of all statistically significantly orientation-selective (OS) and direction-selective (DS) neurons in all FOVs. See “Methods” for detailed description of tuning calculations. D Heatmap showing the responses of all OS cells in both ventronasal and ventrotemporal retina, sorted based on their preferred orientation and functional subtypes (ONs: ONsustained, ONt: ONtransient, and OFF). E Average response to light onset and offset for each of the 3 subtypes (ONs, ONt, and OFF). The gray trace is the average response of the entire OS population. F Left: tuning curves of average peak response for each of the 3 functional OS subtypes in ventrotemporal retina. Right: average response for each of the 3 functional OS subtypes. Top traces: ONs, middle trace: ONt, bottom trace: OFF. G Proportion of OS subtypes among all OS cells only. Each data point represents the proportion of a cell’s subtype within one FOV (N = 67 FOVs). *p = 1.3 × 10−73, **p = 4.2 × 10−96, ***p = 4.2 × 10−20. H Same as (E) but comparing tuning strength (Lori) of all OS subtypes and the non-OS cells. Each data point represents the average of a subtype’s tuning strength within one FOV (N = 67 FOVs). The “notOS” distribution depicts the tuning strength of all cells that were not statistically significantly OS. *p = 1.6 × 10−17, **p = 1.3 × 10−34, ***p = 5.5 × 10−10, one way ANOVA followed by two-tailed Tukey test. Source data are provided as a Source Data file.
Fig. 2
Fig. 2. Organization of orientation selectivity changes as a function of retinal location.
Polar and linear histograms depicting the distributions of preferred orientations in ventronasal (left column) and ventrotemporal (right column) retina for all orientation-selective (OS) cells (top row), ON sustained cells (2nd row), ON transient cells (3rd row), and OFF transient cells (4th row).
Fig. 3
Fig. 3. Organization and tuning of retinal orientation selectivity are unaffected in mouse models of reduced retinal waves or visual deprivation.
A Polar histograms showing organization of Orientation Selectivity (OS) in ventronasal (top row) and ventrotemporal (bottom row) retina in normal reared (NR) mice, β2-nAChR-KO mice, and dark-reared (DR) mice. B Preferred orientation of the overrepresented orientations as a function of distance from the optic nerve in ventronasal (left) and ventrotemporal (right) retina across experimental conditions (n = 36 VN and 31 VT FOVs for NR, 27 VN and 28 VT FOVs for β2-KO, 46 VN and 35 VT FOVs for DR). C Average ΔF/F response to all moving bars for, from left to right, all OS, ONs, ONt, or OFF OS cells. D Proportion (left) and tuning (right) of OS subtypes based on their preferred orientation (oRep overrepresented orientation, uRep underrepresented orientation) or response to light onset/offset across experimental conditions. N = 7760 OS cells for NR, 5464 OS cells for β2-KO, and 10,928 OS cells for DR. *p = 4.3 × 10−32, **p = 4.5 × 10−267, ***p = 5.8 × 10−176, ****p = 5.5 × 10−12, #p = 6.1 × 10−27, ##p = 6.6 × 10−109, ###p = 8.4 × 10−42. Three factor ANOVA followed by two-tailed Tukey test. Source data are provided as a Source Data file.
Fig. 4
Fig. 4. The retinal orientation selectivity map is organized along concentric axes.
A Polar histograms showing organization of Direction Selectivity (DS, green) and Orientation Selectivity (OS, magenta) in ventronasal and ventrotemporal retina. B Angle deviation of the preferred direction for DS cells (green) and orientation for OS cells (magenta) from the ventral cardinal axis as a function of how far the FOV is from the optic nerve in ventronasal (left) and ventrotemporal (right) retina. C In silico modeling of how OS preferred axes map based on concentric circles anchored on the optic nerve (top left), dorsal retina (bottom left), and ventral retina (top right). The bottom right plot is a model of concentric ellipses anchored in ventronasal retina, which outputs predicted lines that deviate the least from the actual data. Red lines are the simulated preferred orientation axes, black data are the measured preferred orientations based on RGC location, and black lines are fits to experimental data. Red shading represents area between the two fits. D Left: schematic demonstrating analysis of preferred orientation of OS cells around the ventronasal and ventrotemporal axis to test predictions from the model in (C). FOVs closer to ventral retina (yellow) exhibit more positive-deviating preferred orientations from the ventronasal/ventrotemporal axis, whereas FOVs away from ventral retina (blue) exhibit more negative deviating preferred orientations from the ventronasal/ventrotemporal axis. Right: histogram and cumulative distribution of preferred orientations from more and less ventral FOVs. Less ventral FOVs exhibit statistically more negative deviating preferred orientations and statistically less positive deviating preferred orientations than more ventral FOVs. *KS test and permutation test reveal that the distributions are statistically significantly distinct. E Polar and linear histograms depicting distribution of preferred orientations in ventral (top) and temporal (bottom) retina. F Vector flow field of preferred orientations in ventral retina. G Polar and linear histograms depicting distribution of preferred orientations in temporal retina separated for fields of view that are either more dorsal (yellow) or more ventral (blue).

Update of

Similar articles

Cited by

References

    1. Kerschensteiner, D. Feature detection by retinal ganglion cells. Annu. Rev. Vis. Sci.8, 135–169 (2022). - PubMed
    1. Baden, T., Euler, T. & Berens, P. Understanding the retinal basis of vision across species. Nat. Rev. Neurosci. 21, 5–20 (2020). - PubMed
    1. Sabbah S, et al. A retinal code for motion along the gravitational and body axes. Nature. 2017;546:492–497. doi: 10.1038/nature22818. - DOI - PMC - PubMed
    1. Tiriac A, Bistrong K, Pitcher MN, Tworig JM, Feller MB. The influence of spontaneous and visual activity on the development of direction selectivity maps in mouse retina. Cell Rep. 2022;38:110225. doi: 10.1016/j.celrep.2021.110225. - DOI - PMC - PubMed
    1. Heukamp AS, Warwick RA, Rivlin-Etzion M. Topographic variations in retinal encoding of visual space. Annu. Rev. Vis. Sci. 2020;6:237–259. doi: 10.1146/annurev-vision-121219-081831. - DOI - PubMed