. 2024 Jun 6;15(1):4855.
doi: 10.1038/s41467-024-49219-8.

Genetic determinants of host- and virus-derived insertions for hepatitis E virus replication

Affiliations

Genetic determinants of host- and virus-derived insertions for hepatitis E virus replication

Michael Hermann Wißing et al. Nat Commun. .

Abstract

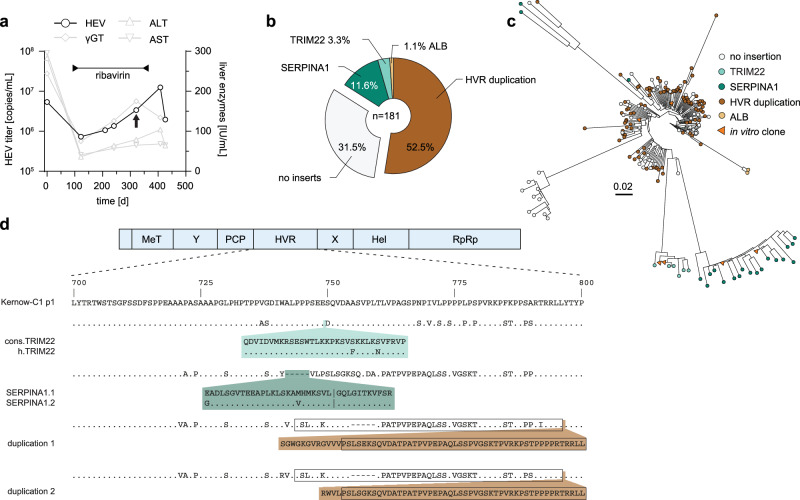
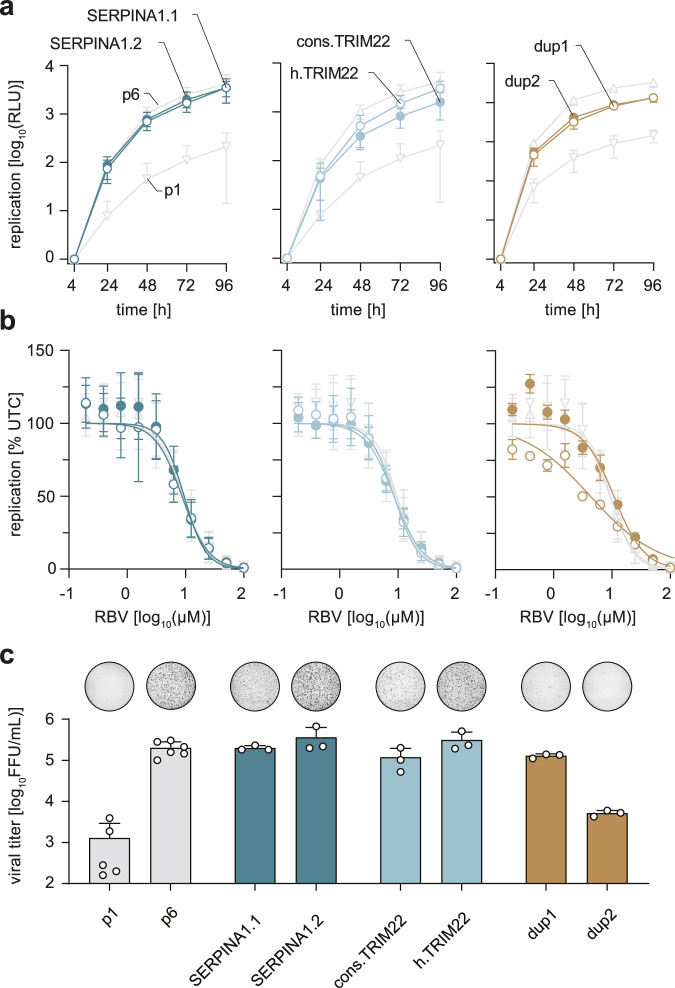
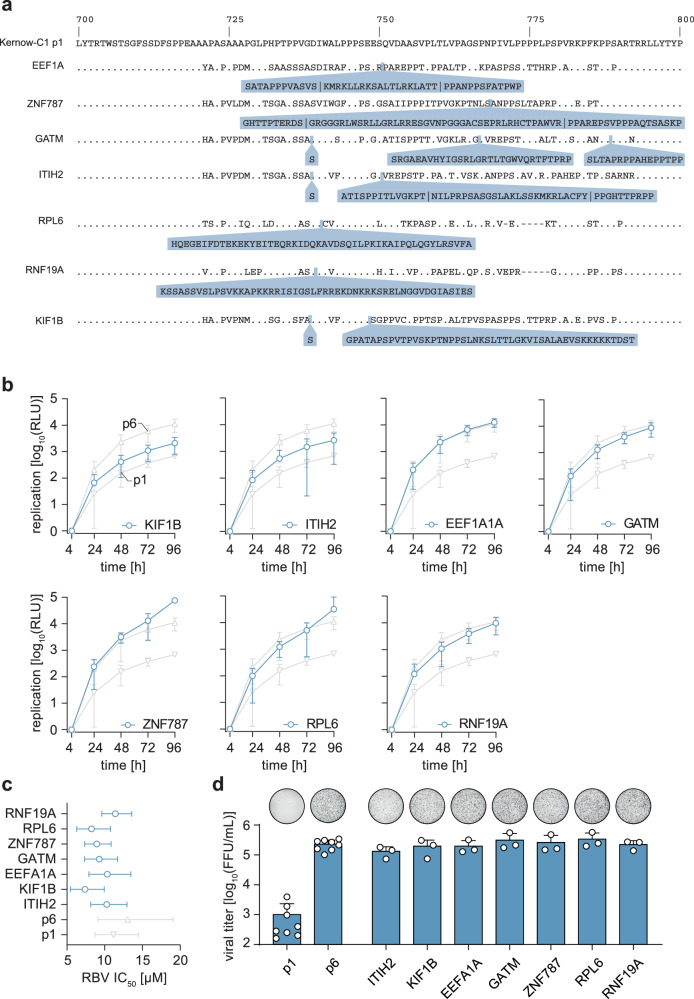
Hepatitis E virus (HEV) is a long-neglected RNA virus and the major causative agent of acute viral hepatitis in humans. Recent data suggest that HEV has a very heterogeneous hypervariable region (HVR), which can tolerate major genomic rearrangements. In this study, we identify insertions of previously undescribed sequence snippets in serum samples of a ribavirin treatment failure patient. These insertions increase viral replication while not affecting sensitivity towards ribavirin in a subgenomic replicon assay. All insertions contain a predicted nuclear localization sequence and alanine scanning mutagenesis of lysine residues in the HVR influences viral replication. Sequential replacement of lysine residues additionally alters intracellular localization in a fluorescence dye-coupled construct. Furthermore, distinct sequence patterns outside the HVR are identified as viral determinants that recapitulate the enhancing effect. In conclusion, patient-derived insertions can increase HEV replication and synergistically acting viral determinants in and outside the HVR are described. These results will help to understand the underlying principles of viral adaptation by viral- and host-sequence snatching during the clinical course of infection.


Conflict of interest statement

The authors declare no competing interests.

Figures

Fig. 1
Fig. 1. HVR insertions in a HEV patient identified by clonal sequencing.
a The treatment course of a chronically HEV-infected solid organ recipient is shown. The solid black line indicates the viral titer as copies/mL, while the grey lines visualize the liver enzyme levels IU/mL. The treatment period with ribavirin is indicated by the bar above. The arrow highlights the time point used for clonal sequencing. b The distribution of HVR rearrangements identified in HEV-positive colonies is shown. Depicted is the origin of inserted sequences (genes TRIM22, SERPINA1, and HEV HVR duplication) and their frequency as a percentage. Source data are provided in the Source Data file. c Maximum likelihood tree of amplicon-based clonal sequencing derived variants. Insertion-carrying clones are depicted in cyan (TRIM22), green (SERPINA1), and brown (duplication). Sequences of engineered in vitro clones representing respective clusters are depicted as orange triangles. The scale bar indicates the average number of substitutions per site. d The insertion site as well as their similarity (dots) to the strain Kernow-C1-p1 are shown. Mismatches to the reference are indicated by the used amino acid as a single letter code. The inserted amino acid sequence is indicated below. The name of the constructs is indicated in front of each row. Black boxes refer to duplicated sequence snippets.
Fig. 2
Fig. 2. In-vitro characterization of HVR sequences identified by clonal sequencing.
The identified insertions were cloned into the HEV reporter or full genome of the Kernow-C1-p6 strain, thereby replacing the HVR with insertion containing HVRs as indicated in Fig. 1. a Replication kinetics of HVR constructs with Kernow-C1-p6 (p6) and Kernow-C1-p1 (p1) as references are shown. Plotted is the time post electroporation as well as mean (+/- SD) relative light units (RLU) normalized to the four-hour value of n = 7 biologically independent experiments for p1 h.TRIM22, n = 3 for dup constructs and n = 6 for other constructs. b The HEV replicon system was used to analyse the ribavirin (RBV) sensitivity by treating the cells for five days post-electroporation with RBV concentrations ranging from 0.19 µM to 100 µM. Plotted is the mean (+/- SD) HEV replication as a percentage of untreated controls in n = 3 biologically independent experiments for dup constructs, n = 6 for other constructs. Lines represent dose-response curves of four-parameter log-logistic analysis. c The full-length system was used to produce infectious particles, which were titrated onto HepG2/C3A cells to determine the achieved viral titers as FFU/mL via immunofluorescence. A representative picture of a whole 96-well infected with non-enveloped HEVcc stained for the ORF2 protein (black) is shown above each column. Plotted are the means with standard deviation (+/- SD) of n = 8 biologically independent experiments for p1 and p6, n = 3 for other constructs. Source data are provided in the Source Data file.
Fig. 3
Fig. 3. In-vitro analysis of publicly available insertions.
a The insertions reported by Lhomme et al. were analysed for their insertion site in relation to the strain Kernow-C1-p1. The insertion site as well as their similarity (dots) to the strain Kernow-C1-p1 are shown. Mismatches to the reference are indicated by the used amino acid as a single letter code. The inserted amino acid sequence is indicated in blue. The name of created constructs is mentioned in front of each row. b The replicon system was used to determine their impact on replication versus the reference strain Kernow-C1-p6 (p6) and Kernow-C1-p1 (p1). Plotted is the time post-electroporation as well as the mean (+/- SD) relative light units (RLU) normalized to the four-hour value of n = 4 biologically independent experiments for p1, n = 5 for other constructs. c The replicon was used to analyse the ribavirin (RBV) sensitivity by treating the cells for five days post-electroporation with RBV concentrations ranging from 0.19 µM to 100 µM. A non-linear regression and the IC50 values were calculated using GraphPad Prism. Depicted are the respective IC50 values and confidence intervals (CI 95%) of n = 3 biologically independent experiments. d The HEV full-length system was used to produce infectious particles, which were titrated onto HepG2/C3A cells to determine viral titers as FFU/mL via immunofluorescence. A representative picture of a whole 96-well infected with non-enveloped HEVcc stained for the ORF2 protein (black) is shown above each column. Plotted are the means with standard deviation (+/- SD) as well as individual data points (circle) of n = 6 biologically independent experiments for p1 and p6, n = 3 for other constructs. Source data are provided in the Source Data file.
Fig. 4
Fig. 4. In-silico analysis of HEV insertion containing HVRs.
a The liver cell atlas was used to analyse the expression values of identified insertions in various liver cell types on a single cell level. The frequency of cells expressing the gene is depicted by the size of the dot, while the colour of the dot encodes the average expression level according to Guilliams et al. in those cells. b,c Expression of transcripts encoding the insertions was analysed in a published data set of non-infected as well as Kernow-C1-p6 infected primary human hepatocytes (PHH). Depicted is the expression as RPKM values over time for all genes. d Differential expression of indexed transcripts in a data set of PHH treated with PBS (control) or interferon-α (IFNα). The solid black line indicates no regulatory effect, while the dashed lines indicate 4-fold up or down-regulation in either condition. e HVR amino acid sequences were analysed for post-translational modification via musite, for ubiquitination via BDM-PUB, and for acetylation via GPS-Pail. The number of predicted PTM sites is plotted as a heatmap. Kernow-C1-p1 (p1) and Kernow-C1-p6 (p6) were used as reference. f Amino acid composition of insertion containing HVRs (n = 15 sequences examined) was compared to HEV-GLUE deposited HVRs without insertions (n = 289 sequences examined) using the tool composition profiler. Shown are fold changes in amino acid usage of insertion containing HVRs over non-insertion containing HVRs. Positive-charged amino acids are indicated in red, while negatively charged ones are highlighted in blue. The statistical significance associated with a specific enrichment or depletion is estimated using a Bonferroni-corrected two-sample t-test between two sequences of binary indicator variables, one sequence for each of the samples (I p-value = 0.001988 (≤0.0025), K p-value = 0.0 (≤0.0025)). For the calculation of composition differences, 10,000 bootstrap iterations were used for non-parametric estimation of the confidence intervals for the reported amino acid compositions. Source data are provided in the Source Data file.
Fig. 5
Fig. 5. Nuclear localization signals as a common pattern of HVR insertions.
a The insertion containing HVRs was analysed for the presence of NLS sequences or predicted nuclear localization by using the tools NLS Mapper (score normalized to 0 to 1). NucPred (Score 0 to 1), NLSTradamus (score 0 or 1) and Prosite (score 0 or 1). b Amino acid sequence of the RPS17 insertion from the Kernow-C1-p6 strain is shown. Alanine scanning mutagenesis was used to disrupt the NLS sequence. The generated constructs are shown in the alignment, Green areas above amino acids indicate codons. c, e The replicon system were used to analyse the impact of NLS mutants on the replication capacity of the Kernow-C1-p6 (p6) strain over time. Kernow-C1-p1 (p1) and p6 (grey triangles) were included as references while constructs of interest are depicted in green. Plotted are mean (+/- SD) relative light units (RLU) of n = 3 biologically independent experiments for construct j, n = 4 for other constructs, normalized to the four-hour value. d, f Respective 96-hour replication values are depicted as a column diagram. g The full-length system was used to validate the impact of the NLS mutants on the virus production. A representative picture of a whole 96-well infected with non-enveloped HEVcc stained for the ORF2 protein (black) is shown above each column. Plotted are the means with standard deviation (+/- SD) of n = 8 biologically independent experiments for p1 and p6, n = 3 for other constructs. h Huh7 cells were transfected with plasmids encoding a triple eYFP alone (control) or in tandem with the HVRs of indicated constructs. The cells were fixed after 16-20 hours and mean fluorescence intensity (MFI) for eYFP was assessed for each compartment. See Supplementary. Movies 4–13. i The eYFP MFI was measured for each compartment for n = 11 cells per construct, individual outliers was removed applying ROUT (Q = 1) method implemented in GraphPad Prism. Depicted is the range of individual data points as violin plots with straight lines as median and dashed lines as quartiles. Source data are provided in Source Data file.
Fig. 6
Fig. 6. Characterization of generated artificial insertions in the HEV HVR.
a Two types of artificial insertions were created and cloned in the Kernow-C1-p1 (p1) and Kernow-C1-p6 (p6) reporter replicon. A rigid XP linker, mimicking the high proline content of the HVR and one with a more flexible linker. Additionally, NLS sequences (IPMK, IP3KB, SHIP1, SV40) were incorporated in the middle of the artificial insertions. See Supplementary Movies 14–17. b HEV replication kinetics were measured with p1 and p6 as reference (both grey) while constructs of interest are depicted in purple shades. Plotted are the mean (+/- SD) relative light units (RLU) normalized to the four-hour value over time (hours post electroporation) of n = 3 biologically independent experiments. c For comparison the replication values 96 h p.t. of all constructs are plotted as column diagram.+/- SD d Huh7 cells were transfected with plasmids encoding a triple eYFP in tandem with the artificial insertions including p1 and p6 flanking regions, respectively. Cells were fixed after 16–20 hours and the mean fluorescence intensity (MFI) for eYFP was measured for each compartment. Shown are example cells in 3D. eYFP is shown in green, the cell surface is depicted in white while the nuclear surface is depicted in red. See Supplementary Movies 18–25. e The eYFP MFI was measured for each compartment for ten n = 11 cells per construct, and individual outliers were removed by applying ROUT (Q = 1) method implemented in GraphPad Prism. Depicted is the range of individual data points as violin plots with a straight line as the median and dashed lines as quartiles. Source data are provided in the Source Data file.
Fig. 7
Fig. 7. Viral determinants for HEV replication in- and outside the HVR.
a Depicted is the Kernow-C1-p1 (p1) ORF1 encoding sequences with mutations that differentiate it from Kernow-C1-p6 (p6) ORF1. Additionally, the RPS17 insertion site is indicated on the genome. The mutations over the genome were cloned separately into p1, while the thirteen variants near the RPS17 (see Fig. 5b) were cloned together with the RPS17 RNA and were termed RPS17+flanking regions (RPS17/FR). b Replication kinetics were measured with p1 and p6 as reference (grey triangles) while constructs of interest are depicted in red. Plotted are mean relative light units (RLU) normalized to the four-hour value over time (hours post electroporation) of n = 3 biologically independent experiments, n = 6 for A220T and RPS17/FR constructs. c, f The 72-hour replication values were plotted as a column diagram. The left red/green area depicts the p1 replication, while the right red/green area depicts the p6 replication level. d The HEV full-length system was used to produce infectious particles with indicated constructs, which were titrated onto HepG2/C3A cells to determine viral titers as FFU/mL via immunofluorescence. A representative picture of a whole 96-well infected with non-enveloped HEVcc stained for the ORF2 protein (black) is shown above each column (mean, +/- SD). Dots represent individual data points of n = 5 individual experiments. e The RPS17 insertion alone or with a flanking region was cloned into the HEV3-83-2-27-Gluc replicon. Replication kinetics were measured with p1 and p6 as reference (grey triangles) while constructs of interest are depicted in green. Depicted are mean (+/- SD) relative light units (RLU) normalized to the four-hour value over time (hours post electroporation) of n = 3 biologically independent experiments for p1 and p6, n = 6 for other constructs. g The HEV full-length system was used to produce infectious particles with indicated constructs, which were titrated onto HepG2/C3A cells to determine viral titers as FFU/mL via immunofluorescence. A representative picture of a whole 96-well infected with non-enveloped HEVcc stained for the ORF2 protein (black) is shown above each column (mean, +/- SD). Dots represent individual data points of n = 3 individual experiments. Source data are provided in the Source Data file.

References

    1. Nimgaonkar I, Ding Q, Schwartz RE, Ploss A. Hepatitis E virus: advances and challenges. Nat. Rev. Gastroenterol. Hepatol. 2017;15:96–110. doi: 10.1038/nrgastro.2017.150. - DOI - PMC - PubMed
    1. World Health Organization (WHO), Hepatitis E: Fact sheet. Available at https://www.who.int/news-room/fact-sheets/detail/hepatitis-e 2021
    1. Kumar S, Subhadra S, Singh B, Panda BK. Hepatitis E virus: the current scenario. Int. J. Infect. Dis. 2013;17:e228–e233. doi: 10.1016/j.ijid.2012.11.026. - DOI - PubMed
    1. Pérez-Gracia MT, Suay-García B, Mateos-Lindemann ML. Hepatitis E and pregnancy: current state. Rev. Med. Virol. 2017;27:e1929. doi: 10.1002/rmv.1929. - DOI - PubMed
    1. Dalton HR, Bendall RP, Keane FE, Tedder RS, Ijaz S. Persistent carriage of hepatitis E virus in patients with HIV infection. N. Engl. J. Med. 2009;361:1025–1027. doi: 10.1056/NEJMc0903778. - DOI - PubMed