. 2024 Jun 6;15(1):4813.
doi: 10.1038/s41467-024-48807-y.

High-throughput screening unveils nitazoxanide as a potent PRRSV inhibitor by targeting NMRAL1

Affiliations

High-throughput screening unveils nitazoxanide as a potent PRRSV inhibitor by targeting NMRAL1

Zhanding Cui et al. Nat Commun. .

Abstract

Porcine Reproductive and Respiratory Syndrome Virus (PRRSV) poses a major threat to the global swine industry, yet effective prevention and control measures remain elusive. This study unveils Nitazoxanide (NTZ) as a potent inhibitor of PRRSV both in vitro and in vivo. Through High-Throughput Screening techniques, 16 potential anti-PRRSV compounds are identified from a library comprising FDA-approved and pharmacopeial drugs. We show that NTZ displays strong efficacy in reducing PRRSV proliferation and transmission in a swine model, alleviating viremia and lung damage. Additionally, Tizoxanide (TIZ), the primary metabolite of NTZ, has been identified as a facilitator of NMRAL1 dimerization. This finding potentially sheds light on the underlying mechanism contributing to TIZ's role in augmenting the sensitivity of the IFN-β pathway. These results indicate the promising potential of NTZ as a repurposed therapeutic agent for Porcine Reproductive and Respiratory Syndrome (PRRS). Additionally, they provide valuable insights into the antiviral mechanisms underlying NTZ's effectiveness.


Conflict of interest statement

The authors declare no competing interests.

Figures

Fig. 1
Fig. 1. High-throughput screening for antiviral compounds against PRRSV.
a Strategy diagram for GFP expression post-PRRSV infection in cells. Following PRRSV infection, the virus encounters cellular negative-strand PRRSV genome analogs, converting them into positive-strand RNA, subsequently expressing GFP. b Flow cytometry diagram of GFP expression induced in Marc-145-GFP cell line post-PRRSV infection. GFP-expressing cells increased by 25.8% in Marc-145-GFP cells post-PRRSV infection. c Indirect immunofluorescence image of Marc-145-GFP cells post-PRRSV infection. Cells infected with PRRSV expressed GFP in conjunction with PRRSV-N protein within the same cells. d Strategy diagram for implementing HTS. Compounds, GSWW-18 (Multiplicity of Infection, MOI = 1), and Marc-145-GFP cells were co-introduced into 96-well plates. The first column of the plate was for Mock treatment, with the addition of equal concentration Dimethyl sulfoxide (DMSO) and virus, and the last column contained 60 µM Ribavirin. e Raw data from all screening plates. DMSO treatment group (Mock, blue), negative control group (NC, yellow), potential hits (Hit, red), 60 µM Ribavirin positive control group (RBV, orange), compound library (Library, green). Data represent the average of three to five images per well. f Identification of enriched targets for potential antiviral compounds through GSEA. Compounds were ranked according to antiviral activity, and enrichment scores were then ranked, with the top 6 targets shown in the diagram (P < 0.05, false discovery rate (FDR) q < 0.5). P-values were generated using a one-sided hypergeometric test. Each black line in the diagram represents a compound.
Fig. 2
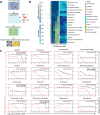
Fig. 2. The screening and dose-response relationship of hit compounds.
a Scheme of screening compounds. A concentration-gradient screening strategy was employed for 141 compounds using indirect immunofluorescence assay (IFA). Compounds were first diluted in cell culture medium to 20 μM and subsequently subjected to twofold serial dilutions, before co-incubation with Marc-145 cells and GSWW-18 strain in a 96-well plate. b The top 17 compounds from the cluster analysis of 141 compounds are presented. Compounds were clustered based on their targets using the complete linkage method and Euclidean distance. c Dose–response and cytotoxicity of the 16 compounds. Half-maximal effective concentration (EC50) curves (in red, n = 2 biologically independent samples) and half-maximal cytotoxic concentrations (CC50) curves (in black, n = 3 biologically independent samples) for the different compounds were determined in PAM cells. Data are mean ± SEM.
Fig. 3
Fig. 3. In vivo antiviral efficacy of NTZ.
a Animal grouping schematic. Pigs were intranasally infected with 1 × 105.5 TCID50 of GSWW-18 strain. NTZ was weighed according to animal body weight, suspended in PBS, and orally administered using a gavage. Mock treatment (Mock) groups received an equivalent volume of PBS orally. Prophylactic group received NTZ orally one day prior to GSWW-18 infection, and treatment group received NTZ on the third day post-infection. NTZ was administered orally (PO) twice a day (BID) for three consecutive days. Animals (n = 3) in each group were housed separately to prevent cross-infection, with caretakers changing protective clothing and shoe covers when cleaning enclosures and feeding. b Representative lung images. Mock group samples were collected at the time of the last pig’s death. c Representative IHC images of lung tissue. Brown granules indicate PRRSV positive (primary antibody SR30). The images are representative of three independent biological replicates. d Viral load in representative tissues from the prophylactic group. e Clinical scores (left) and survival curves (right) for both prophylactic and treatment groups. Clinical scores for all animals were compiled on days 0 and 7. Colors correspond to groups in Fig 3d. f Viral load in representative tissues from the treatment group. g Viral copy numbers in BALF. Dashed line indicates the limit of detection (d, f, g). Symbols represent three independent biological replicates (dg). Bar graphs (d, e, f, g) show mean± SEM values of samples, with P-values as indicated, calculated via two-way ANOVA with Dunnett’s multiple-comparison test (d, f, g, e). Survival curves were analyzed for P-value using log-rank (Mantel-Cox) test; P-values < 0.0332 were considered significant.
Fig. 4
Fig. 4. NTZ inhibition of PRRSV shedding and transmission.
a Viral load in blood, and shedding in oronasal and anal swabs. Viral load or shedding in blood and oronasal swabs were quantified from 2 to 4 dpi, and in anal swabs from 2 to 5 dpi. Viral copy numbers for each pig during this period are presented. b NTZ suppression of PRRSV proliferation in blood. 48 h post infection (infected with 1 × 105.5 TCID50 of GSWW-18 strain), pigs were orally administered NTZ at 10 mg/kg or 5 mg/kg at 0 h and 12 h, followed by blood collection via anterior vena cava or ear marginal vein. Data were normalized to highest and lowest values and fitted with LOWESS curves; semi-transparent lines represent pre-fitting data for each group. c Experimental design for NTZ reduction of PRRSV transmission. NTZ oral administration commenced simultaneously with infection (1 × 105.5 TCID50 of GSWW-18 strain) at 0 dpi, with daily collection of oronasal and anal swabs for 14 days, and all animals euthanized on day 14 for tissue and BALF collection. In the Mock co-house group, three animals survived until 14 dpi. d Viral loads in tissues of all experimental animals at 14 days. e Viral loads in BALF and shedding in oronasal and anal swabs over 14 days for PRRSV. f Pharmacokinetic curve and selected pharmacokinetic parameters. Parameters were calculated using a non-compartmental analysis (NCA). Eighteen pigs were evenly divided into three dosage groups (n = 6), each housed separately, fasted for 12 h before the experiment, and monitored by professional veterinarians for welfare and enclosure cleaning to prevent coprophagia. g Tissue distribution of NTZ’s main metabolite TIZ. Tissues were collected as per Method Pharmacokinetics and Tissue Distribution of NTZ, quantifying TIZ content at various times (n = 2). Each bar represents an individual pig, with colors corresponding to the groups in Fig 4c and dashed lines represent the limit of detection (d, e). Symbols represent three or six independent biological replicates (a, b, f) Scatter plots (a, f) show mean ± SD values of samples, with P-values as indicated, calculated via two-way ANOVA with Dunnett’s multiple-comparison test (a), P-values < 0.0332 were considered significant.
Fig. 5
Fig. 5. NTZ targets multiple proteins.
a Potential NTZ targets identified by iTSA. Following Method Isothermal Shift Assay Proteome in Cell Lysates, iTSA was performed on cell lysates at 52 °C. With criteria set at Log2 Fold Change > 1 and P < 0.05, a total of 26 potential targets were identified. The p-values were obtained from two-sample tests with empirical Bayes moderated t-statistics. b CETSA-WB validation of potential intracellular targets. Endogenous GATM and NMRAL1 in HEK-293T cells were verified as potential NTZ targets. GATM antibody (1:3000), NMRAL1 antibody (1:1500). c CETSA-WB validation of PRRSV non-structural protein targets. NSP1α and NSP12, plasmids of PRRSV non-structural proteins, transfected into Marc-145 cells, were identified as potential NTZ targets. HA antibody (1:5000). d Further verification of NTZ binding to aforementioned proteins using CCR method. All immunoblots had three biological repetitions, with similar results.
Fig. 6
Fig. 6. TIZ enhances IFN-β pathway sensitivity by promoting NMRAL1 dimerization.
a, b NMRAL1 expression augmented VR-2332 viral titers and mRNA levels. c, d Silencing of NMRAL1 led to decreased VR-2332 viral titers and mRNA expression. e NMRAL1 attenuated the antiviral efficacy of NTZ. f, g NMRAL1 reduced the enhancement of IFN-β by NTZ. h NMRAL1 silencing intensified NTZ’s viral inhibition. i, j NMRAL1 silencing further boosted NTZ’s induction of IFN-β expression. k NMRAL1 expression enhanced PRRSV-N protein levels while diminishing NTZ’s inhibitory effect on PRRSV-N. PRRSV-N antibody (1:1500), NMRAL1 antibody (1:1500). Silencing of NMRAL1 validated the same outcome. l Addition of NTZ increased intracellular NMRAL1 dimerization. HA antibody (1:5000). m In vitro purified NMRAL1 dimerization increased with higher NTZ concentrations. n DSF confirmed interaction between in vitro purified NMRAL1 and NTZ, increasing NMRAL1’s Tm by 1.43 °C. o SPR revealed NMRAL1 binding to TIZ with an affinity KD of 4.505 µM (Supplementary Fig. 10a). NMRAL1 gene was synthesized and cloned into the PCDNA3.1 vector. Symbols represent independent biological replicates (aj), showing mean values of samples, with P-values indicated, calculated via t-test (ad) or two-way ANOVA with Dunnett’s multiple-comparison test (ej); P-values < 0.0332 were considered significant. All experiments were performed in triplicate and repeated at least three times. Data displayed are Mean ± SD from a representative experiment.

Similar articles

Cited by

References

    1. Keffaber, K. K. Reproductive failure of unknown etiology. Am. Assoc. Swine Pract. Newsl.1, 1–9 (1989).
    1. Wensvoort G, et al. Mystery swine disease in The Netherlands: the isolation of Lelystad virus. Vet. Q. 1991;13:121–130. doi: 10.1080/01652176.1991.9694296. - DOI - PubMed
    1. Baron T, et al. Report on the first outbreaks of the porcine reproductive and respiratory syndrome (PRRS) in France. Diagnosis and viral isolation. Ann. Rech. Vet. 1992;23:161–166. - PubMed
    1. Tong G-Z, et al. Highly pathogenic porcine reproductive and respiratory syndrome, China. Emerg. Infect. Dis. 2007;13:1434–1436. doi: 10.3201/eid1309.070399. - DOI - PMC - PubMed
    1. Zhang Z, et al. The economic impact of porcine reproductive and respiratory syndrome outbreak in four Chinese farms: Based on cost and revenue analysis. Front. Vet. Sci. 2022;9:1024720. doi: 10.3389/fvets.2022.1024720. - DOI - PMC - PubMed

MeSH terms