. 2024 Jun 6;15(1):4839.
doi: 10.1038/s41467-024-48990-y.

Cis-regulatory evolution of the recently expanded Ly49 gene family

Affiliations

Cis-regulatory evolution of the recently expanded Ly49 gene family

Changxu Fan et al. Nat Commun. .

Abstract

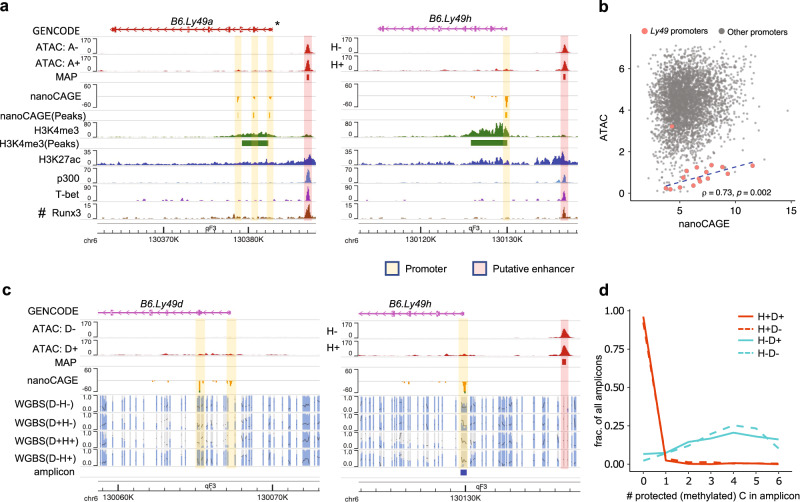
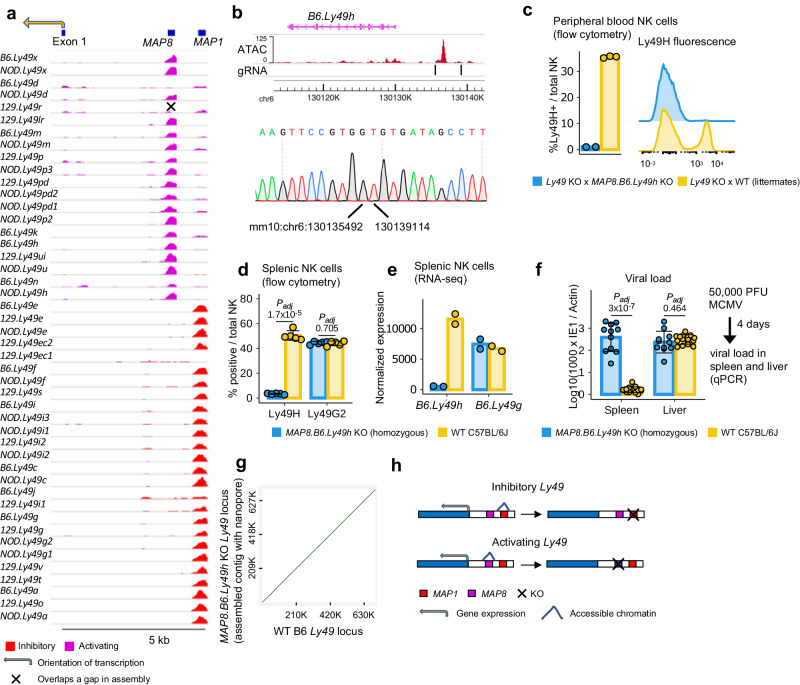
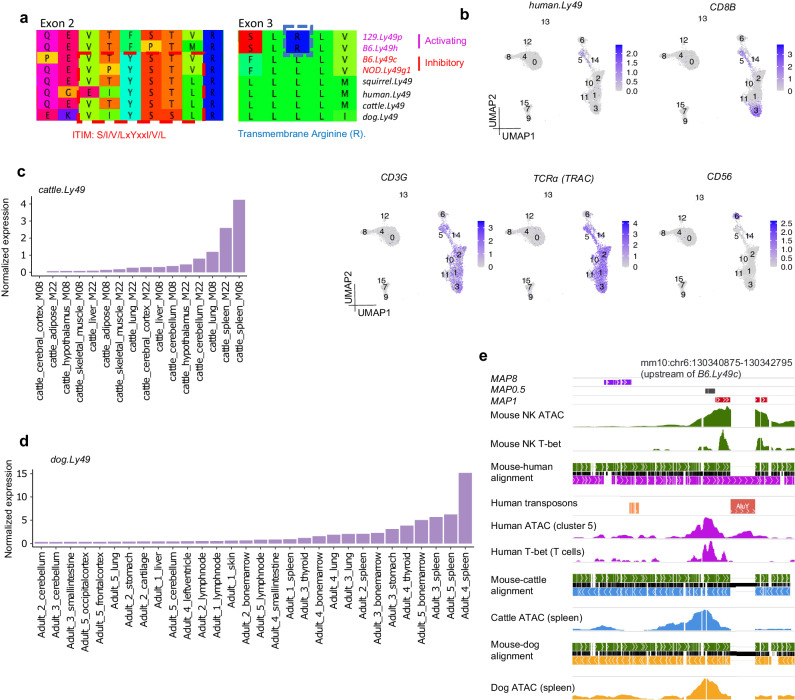
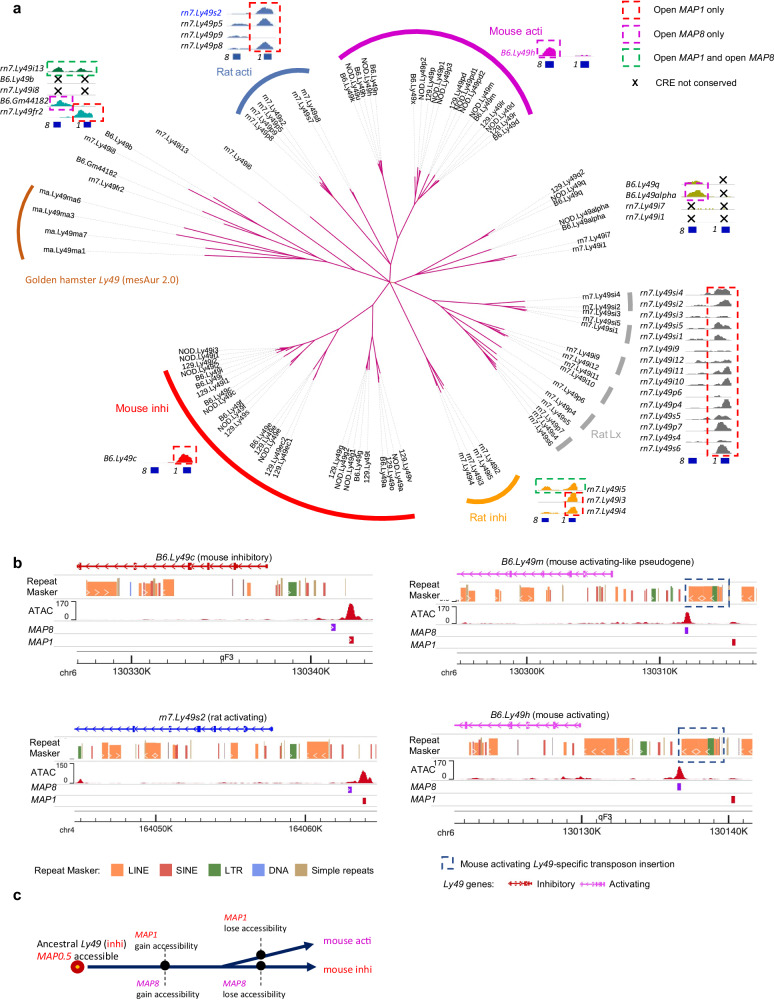
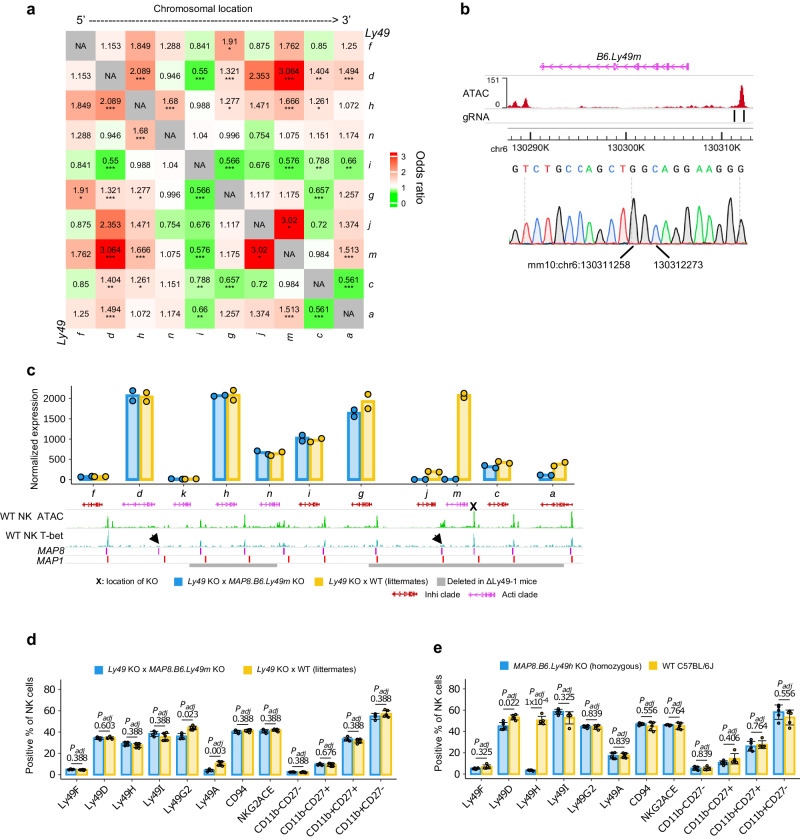
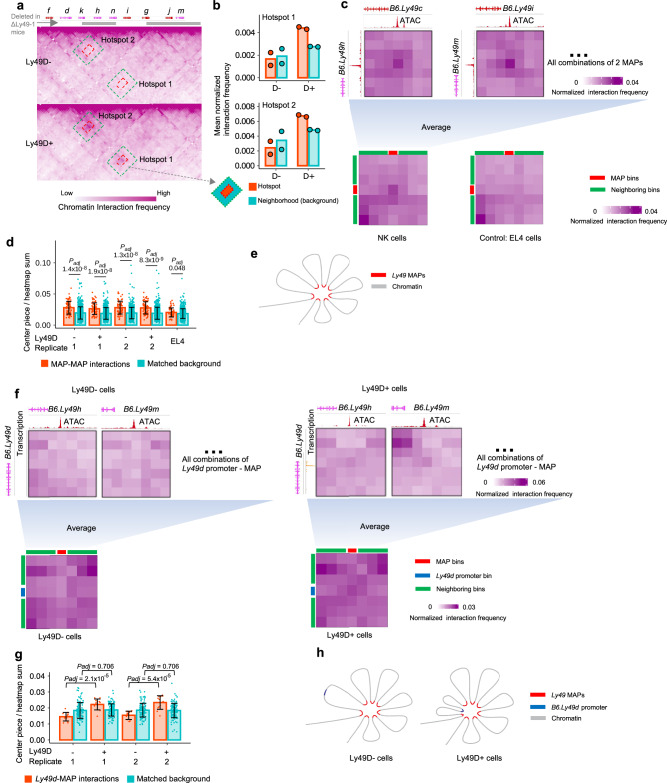
Comparative genomics has revealed the rapid expansion of multiple gene families involved in immunity. Members within each gene family often evolved distinct roles in immunity. However, less is known about the evolution of their epigenome and cis-regulation. Here we systematically profile the epigenome of the recently expanded murine Ly49 gene family that mainly encode either inhibitory or activating surface receptors on natural killer cells. We identify a set of cis-regulatory elements (CREs) for activating Ly49 genes. In addition, we show that in mice, inhibitory and activating Ly49 genes are regulated by two separate sets of proximal CREs, likely resulting from lineage-specific losses of CRE activity. Furthermore, we find that some Ly49 genes are cross-regulated by the CREs of other Ly49 genes, suggesting that the Ly49 family has begun to evolve a concerted cis-regulatory mechanism. Collectively, we demonstrate the different modes of cis-regulatory evolution for a rapidly expanding gene family.


Conflict of interest statement

The authors have no competing interests.

Figures

Fig. 1
Fig. 1. Ly49 genes feature lowly accessible promoters and constitutively accessible enhancer-like elements.
a The epigenetic signature of B6.Ly49a and B6.Ly49h. A: Ly49A; H: Ly49H. Sources of public data: H3K4me3: GSM4314407; H3K27ac: GSM4314409; p300: GSM2056372; T-bet: GSM4314405; Runx3: GSM1214531. * indicates manual curation of GENCODE (M19) B6.Ly49a annotation. The original GENCODE annotation designated Pro1 as B6.Ly49a promoter, which is not supported by our nanoCAGE data. #: data generated from the ICR mice, but aligned to the B6 genome, due to the lack of a ICR reference genome. b Scatter plot of ATAC-seq signals vs nanoCAGE signals for each active promoter (defined by nanoCAGE peaks. Methods). ATAC-seq and nanoCAGE signals are the average of 6 and 4 libraries, respectively. Both axes were normalized and log2 transformed (Methods). Pearson correlation was calculated based on Ly49 promoters only (n = 15 Ly49 promoters). One of the promoters of B6.Ly49g (top red dot) was excluded from the correlation analysis because it overlaps a MAP (Supplementary Fig. 4a). P-value was calculated from two-tailed Student’s t statistic. c Whole genome bisulfite sequencing (WGBS) data for sorted Ly49D-H-, Ly49D+H-, Ly49D+H+, and Ly49D-H+ NK cells, visualized using methylC tracks, where each bar marks a CpG, with gray and blue indicating the proportion of reads where this CpG was unprotected (unmethylated) or protected (methylated), respectively. To achieve allele-level resolution, CB6F1/J animals, which only encode Ly49d and h on one Ly49 allele, were used (Methods). D: Ly49D; H: Ly49H. d There are 6 CpGs covered by the amplicon-based bisulfite sequencing (indicated in c). The plot shows the fraction of amplicons where an indicated number (x-axis) of CpGs were protected (methylated). D: Ly49D; H: Ly49H. Source data are provided as a Source Data file.
Fig. 2
Fig. 2. Inhibitory and activating Ly49 genes are regulated by two separate sets of proximal CREs.
a Sequence alignment-based pileup view of ATAC signals on the coordinates of the Ly49 consensus sequence (Methods). Only reads with 100 % match to reference were included. No mapping quality (MAPQ) filters were applied. The same plot based on reads passing MAPQ > = 8 is presented in Supplementary Fig. 9a. b The exact location of KO for the MAP8.B6.Ly49h KO allele. c Percentages of Ly49H+ cells out of total NK cells in peripheral blood (flow cytometry). The Ly49 KO allele expresses no Ly49 genes in the Ly49 cluster on the protein level (Methods). n = 2 KO (1 male 1 female) or 3 WT (1 male 2 female) animals. Means (bars) and individual values (points) are shown. d Percentages of Ly49H+ or Ly49G2+ cells out of all splenic NK cells in MAP8.B6.Ly49h KO vs age and sex-matched WT animals. Ly49G2 is one of the protein isoforms of B6.Ly49g (alternative splicing). Means (bars) and individual values (points) are shown. Error bars: mean ± s.d. Two-tailed unpaired Student’s t-test. P-values are FDR-adjusted. For both KO and WT: n = 5 (3 male and 2 female mice). e Splenic NK cells from female KO vs WT animals in d were sorted. RNA-seq was performed on sorted cells. Normalization was performed using DESeq2 (Methods). f Viral load in the spleen and liver of mice 4 days after MCMV injection. Viral load was calculated as Log10 (1000 x copies of MCMV IE1/copies of mouse Actin). Data were collected from 2 independent experiments. Experiment 1: n = 6 KO (4 male 2 female) and 7 WT (4 male 3 female) mice. Experiment 2: n = 5 KO (3 male 2 female) and 8 WT (4 male 4 female) mice. Means (bars) and individual values (points) are shown. Error bars: mean ± s.d. Two-tailed unpaired Student’s t-test. P-values are FDR-adjusted. g Dotplot between the assembled contig and the WT B6 Ly49 locus. h Schematic representation of Ly49 enhancer choice. Source data are provided as a Source Data file.
Fig. 3
Fig. 3. Ly49 coding sequence and cis-regulatory evolution across mammalian lineages.
a Amino acid sequence alignment of selected Ly49 sequences from mice and the single copy Ly49 sequences from squirrels, humans, cattle, and dogs. Amino acids were translated from DNA sequence alignment of the exons. bd Ly49 gene expression patterns in humans, cattle, and dogs. Human single cell multiome data was obtained from 10x Genomics public datasets and reprocessed in-house (Methods). CD8B, CD3G, and TCRa are markers for T cells. CD56 marks human NK cells. Cattle RNA-seq data was obtained from GSE158430, re-analyzed using a custom pipeline (Methods), and normalized using cpm (counts per million). Normalized dog gene expression values were directly obtained from BarkBase. e WashU Comparative Epigenome Browser view of the upstream region of Ly49 genes. Data sources: Mouse NK ATAC: B6_Ly49Dp_ATAC_rep1 (this study, Supplementary Data 1); mouse NK cell T-bet ChIP-seq: GSM4314405; human cluster 5 (b) ATAC-seq: 10x public multiome dataset (10 k PBMC from a healthy individual with granulocytes removed by sorting); human T-bet ChIP-seq: GSM776557; cattle spleen ATAC-seq: GSM4799634; dog spleen ATAC-seq: SRX5812510. Multiple sequence alignment was generated using “mafft --auto”.
Fig. 4
Fig. 4. Ly49 enhancer choice likely resulted from lineage-specific enhancer loss.
a Ly49 gene tree constructed from introns 1 and 2 using MrBayes (Methods). All branches shown have posterior probability > = 0.85. Branches with posterior probability < 0.85 have been deleted. rn7 indicate rat Ly49 genes. ATAC-seq signals (processed in the same way as Fig. 2a) on the coordinates of the Ly49 consensus sequence are shown for selected genes. A comprehensive view of the ATAC signals is presented in Supplementary Fig. 15d-e. Lx indicates the rat Ly49 clade characterized by the presence of an Lx transposon in intron 2. 1 and 8 represent MAP1 and MAP8, respectively. b Mouse activating Ly49 genes feature a ~ 2.5 Kb array of transposons inserted between MAP1 and promoter. c Model for the evolutionary mechanisms of Ly49 enhancer choice. Source data are provided as a Source Data file.
Fig. 5
Fig. 5. Concerted cis-regulation of Ly49 family members.
a Ly49 co-expression pattern in splenic NK cells of B6 mice. Data source: GSE189807. Entry (x, y) in the heatmap represents the odds ratio of gene y expression in cells expressing gene x relative to cells not expressing gene x (Methods). The heatmap is the average of 2 datasets (biological replicates). Asterisks indicate FDR-adjusted significance levels from Fisher’s exact test. *FDR < 0.05; **FDR < 0.01; ***FDR < 0.001. Exact FDR values for each entry is available in Source Data. n = 4841 cells (sample 1) or 2632 cells (sample 2). b The exact genomic location of KO for the MAP8.B6.Ly49m KO allele. c The expression of Ly49 genes (RNA-seq) from the MAP8.B6.Ly49m KO vs WT alleles. n = 2 independent biological replicates (female mice). Means (bars) and individual values (points) are shown. Gene expression was normalized by DESeq2. WT NK ATAC data: the B6_Ly49Dp_ATAC_rep1 sample generated in this study (Supplementary Data 1); WT NK T-bet ChIP-seq data: GSM4314405. d The surface expression (flow cytometry) of Ly49 receptors and other common NK surface markers in Ly49 KO x MAP8.B6.Ly49m KO mice vs Ly49 KO x  MAP8.B6.Ly49m WT littermates. Ly49G2 is one of the protein isoforms of B6.Ly49g (alternative splicing). Means (bars) and individual values (points) are shown. Error bars: mean ± s.d. P-values were FDR-adjusted. Two-tailed unpaired Student’s t-test. KO: n = 4 (2 male and 2 female mice); WT: n = 6 (3 male and 3 female mice). e The surface expression (measured by flow cytometry) of Ly49 receptors and other common NK surface markers in homozygous MAP8.B6.Ly49h KO mice vs age and sex-matched WT B6 animals. Ly49G2 is one of the protein isoforms of B6.Ly49g (alternative splicing). Means (bars) and individual values (points) are shown. Error bars: mean ± s.d. P-values were FDR-adjusted. Two-tailed unpaired Student’s t-test. For both KO and WT: n = 3 male and 2 female mice. Source data are provided as a Source Data file.
Fig. 6
Fig. 6. The 3D chromatin architecture of the B6 Ly49 locus.
a 3D chromatin interactions in the B6 Ly49 locus at 5 Kb resolution. Red rectangles indicate the locations of the 2 hotspots in Ly49D+ cells. Their neighborhoods are defined as the regions between the green and red rectangles. b Quantification of the strengths of chromatin contacts between B6.Ly49d and its interacting partners for the 2 hotspots in (a). Y axes represent the mean VC-normalized interaction frequencies in a hotspot or its neighborhood. Means (bars) and individual values (points) are shown. n = 2 biologically independent samples. c MAP - MAP interaction frequencies (5 Kb resolution). 2 examples of MAP - MAP interaction profiles, and the average MAP - MAP interaction profiles calculated from all 66 combinations of 2 MAPs, with the one on the centromeric side as rows and the one on the telomeric side as columns. d Quantification of (c). Means (bars) and individual values (points) are shown. Each point represents a MAP - MAP interaction (n = 66) or a matched background interaction (n = 660). Error bars: mean ± s.d. Two-tailed unpaired Student’s t-test. P-values are FDR-adjusted. e Schema of the proposed 3D chromatin hub formed by Ly49 MAPs. f B6.Ly49d promoter - MAP interaction frequency profiles (5 Kb resolution). 2 examples of B6.Ly49d promoter - MAP interaction profiles as a function of B6.Ly49d expression, and the average B6.Ly49d promoter - MAP interaction profiles calculated as the mean of individual profiles between the B6.Ly49d promoter and each MAP. g Quantification of (f). Means (bars) and individual values (points) are shown. Error bars: mean ± s.d. P-values are FDR-adjusted. Two-tailed unpaired Student’s t-test. Two independent experiments are shown. For each experiment, each point represents the normalized chromatin contact frequency between B6.Ly49d promoter and one of the 12 MAPs (n = 12), or a matched background frequency (n = 120, 10 background for each MAP). h Schema of the proposed B6.Ly49d promoter - MAP hub interactions in Ly49D+ vs D- cells. Source data are provided as a Source Data file.

Similar articles

Cited by

References

    1. Hadzhiev Y, et al. Functional diversification of sonic hedgehog paralog enhancers identified by phylogenomic reconstruction. Genome. Biol. 2007;8:R106. doi: 10.1186/gb-2007-8-6-r106. - DOI - PMC - PubMed
    1. Kleinjan DA, et al. Subfunctionalization of duplicated zebrafish pax6 genes by cis-regulatory divergence. PLoS Genet. 2008;4:e29. doi: 10.1371/journal.pgen.0040029. - DOI - PMC - PubMed
    1. Force A, et al. Preservation of duplicate genes by complementary, degenerative mutations. Genetics. 1999;151:1531–1545. doi: 10.1093/genetics/151.4.1531. - DOI - PMC - PubMed
    1. Rahim MMA, Makrigiannis AP. Ly49 receptors: evolution, genetic diversity, and impact on immunity. Immunol. Rev. 2015;267:137–147. doi: 10.1111/imr.12318. - DOI - PubMed
    1. Gamache A, et al. Ly49R activation receptor drives self-MHC–educated NK cell immunity against cytomegalovirus infection. Proc. Natl Acad. Sci. USA. 2019;116:26768–26778. doi: 10.1073/pnas.1913064117. - DOI - PMC - PubMed

MeSH terms

Substances