. 2024 Jun 6;15(1):4847.
doi: 10.1038/s41467-024-49224-x.

PNPLA3 is a triglyceride lipase that mobilizes polyunsaturated fatty acids to facilitate hepatic secretion of large-sized very low-density lipoprotein

Affiliations

PNPLA3 is a triglyceride lipase that mobilizes polyunsaturated fatty acids to facilitate hepatic secretion of large-sized very low-density lipoprotein

Scott M Johnson et al. Nat Commun. .

Abstract

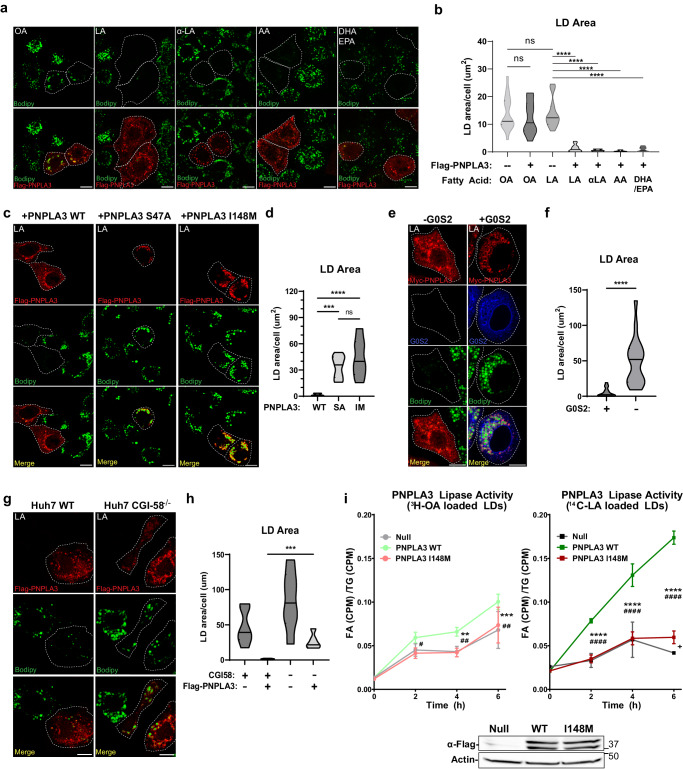
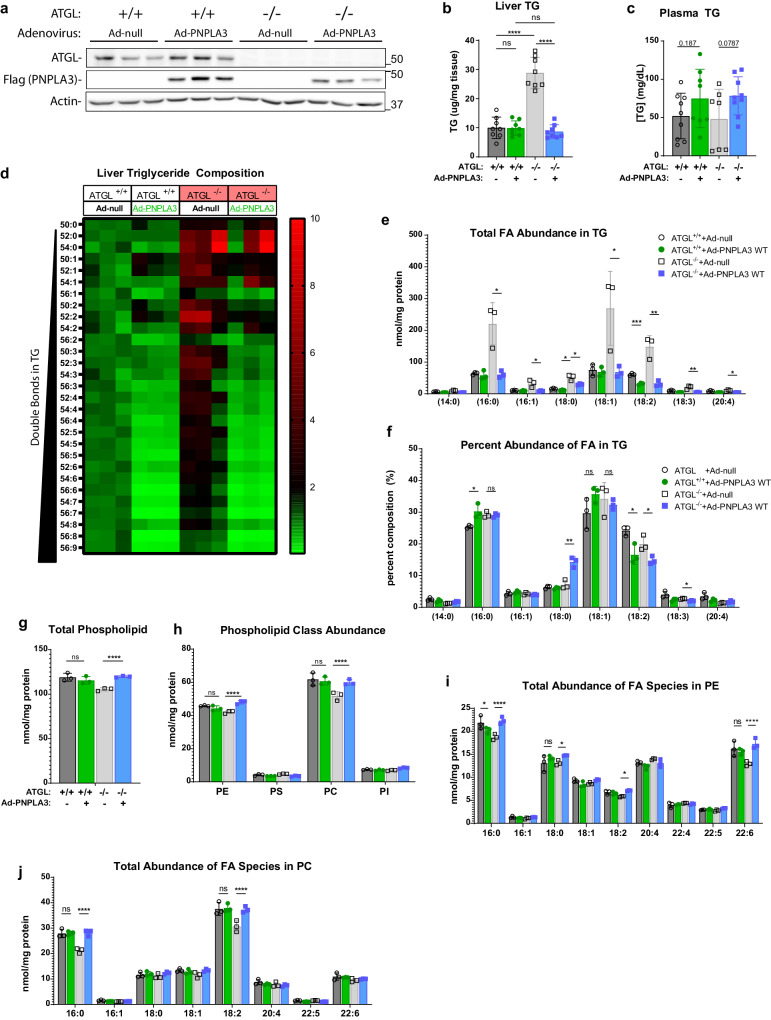
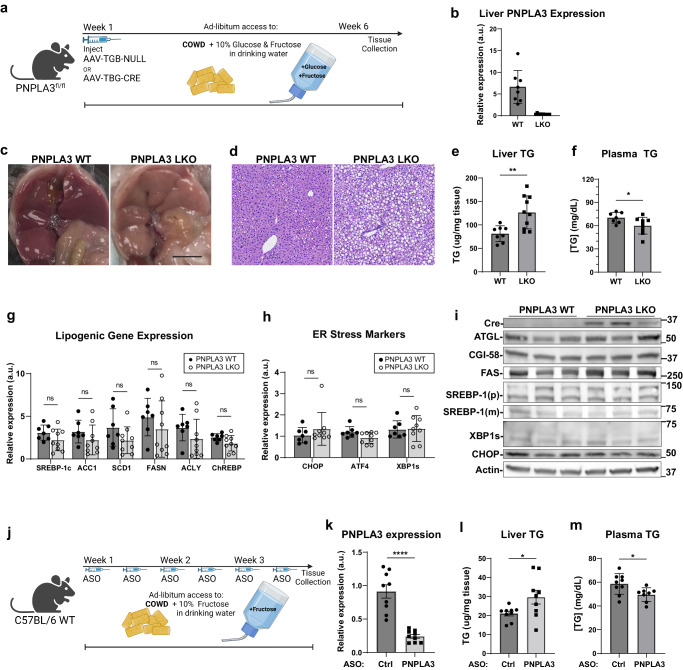
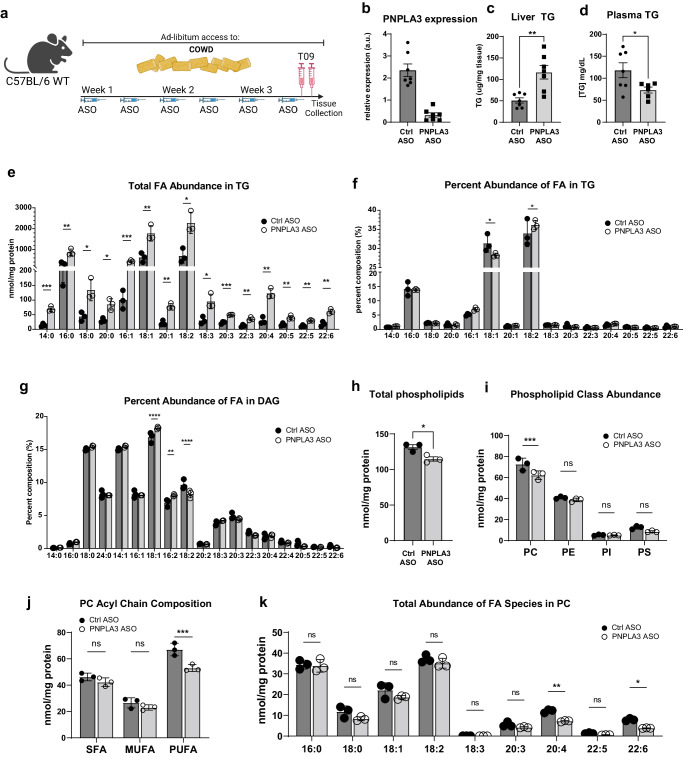
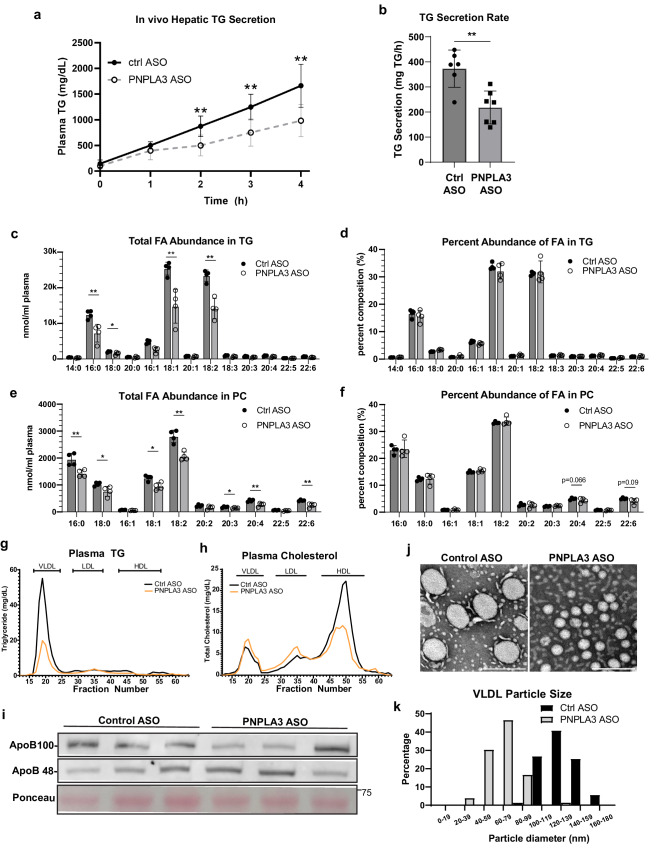
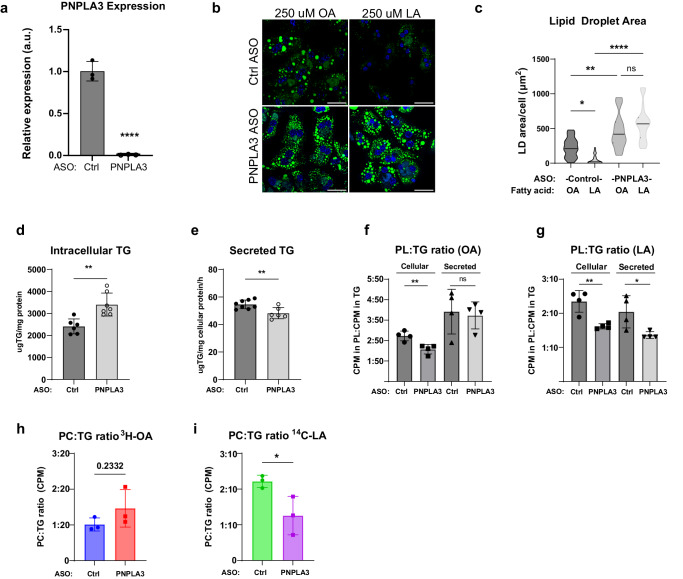
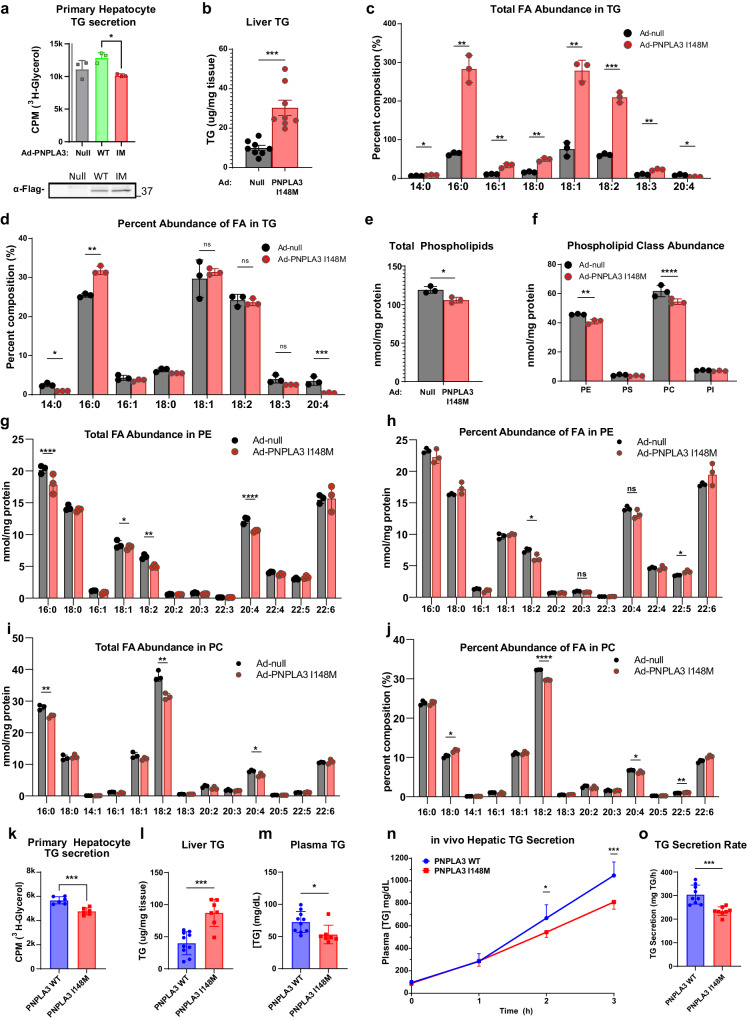
The I148M variant of PNPLA3 is closely associated with hepatic steatosis. Recent evidence indicates that the I148M mutant functions as an inhibitor of PNPLA2/ATGL-mediated lipolysis, leaving the role of wild-type PNPLA3 undefined. Despite showing a triglyceride hydrolase activity in vitro, PNPLA3 has yet to be established as a lipase in vivo. Here, we show that PNPLA3 preferentially hydrolyzes polyunsaturated triglycerides, mobilizing polyunsaturated fatty acids for phospholipid desaturation and enhancing hepatic secretion of triglyceride-rich lipoproteins. Under lipogenic conditions, mice with liver-specific knockout or acute knockdown of PNPLA3 exhibit aggravated liver steatosis and reduced plasma VLDL-triglyceride levels. Similarly, I148M-knockin mice show decreased hepatic triglyceride secretion during lipogenic stimulation. Our results highlight a specific context whereby the wild-type PNPLA3 facilitates the balance between hepatic triglyceride storage and secretion, and suggest the potential contribution of a loss-of-function by the I148M variant to the development of fatty liver disease in humans.


Conflict of interest statement

KM-B and DL are employed by and have shares in AstraZeneca. The remaining authors declare no competing interests.

Figures

Fig. 1
Fig. 1. PNPLA3 degrades PUFA-LDs independently of ATGL.
a ATGL−/− HeLa cells transfected with FLAG-PNPLA3 were treated overnight with (from left to right) 250 μM of OA, LA, α-LA, AA (250 μM), or DHA (125 μM) + EPA (125 μM), and then immunostained with a FLAG antibody. LDs were stained with BODIPY. b Quantification of LD area in (a). c ATGL−/− HeLa cells transfected with FLAG-tagged (from left to right) PNPLA3-WT, PNPLA3-S47A, or PNPLA3-I148M were treated overnight with 250 μM LA and then imaged as in (a). d Quantification of LD area in (c). e ATGL−/− HeLa cells transfected with Myc-tagged PNPLA3 or co-transfected with Flag-G0S2 were treated overnight with 250 μM LA and then imaged as in (a). f Quantification of LD area in (E). g WT control (left) or CGI-58 −/− (right) Huh7 cells transfected with FLAG-PNPLA3 were treated with 250 μM LA overnight and then imaged as in (a). h Quantification of LD area in (g). i PNPLA3−/− primary mouse hepatocytes were isolated and infected with null, PNPLA3 WT or PNPLA3 I148M expressing adenovirus, and loaded with 250 μM OA + 3H-OA (left) or 250 μM LA + 14C-LA (right). After cell lysis, isolated LDs were normalized for total TG content and incubated at 37 °C with 20 μM ATGListatin in a 5% FA-free BSA solution. At the indicated intervals, fractional aliquots were removed from the reaction mixture, and albumin-bound FA was extracted for scintillation counting (n = 4 per condition from a representative experiment). Scale bar in microscopic images = 10 μm. Error bars in (i) represent mean ± SD. (*) indicates statistical significance between [Null] and [PNPLA3 WT], (#) indicates statistical significance between [PNPLA3 WT] and [PNPLA3 I148M], and (+) indicates statistical significance between [Null] and [PNPLA3 I148M]. Box-plot elements: center line, median; box limits, upper and lower quartiles. *p < 0.05, **P < 0.01, ***p < 0.001, ****p < 0.0001, two-sided t test. Specific p values: b Untransfected+OA vs PNPLA3 + OA: p = 0.488; Untransfected+OA vs Untransfected+LA: p = 0.961; Untransfected+LA vs PNPLA3 + LA: p = 1.22E-08; Untransfected+LA vs PNPLA3+aLA: p = 1.35E-06; Untransfected+LA vs PNPLA3 + AA: p = 2.25E-08; Untransfected+LA vs PNPLA3 + DH/EPA: p = 1.59E-08. d PNPLA3 WT + LA vs PNPLA3 S47A + LA: p = 2.46E-05; PNPLA3 WT + LA vs PNPLA3 I148M + LA: p = 6.43E-04; PNPLA3 S47A + LA vs PNPLA3 I148M + LA: p = 0.237. f p = 9.60E-06. h p = 9.22E-04. i OA loaded LDs: Null vs PNPLA3 WT/2 h: p = 0.0235, 4 h: p = 0.0011, 6 h: p = 0.030; Null vs PNPLA3 I148M/2 h: p = 0.458, 4 h: p = 0.804, 6 h: p = 0.715; PNPLA3 WT vs PNPLA3 I148M/2 h: p = 0.0060, 4 h: p = 0.00051, 6 h: p = 0.0538; LA loaded LDs: Null vs PNPLA3 WT/2 h: p = 3.63E-05, 4 h: p = 8.38E-04, 6 h: p = 3.91E-08; Null vs PNPLA3 I148M/2 h: p = 0.708, 4 h: p = 0.885, 6 h: p = 0.0029; PNPLA3 WT vs PNPLA3 I148M/2 h: p = 2.68E-06, 4 h: p = 6.87E-05, 6 h: p = 6.02E-07.
Fig. 2
Fig. 2. Adenoviral expression of PNPLA3 alleviates hepatic steatosis and reduces PUFAs in liver TG of ATGL−/− mice.
10-week-old WT or ATGL−/− mice fed a chow diet were injected with Ad-null or Ad-FLAG-PNPLA3. Tissues were collected following a 12-h fast (n = 8/group). a Immunoblotting analysis of ATGL and FLAG-PNPLA3 expression in the liver. b Total liver TG content. c Total plasma TG content. dj Shotgun lipidomic analysis of whole liver tissue (n = 3/group). d Heatmap indicating fold-change of individual TG species relative to control (WT mice injected with Ad-null) arranged by increasing number of double bonds. Individual FA composition of TGs presented as absolute FA abundance (e) and as percentage of the total FA pool (f). Abundance of total PLs (g) and major PL classes (h). Absolute FA abundance in PE (i) and PC (j) species. All error bars represent mean ± SD. *p < 0.05, **p < 0.01, ***p < 0.001 ****p < 0.0001, two-sided t test. Specific p values: b (ATGL + /+) Ad-null vs Ad-PNPLA3: p = 0.938; (Ad-null) ATGL + /+ vs ATGL −/−: p = 9.01E-07; (Ad-PNPLA3) ATGL + /+ vs ATGL −/−: p = 0.356; (ATGL−/−) Ad-null vs Ad-PNPLA3: p = 1.09E-07. e 16:0, (ATGL−/−) Ad-null vs Ad-PNPLA3: p = 0.0149; 16:1, (ATGL−/−) Ad-null vs Ad-PNPLA3: p = 0.0228; 18:0, (ATGL + /+) Ad-null vs Ad-PNPLA3: p = 0.0176, (ATGL−/−) Ad-null vs Ad-PNPLA3: p = 0.0156; 18:1, (ATGL−/−) Ad-null vs Ad-PNPLA3: p = 0.0418; 18:2, (ATGL + /+) Ad-null vs Ad-PNPLA3: p = 4.33E-04, (ATGL−/−) Ad-null vs Ad-PNPLA3: p = 0.00483; 18:3, (ATGL−/−) Ad-null vs Ad-PNPLA3: p = 0.00876; 20:4, (ATGL−/−) Ad-null vs Ad-PNPLA3: p = 0.0117. f 16:0, (ATGL + /+) Ad-null vs Ad-PNPLA3: p = 0.0211, (ATGL−/−) Ad-null vs Ad-PNPLA3: p = 0.831; 18:0, (ATGL−/−) Ad-null vs Ad-PNPLA3: p = 0.0041, 18:1, (ATGL + /+) Ad-null vs Ad-PNPLA3: p = 0.126, (ATGL−/−) Ad-null vs Ad-PNPLA3: p = 0.581; 18:2, (ATGL + /+) Ad-null vs Ad-PNPLA3: p = 0.0186, (ATGL−/−) Ad-null vs Ad-PNPLA3: p = 0.0297; 18:3, (ATGL−/−) Ad-null vs Ad-PNPLA3: p = 0.0104. g (ATGL + /+) Ad-null vs Ad-PNPLA3: p = 0.383; (ATGL−/−) Ad-null vs Ad-PNPLA3: p = 0.000223. h PE, (ATGL + /+) Ad-null vs Ad-PNPLA3: p = 0.188, (ATGL−/−) Ad-null vs Ad-PNPLA3: p = 0.00170; PC, (ATGL + /+) Ad-null vs Ad-PNPLA3: p = 0.713, (ATGL−/−) Ad-null vs Ad-PNPLA3: p = 0.00934. i 16:0, (ATGL + /+) Ad-null vs Ad-PNPLA3: p = 0.158, (ATGL−/−) Ad-null vs Ad-PNPLA3: p = 0.00356; 18:0, (ATGL + /+) Ad-null vs Ad-PNPLA3: p = 0.324, (ATGL−/−) Ad-null vs Ad-PNPLA3: p = 0.00709; 18:2, (ATGL−/−) Ad-null vs Ad-PNPLA3: p = 0.000145; 22:6(ATGL + /+) Ad-null vs Ad-PNPLA3: p = 0.577, (ATGL−/−) Ad-null vs Ad-PNPLA3: p = 0.0037. j 16:0, (ATGL + /+) Ad-null vs Ad-PNPLA3: p = 0.908, (ATGL−/−) Ad-null vs Ad-PNPLA3: p = 0.00154; 18:2, (ATGL + /+) Ad-null vs Ad-PNPLA3: p = 0.841, (ATGL−/−) Ad-null vs Ad-PNPLA3: p = 0.0105.
Fig. 3
Fig. 3. PNPLA3 loss induces hepatic steatosis but ameliorates hypertriglyceridemia in mice challenged with a PUFA-enriched diet and sugar water.
a Experimental scheme (Biorender) for creation and treatment of PNPLA3-LKO mice. 8–10-week-old PNPLA3fl/fl mice injected with either AAV-TBG-Null (n = 8) or AAV-TBG-Cre (n = 10) were fed COWD and given access to fructose/glucose in drinking water for 6 weeks. b Liver PNPLA3 mRNA expression as analyzed by qPCR. c Gross appearance of liver (scale bar = 1 cm). d Hematoxylin and eosin (H&E) staining of liver sections. e Total liver TG content. f Total plasma TG content. g Liver mRNA expression of lipogenic genes by qPCR. h Liver mRNA expression of ER stress response genes by qPCR. i Immunoblotting analysis of indicated lipolysis, lipogenesis, and ER-stress associated proteins in liver. j Experimental scheme (Biorender) for PNPLA3 ASO experiment. 10-week-old WT mice fed COWD and given fructose drinking water were treated with control or PNPLA3 ASO biweekly for 3 weeks (n = 9/group). k Liver PNPLA3 mRNA expression in ASO mice by qPCR. l Total liver TG content. m Total plasma TG content in ASO mice. Data presented in (eh) and (km) are independent replicates derived from individual mice. Data are represented as mean ± SD. *p < 0.05, **p < 0.01, two-sided t test. Specific p values: e p = 0.00410. f p = 0.0443. k p = 7.73E-06. l p = 0.0389. m p = 0.0272.
Fig. 4
Fig. 4. PNPLA3 depletion impairs mobilization of PUFA from TG to PC upon LXR agonism.
10-week-old WT mice fed COWD were treated with control or PNPLA3 ASO for 3 weeks. Both groups were treated with the LXR agonist T09 prior to tissue collection (n = 7/group). a Experimental scheme (Biorender). b Liver PNPLA3 mRNA expression. c Total liver TG content. d Total plasma TG content. ek Shotgun lipidomics was performed on whole liver tissue (n = 3/group). Individual FA species composition of TG presented as absolute FA abundance (e) and as percentage of the total FA pool (f). g Percentage of total FA pool in DAG. Abundance of total PLs (h) and major PL classes (i). j Total abundance of SFA, MFA, and PUFA acyl chains in PC. k Absolute FA abundance in PC. Data presented as mean ± SD *p < 0.05, **p < 0.01, ***p < 0.001 ****p < 0.0001, two-sided t test. Specific p values: c p = 0.00211. d p = 0.0402. e 14:0, p = 7.24E-04; 16:0, p = 0.0160; 18:0, p = 0.00681; 20:0, p = 0.00296; 16:1, p = 0.00742; 18:1, p = 0.0166; 20:1, p = 0.0101; 18:2, p = 0.00998; 18:3, p = 0.0110; 20:3, p = 1.06E-04; 22:3, p = 8.61E-04; 20:4, p = 4.13E-04; 20:5, p = 0.00136; 22:5, p = 0.00113; 22:6, p = 0.00114. f 18:1, p = 0.509; 18:2, p = 0.0460. g 18:1, p = 0.00226; 16:2, p = 0.0310; 18:2, p = 0.0418. h p = 0.0214. i PC, p = 0.0459. j SFA, p = 0.186; MUFA, p = 0.236; PUFA, p = 0.0108. k 16:0, p = 0.805; 18:0, p = 0.114; 18:1, p = 0.192; 18:2, p = 0.327; 18:3, p = 0.00367; 20:3, p = 0.140; 20:4, p = 6.46E-04; 22:5, p = 0.0104; 22:6, p = 2.96E-04.
Fig. 5
Fig. 5. PNPLA3 depletion reduces VLDL particle size and TG content as well as impairs hepatic TG secretion upon LXR agonism.
a Representative time course of hepatic TG secretion in mice upon administration of Poloxomer-407. Priorly, 10-week-old WT mice were fed COWD and treated with control (n = 6) or PNPLA3 ASO (n = 7) and administered T09 for 3 weeks. b Data from (a) represented as secretion rate per hour. cf Shotgun lipidomics was performed on plasma samples from the 3 h timepoint in (a) (n = 4/group). Individual FA species composition of TG presented as absolute FA abundance (c) and as percentage of the total FA pool (d). Individual FA species composition of PC presented as absolute FA abundance (e) and as percentage of the total FA pool (f). Plasma samples pooled from control or PNPLA3 ASO mice administered T09 were fractionated by FPLC (4-5 mice/group). Lipoprotein fractions were measured for the content of TG (g) and cholesterol (h). i Plasma samples were immunoblotted for ApoB-100 and ApoB-48. j EM analysis of lipoprotein particles from control and PNPLA3 ASO mice +T09. k Quantification of VLDL particle size distribution of (J). Scale bar = 200 nm. Data presented as mean ± SD *p < 0.05, **p < 0.01, two-sided t test. Specific p values: (a) 1 h, p = 0.214; 2 h, p = 0.00661; 3 h, p = 0.00544; 4 h, p = 0.00643. (b) p = 0.00212. (c) 16:0, p = 0.00923; 18:0, p = 0.0452; 16:1, p = 0.00309; 18:1, p = 0.00587; 18:2, p = 0.00125. e 16:0, p = 0.00718; 18:0, p = 0.0344; 18:1, p = 0.0109; 18:2, p = 0.00194; 20:3, p = 0.0456; 20:4, p = 0.00966; 22:6, p = 0.00454.
Fig. 6
Fig. 6. PNPLA3 mediates PUFA mobilization from intracellular TG to secreted PL.
a qPCR of PNPLA3 expression in primary hepatocytes transfected with control or PNPLA3 ASO (n = 3/group). b BODIPY staining of LDs in cells after 4 h of lipid deprivation in high glucose medium following treatment with 250 μM OA or LA in low glucose medium. c Quantification of LD area in (b). Primary hepatocytes were pretreated with a mixture of unlabeled 125 μM OA + 125 μM LA (n = 8/ASO group). Following 24 h in FA-free media, lipids were extracted from cells (d) and conditioned media (e) for quantitative TG analysis. Primary hepatocytes were pretreated with a mixture of unlabeled 125 μM OA + 125 μM LA containing either 3H-OA or 14C-LA. After a 24-h chase period, cellular and secreted lipids were analyzed for the ratio of 3H-OA (f) or 14C-LA (g) in PL vs TG (n = 4/group). Primary hepatocytes were pretreated with either 125 μM of unlabeled OA containing 3H-OA (h) or 125 μM of unlabeled LA containing 14C-LA (i). After a 24 h chase period, secreted lipids were analyzed for ratio of radioactivity in PL vs.TG (n = 3/group). Scale bar = 50 μm. Box-plot elements: center line, median; box limits, upper and lower quartiles. Data presented as mean ± SD *p < 0.05, **p < 0.01, ****p < 0.0001, two-sided t test. Specific p values: c (Ctrl ASO) OA vs LA, p = 2.23E-06; (PNPLA3 ASO) OA vs LA, p = 0.177; (OA) Ctrl ASO vs PNPLA3 ASO, p = 0.00239; (LA) Ctrl ASO vs PNPLA3 ASO, p < 1E-10. d p = 0.00213. e p = 0.00666. f Cellular, p = 0.00775; Secreted, p = 0.783. g Cellular, p = 0.00437; Secreted, p = 0.0300. i p = 0.0424.
Fig. 7
Fig. 7. Overexpression or knockin of PNPLA3-I148M in mice impairs hepatic TG secretion.
a TG secretion from primary hepatocytes isolated from WT mice, infected with control, PNPLA3 WT or PNPLA3 I148M expressing adenovirus, and treated with 250 μM 1:1 OA:LA and 25 μM glycerol containing 3H-glycerol (n = 3/group). b–h 10-week-old WT mice fed a chow diet were injected with either Ad-null or Ad-PNPLA3-I148M. Tissues were collected following a 12-h fast for lipid (n = 8/group) and lipidomic analysis (n = 3/group). b Total liver TG content. Individual FA species composition of TG presented as absolute FA abundance (c) and as percentage of the total FA pool (d). e Abundance of total PLs. f Abundance of major PL classes. Individual FA species composition of PE presented as absolute FA abundance (g) and as percentage of the total FA pool (h). Individual FA species composition of PC presented as absolute FA abundance (i) and as percentage of the total FA pool (j). k TG secretion from primary hepatocytes isolated from WT or PNPLA3-I148M-KI mice following treatment with 250 μM 1:1 OA:LA and 25 μM glycerol containing 3H-glycerol (n = 6/group). l–o 9-12-wk-old WT (n = 10) and I148M-KI (n = 7) mice were fed COWD and given access to fructose/glucose in drinking water for 3 weeks. l Total liver TG content. m Total plasma TG content. n Representative time course of hepatic TG secretion in WT (n = 10) and PNPLA3-I148M-KI (n = 7) mice upon administration of Poloxomer-407 (o) Data from (n) represented as secretion rate per hour. All error bars represent mean ± SD. *p < 0.05, **p < 0.01, ***p < 0.001 ****p < 0.0001, two-sided t test. Specific p values: a p = 0.0445. b p = 2.16E-04. c 14:0, p = 8.65E-04; 16:0, p = 5.10E-04; 16:1, p = .00215; 18:0, p = 1.75E-04; 18:1, p = 2.91E-04; 18:2, p = 2.36E-05; 18:3, p = 1.89E-04; 20:4, p = 0.434. d 14:0, p = 0.00386; 16:0, p = 0.6.23E-04; 18:1, p = 0.573; 18:2, p = 0.611; 18:3, p = 0.0700; 20:4, p = 0.00793. e p = 0.0406. f PE, p = 0.0487; PC, p = 0.0258. g 16:0, p = 0.0801; 18:2, p = 0.00376; 20:4, p = 0.00670. h 18:2, p = 0.0277; 20:3, p = 0.0618; 20:4, p = 0.114; 22:5, p = 0.0110. i 16:0, p = 0.00707; 18:1, p = 0.126; 18:2, p = 0.00415; 20:4, p = 0.021. j 18:0, p = 0.00761; 18:2, p = 3.43E-06; 20:4, p = 0.0429; 22:5, p = 0.00981. k p = 2.96E-04. l p = 1.60E-04. m p = 0.0223. n 1 h, p = 0.731; 2 h, p = 0.0269; 3 h, p = 4.19E-04. o p = 0.000522.

References

    1. Younossi ZM, et al. The economic and clinical burden of nonalcoholic fatty liver disease in the United States and Europe. Hepatology. 2016;64:1577–1586. doi: 10.1002/hep.28785. - DOI - PubMed
    1. Loomba R, Sanyal AJ. The global NAFLD epidemic. Nat. Rev. Gastroenterol. Hepatol. 2013;10:686–690. doi: 10.1038/nrgastro.2013.171. - DOI - PubMed
    1. Pafili K, Roden M. Nonalcoholic fatty liver disease (NAFLD) from pathogenesis to treatment concepts in humans. Mol. Metab. 2021;50:101122. doi: 10.1016/j.molmet.2020.101122. - DOI - PMC - PubMed
    1. Heeren J, Scheja L. Metabolic-associated fatty liver disease and lipoprotein metabolism. Mol. Metab. 2021;50:101238. doi: 10.1016/j.molmet.2021.101238. - DOI - PMC - PubMed
    1. Mashek DG, et al. Hepatic lipid droplet biology: Getting to the root of fatty liver. Hepatology. 2015;62:964–967. doi: 10.1002/hep.27839. - DOI - PMC - PubMed