

A single-cell and spatial RNA-seq database for Alzheimer's disease (ssREAD)
- PMID: 38844475
- PMCID: PMC11156951
- DOI: 10.1038/s41467-024-49133-z
A single-cell and spatial RNA-seq database for Alzheimer's disease (ssREAD)
Abstract
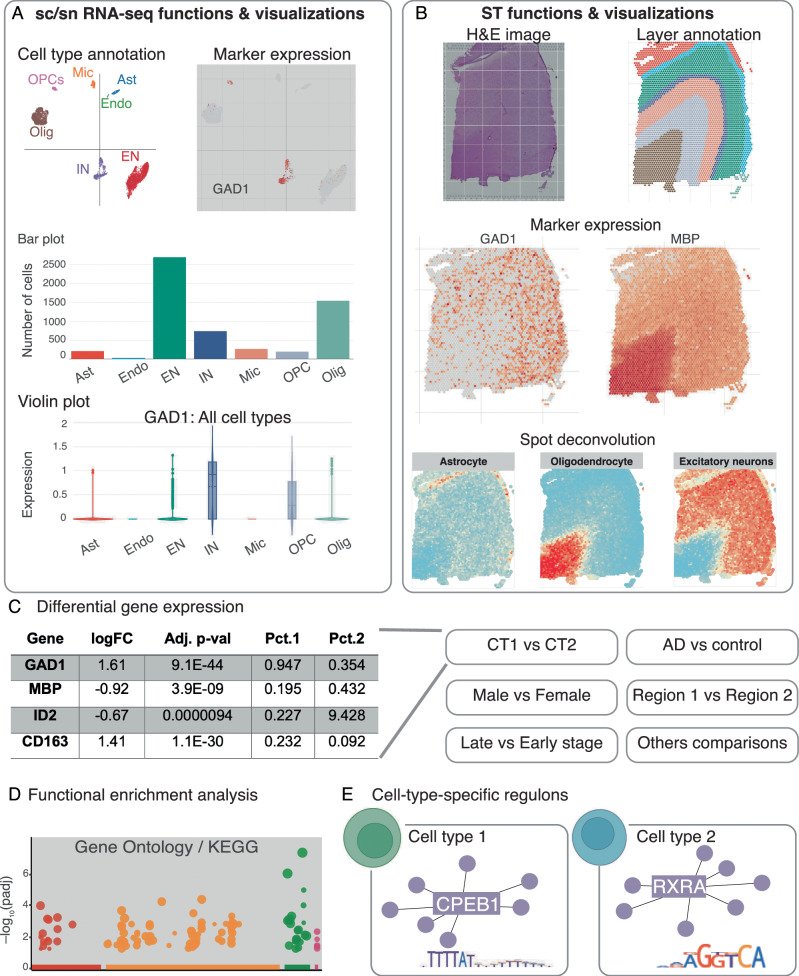
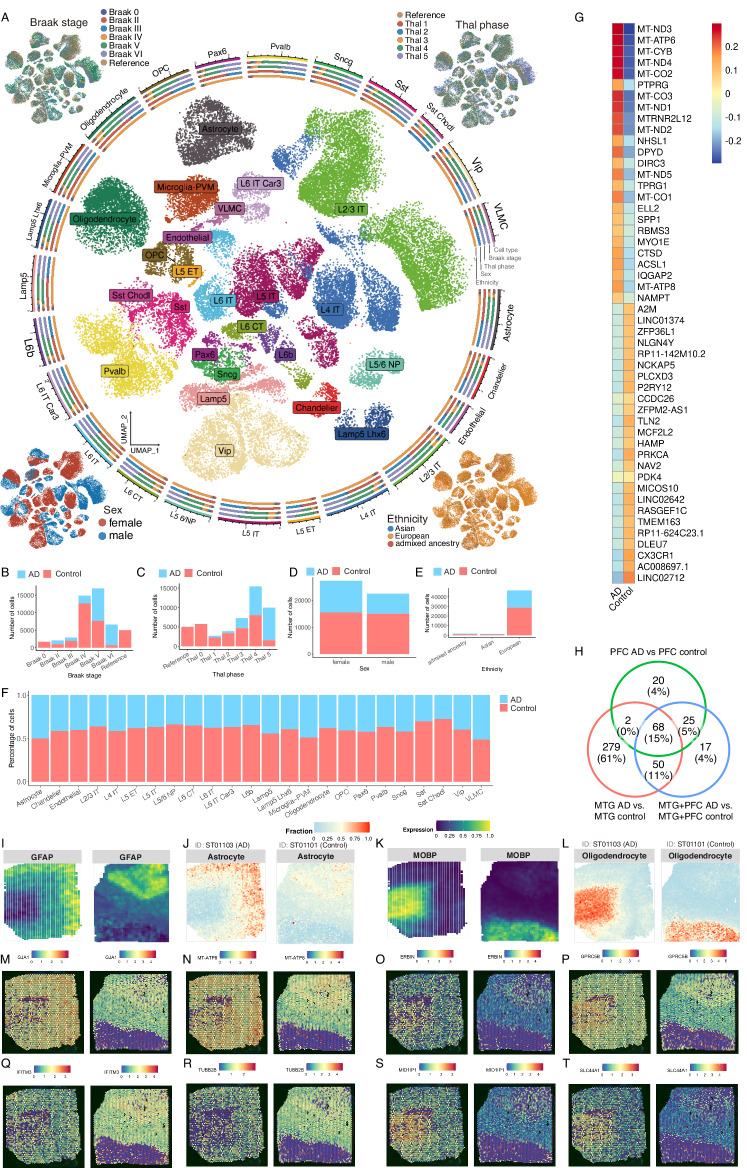
Alzheimer's Disease (AD) pathology has been increasingly explored through single-cell and single-nucleus RNA-sequencing (scRNA-seq & snRNA-seq) and spatial transcriptomics (ST). However, the surge in data demands a comprehensive, user-friendly repository. Addressing this, we introduce a single-cell and spatial RNA-seq database for Alzheimer's disease (ssREAD). It offers a broader spectrum of AD-related datasets, an optimized analytical pipeline, and improved usability. The database encompasses 1,053 samples (277 integrated datasets) from 67 AD-related scRNA-seq & snRNA-seq studies, totaling 7,332,202 cells. Additionally, it archives 381 ST datasets from 18 human and mouse brain studies. Each dataset is annotated with details such as species, gender, brain region, disease/control status, age, and AD Braak stages. ssREAD also provides an analysis suite for cell clustering, identification of differentially expressed and spatially variable genes, cell-type-specific marker genes and regulons, and spot deconvolution for integrative analysis. ssREAD is freely available at https://bmblx.bmi.osumc.edu/ssread/ .
© 2024. The Author(s).
Conflict of interest statement
The authors declare no competing interests.
Figures


Update of
-
A Single-cell and Spatial RNA-seq Database for Alzheimer's Disease (ssREAD).bioRxiv [Preprint]. 2024 Apr 22:2023.09.08.556944. doi: 10.1101/2023.09.08.556944. bioRxiv. 2024. Update in: Nat Commun. 2024 Jun 6;15(1):4710. doi: 10.1038/s41467-024-49133-z. PMID: 37745592 Free PMC article. Updated. Preprint.
Similar articles
-
A Single-cell and Spatial RNA-seq Database for Alzheimer's Disease (ssREAD).bioRxiv [Preprint]. 2024 Apr 22:2023.09.08.556944. doi: 10.1101/2023.09.08.556944. bioRxiv. 2024. Update in: Nat Commun. 2024 Jun 6;15(1):4710. doi: 10.1038/s41467-024-49133-z. PMID: 37745592 Free PMC article. Updated. Preprint.
-
Exploring the molecular characterization of PANoptosis-related genes with features of immune dysregulation in Alzheimer's disease based on bulk and single-nuclei RNA sequencing.Metab Brain Dis. 2025 Jan 22;40(1):109. doi: 10.1007/s11011-025-01540-x. Metab Brain Dis. 2025. PMID: 39841296
-
Benchmarking mapping algorithms for cell-type annotating in mouse brain by integrating single-nucleus RNA-seq and Stereo-seq data.Brief Bioinform. 2024 May 23;25(4):bbae250. doi: 10.1093/bib/bbae250. Brief Bioinform. 2024. PMID: 38796691 Free PMC article.
-
Comprehensive analyses of brain cell communications based on multiple scRNA-seq and snRNA-seq datasets for revealing novel mechanism in neurodegenerative diseases.CNS Neurosci Ther. 2023 Oct;29(10):2775-2786. doi: 10.1111/cns.14280. Epub 2023 Jun 2. CNS Neurosci Ther. 2023. PMID: 37269061 Free PMC article. Review.
-
Comprehensive review on single-cell RNA sequencing: A new frontier in Alzheimer's disease research.Ageing Res Rev. 2024 Sep;100:102454. doi: 10.1016/j.arr.2024.102454. Epub 2024 Aug 12. Ageing Res Rev. 2024. PMID: 39142391 Review.
Cited by
-
Spatial mapping of Alzheimer's disease across genetic subtypes.Nat Genet. 2024 Dec;56(12):2592-2593. doi: 10.1038/s41588-024-01895-4. Nat Genet. 2024. PMID: 39587362 No abstract available.
-
Sex-dependent molecular landscape of Alzheimer's disease revealed by large-scale single-cell transcriptomics.Alzheimers Dement. 2025 Feb;21(2):e14476. doi: 10.1002/alz.14476. Epub 2024 Dec 31. Alzheimers Dement. 2025. PMID: 39737748 Free PMC article.
-
Integrating spatially-resolved transcriptomics data across tissues and individuals: challenges and opportunities.ArXiv [Preprint]. 2024 Aug 1:arXiv:2408.00367v1. ArXiv. 2024. Update in: Small Methods. 2025 May;9(5):e2401194. doi: 10.1002/smtd.202401194. PMID: 39130195 Free PMC article. Updated. Preprint.
-
A Single-cell and Spatial RNA-seq Database for Alzheimer's Disease (ssREAD).bioRxiv [Preprint]. 2024 Apr 22:2023.09.08.556944. doi: 10.1101/2023.09.08.556944. bioRxiv. 2024. Update in: Nat Commun. 2024 Jun 6;15(1):4710. doi: 10.1038/s41467-024-49133-z. PMID: 37745592 Free PMC article. Updated. Preprint.
-
Utilization of precision medicine digital twins for drug discovery in Alzheimer's disease.Neurotherapeutics. 2025 Apr;22(3):e00553. doi: 10.1016/j.neurot.2025.e00553. Epub 2025 Feb 17. Neurotherapeutics. 2025. PMID: 39965994 Free PMC article. Review.
References
MeSH terms
Grants and funding
LinkOut - more resources
Full Text Sources
Medical
