

Exploring the relationship between heavy metals and diabetic retinopathy: a machine learning modeling approach
- PMID: 38844504
- PMCID: PMC11156935
- DOI: 10.1038/s41598-024-63916-w
Exploring the relationship between heavy metals and diabetic retinopathy: a machine learning modeling approach
Abstract
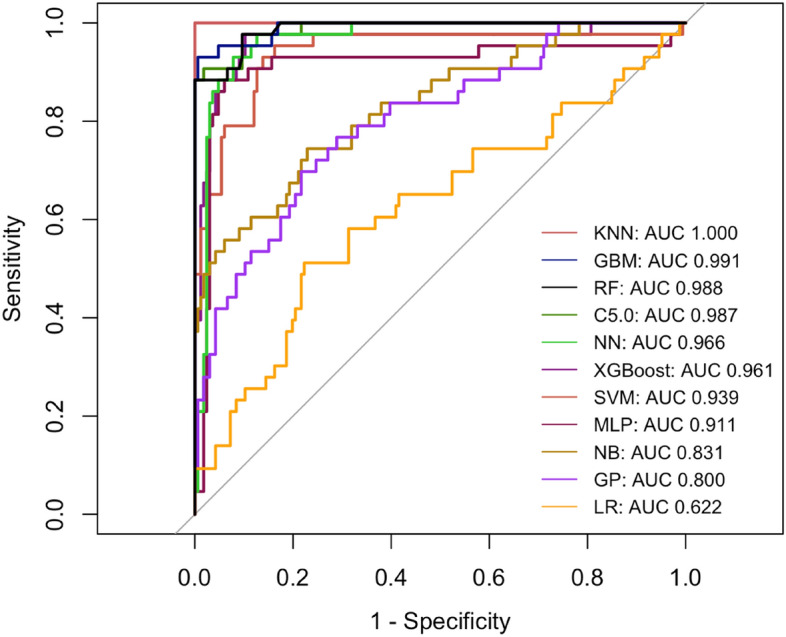
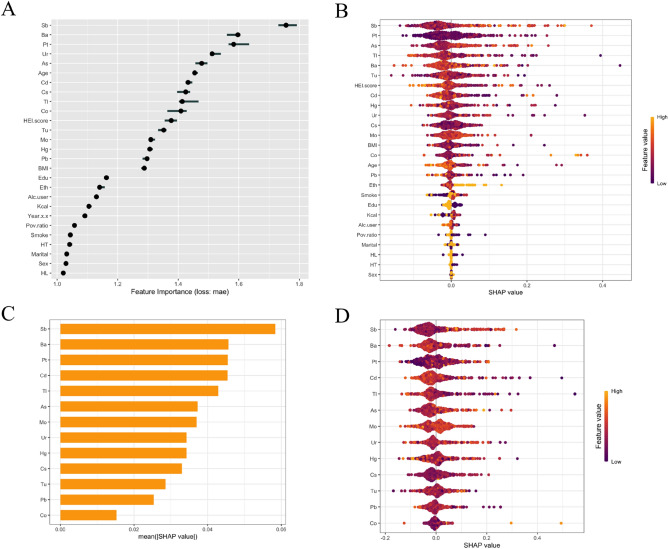
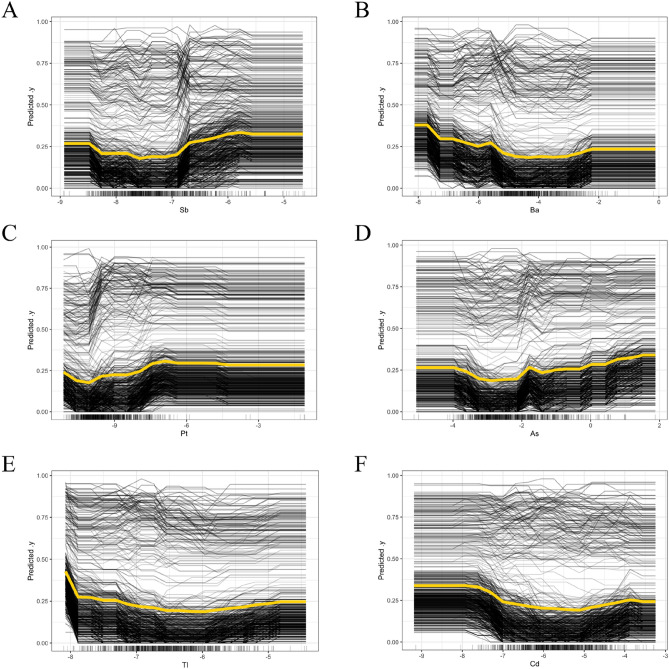
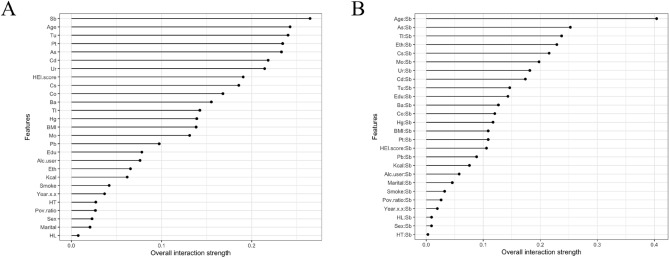
Diabetic retinopathy (DR) is one of the leading causes of adult blindness in the United States. Although studies applying traditional statistical methods have revealed that heavy metals may be essential environmental risk factors for diabetic retinopathy, there is a lack of analyses based on machine learning (ML) methods to adequately explain the complex relationship between heavy metals and DR and the interactions between variables. Based on characteristic variables of participants with and without DR and heavy metal exposure data obtained from the NHANES database (2003-2010), a ML model was developed for effective prediction of DR. The best predictive model for DR was selected from 11 models by receiver operating characteristic curve (ROC) analysis. Further permutation feature importance (PFI) analysis, partial dependence plots (PDP) analysis, and SHapley Additive exPlanations (SHAP) analysis were used to assess the model capability and key influencing factors. A total of 1042 eligible individuals were randomly assigned to two groups for training and testing set of the prediction model. ROC analysis showed that the k-nearest neighbour (KNN) model had the highest prediction performance, achieving close to 100% accuracy in the testing set. Urinary Sb level was identified as the critical heavy metal affecting the predicted risk of DR, with a contribution weight of 1.730632 ± 1.791722, which was much higher than that of other heavy metals and baseline variables. The results of the PDP analysis and the SHAP analysis also indicated that antimony (Sb) had a more significant effect on DR. The interaction between age and Sb was more significant compared to other variables and metal pairs. We found that Sb could serve as a potential predictor of DR and that Sb may influence the development of DR by mediating cellular and systemic senescence. The study revealed that monitoring urinary Sb levels can be useful for early non-invasive screening and intervention in DR development, and also highlighted the important role of constructed ML models in explaining the effects of heavy metal exposure on DR.
Keywords: Diabetic retinopathy; Factors; Heavy metal; Machine learning; Prediction.
© 2024. The Author(s).
Conflict of interest statement
The authors declare no competing interests.
Figures
Similar articles
-
Development of a machine learning model related to explore the association between heavy metal exposure and alveolar bone loss among US adults utilizing SHAP: a study based on NHANES 2015-2018.BMC Public Health. 2025 Feb 4;25(1):455. doi: 10.1186/s12889-025-21658-y. BMC Public Health. 2025. PMID: 39905341 Free PMC article.
-
Effects of Various Heavy Metal Exposures on Insulin Resistance in Non-diabetic Populations: Interpretability Analysis from Machine Learning Modeling Perspective.Biol Trace Elem Res. 2024 Dec;202(12):5438-5452. doi: 10.1007/s12011-024-04126-3. Epub 2024 Feb 26. Biol Trace Elem Res. 2024. PMID: 38409445
-
Machine learning model for age-related macular degeneration based on heavy metals: The National Health and Nutrition Examination Survey 2005 to 2008.Sci Rep. 2024 Nov 6;14(1):26913. doi: 10.1038/s41598-024-78412-4. Sci Rep. 2024. PMID: 39506000 Free PMC article.
-
Performance and Limitation of Machine Learning Algorithms for Diabetic Retinopathy Screening: Meta-analysis.J Med Internet Res. 2021 Jul 3;23(7):e23863. doi: 10.2196/23863. J Med Internet Res. 2021. PMID: 34407500 Free PMC article. Review.
-
Deep Learning-Based Algorithms in Screening of Diabetic Retinopathy: A Systematic Review of Diagnostic Performance.Ophthalmol Retina. 2019 Apr;3(4):294-304. doi: 10.1016/j.oret.2018.10.014. Epub 2018 Nov 3. Ophthalmol Retina. 2019. PMID: 31014679
Cited by
-
Developing machine learning models for predicting cardiovascular disease survival based on heavy metal serum and urine levels.Front Public Health. 2025 May 21;13:1582779. doi: 10.3389/fpubh.2025.1582779. eCollection 2025. Front Public Health. 2025. PMID: 40469589 Free PMC article.
-
Manganese exposure and its U-shaped relationship with diabetic retinopathy: analysis of NHANES 2011-2020.Front Nutr. 2025 Jun 19;12:1619751. doi: 10.3389/fnut.2025.1619751. eCollection 2025. Front Nutr. 2025. PMID: 40612319 Free PMC article.
-
Association of serum selenium levels with diabetic retinopathy: NHANES 2011-2016.Front Med (Lausanne). 2025 Apr 4;12:1546214. doi: 10.3389/fmed.2025.1546214. eCollection 2025. Front Med (Lausanne). 2025. PMID: 40255593 Free PMC article.
References
-
- Blindness, G. B. D., Vision Impairment, C., & Vision Loss Expert Group of the Global Burden of Disease S. Causes of blindness and vision impairment in 2020 and trends over 30 years, and prevalence of avoidable blindness in relation to VISION 2020: the Right to Sight: an analysis for the Global Burden of Disease Study. Lancet Glob Health. 2021;9(2):e144-e60. - PMC - PubMed
-
- Zong GW, Wang WY, Zheng J, Zhang W, Luo WM, Fang ZZ, et al. A metabolism-based interpretable machine learning prediction model for diabetic retinopathy risk: A cross-sectional study in chinese patients with type 2 diabetes. J. Diabetes Res. 2023;2023:3990035. doi: 10.1155/2023/3990035. - DOI - PMC - PubMed
MeSH terms
Substances
LinkOut - more resources
Full Text Sources
Medical
