. 2024 Dec 2;193(12):1832-1839.
doi: 10.1093/aje/kwae106.

Addressing current limitations of household transmission studies by collecting contact data

Affiliations

Addressing current limitations of household transmission studies by collecting contact data

Maylis Layan et al. Am J Epidemiol. .

Abstract

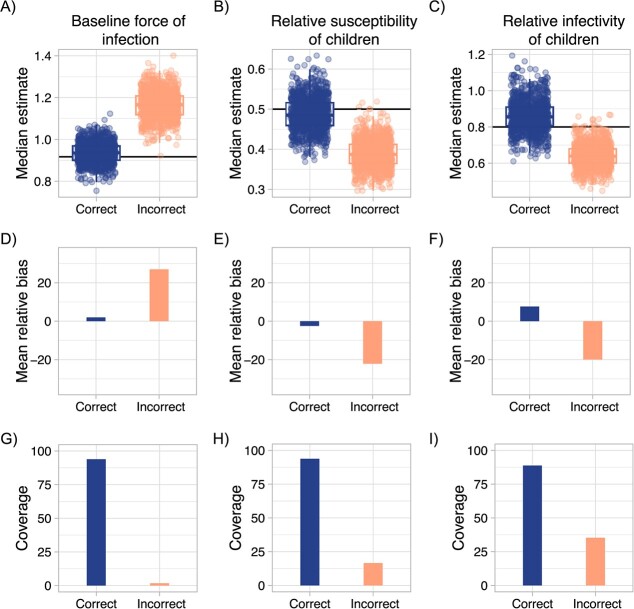
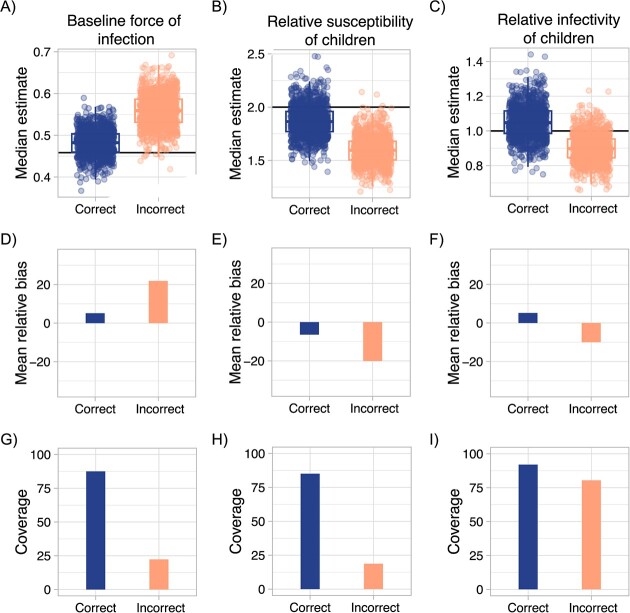
Modeling studies of household transmission data have helped characterize the role of children in influenza and coronavirus disease 2019 (COVID-19) epidemics. However, estimates from these studies may be biased since they do not account for the heterogeneous nature of household contacts. Here, we quantified the impact of contact heterogeneity between household members on the estimation of child relative susceptibility and infectivity. We simulated epidemics of severe acute respiratory syndrome coronavirus 2 (SARS-CoV-2)-like and influenza virus-like infections in a synthetic population of 1000 households, assuming heterogeneous contact levels. Relative contact frequencies were derived from a household contact study according to which contacts are more frequent in the father-mother pair, followed by the child-mother, child-child, and finally child-father pairs. Child susceptibility and infectivity were then estimated while accounting for heterogeneous contacts or not. When ignoring contact heterogeneity, child relative susceptibility was underestimated by approximately 20% in the two disease scenarios. Child relative infectivity was underestimated by 20% when children and adults had different infectivity levels. These results are sensitive to our assumptions of European-style household contact patterns; but they highlight that household studies collecting both disease and contact data are needed to assess the role of complex household contact behavior on disease transmission and improve estimation of key biological parameters.

Keywords: household study; infectivity; modeling; parameter estimation; respiratory infections; simulation; susceptibility.


Conflict of interest statement

B.J.C. has consulted for AstraZeneca, Fosun Pharma, GSK, Haleon, Moderna, Pfizer, Roche, and Sanofi Pasteur. The authors report no other potential conflicts of interest.

Figures

Figure 1
Figure 1
Impact of contact patterns on the estimation of within household transmission, child infectivity, and child susceptibility in severe acute respiratory syndrome coronavirus 2 (SARS-CoV-2) infections. (A-C) Posterior median estimates of the transmission rate in father–mother pairs, child relative susceptibility, and child relative infectivity for the correct (heterogeneous mixing) inference model in dark blue (n = 1000), and the incorrect (homogeneous) inference model in light orange (n = 1000). The black horizontal line corresponds to the true value used in the simulations. (D-F) Relative bias between the posterior median estimate and the true value for the transmission rate in father–mother pairs, child relative susceptibility, and child relative infectivity. Positive values indicate overestimation and negative values underestimation. Relative bias is expressed in percentage. (G-I) Coverage of the transmission rate in father–mother pairs, child relative susceptibility, and child relative infectivity. Coverage is expressed in percentage.
Figure 2
Figure 2
Impact of contact patterns on the estimation of within household transmission, child infectivity, and child susceptibility in influenza virus infections. (A-C) Posterior median estimates of the transmission rate in father–mother pairs, child relative susceptibility, and child relative infectivity for the correct (heterogeneous mixing) inference model in dark blue (n = 1000), and the incorrect (homogeneous) inference model in light orange (n = 1000). The black horizontal line corresponds to the true value used in the simulations. (D-F) Relative bias between the posterior median estimate and the true value for the transmission rate in father–mother pairs, child relative susceptibility, and child relative infectivity. Positive values indicate overestimation and negative values underestimation. Relative bias is expressed in percentage. (G-I) Coverage of the transmission rate in father–mother pairs, child relative susceptibility, and child relative infectivity. Coverage is expressed in percentage.

Similar articles

Cited by

References

    1. Wang CC, Prather KA, Sznitman J, et al. . Airborne transmission of respiratory viruses. Science. 2021;373:6558. 10.1126/science.abd9149 - DOI - PMC - PubMed
    1. Longini IMJR, Koopman JS, Monto AS, et al. . Estimating household and community transmission parameters for influenza. Am J Epidemiol. 1982;115(5):736-751. 10.1093/oxfordjournals.aje.a113356 - DOI - PubMed
    1. Bi Q, Lessler J, Eckerle I, et al. . Insights into household transmission of SARS-CoV-2 from a population-based serological survey. Nat Commun. 2021;12(1):3643. 10.1038/s41467-021-23733-5 - DOI - PMC - PubMed
    1. Tsang TK, Lau LLH, Cauchemez S, et al. . Household transmission of influenza virus. Trends Microbiol. 2016;24(2):123-133. 10.1016/J.TIM.2015.10.012 - DOI - PMC - PubMed
    1. Kombe IK, Munywoki PK, Baguelin M, et al. . Model-based estimates of transmission of respiratory syncytial virus within households. Epidemics. 2019;27:1-11. 10.1016/j.epidem.2018.12.001 - DOI - PMC - PubMed