. 2024 Jun;13(6):e12446.
doi: 10.1002/jev2.12446.

Amniotic fluid stem cell-derived extracellular vesicles educate type 2 conventional dendritic cells to rescue autoimmune disorders in a multiple sclerosis mouse model

Affiliations

Amniotic fluid stem cell-derived extracellular vesicles educate type 2 conventional dendritic cells to rescue autoimmune disorders in a multiple sclerosis mouse model

Giorgia Manni et al. J Extracell Vesicles. 2024 Jun.

Abstract

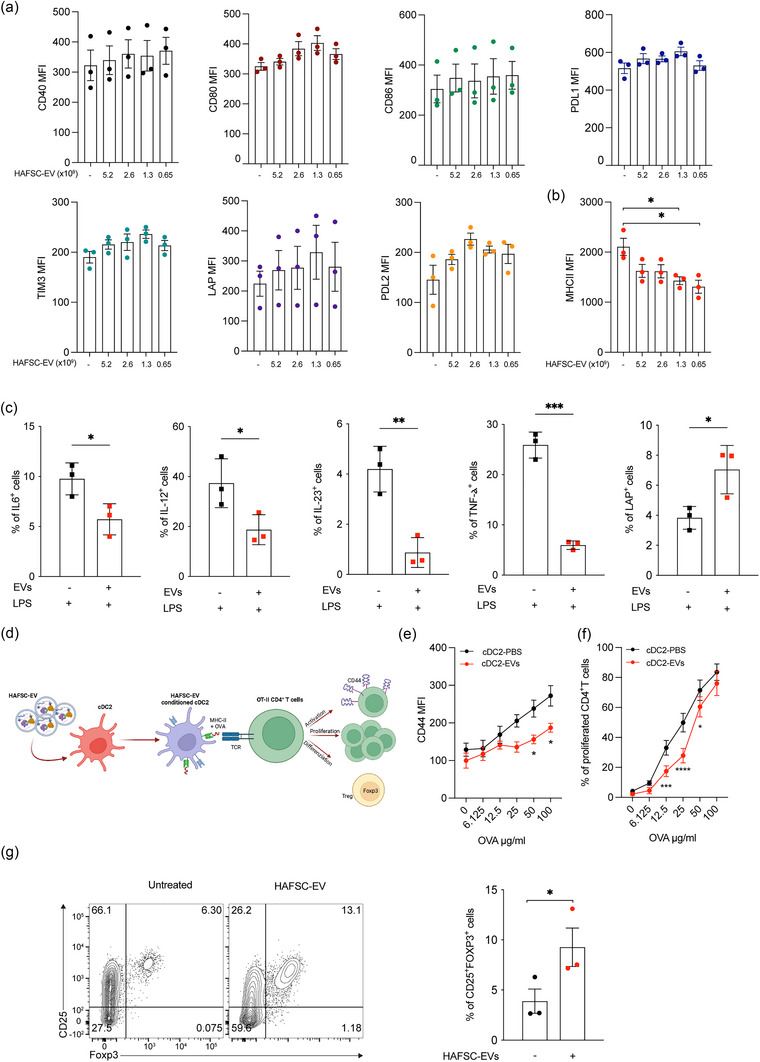
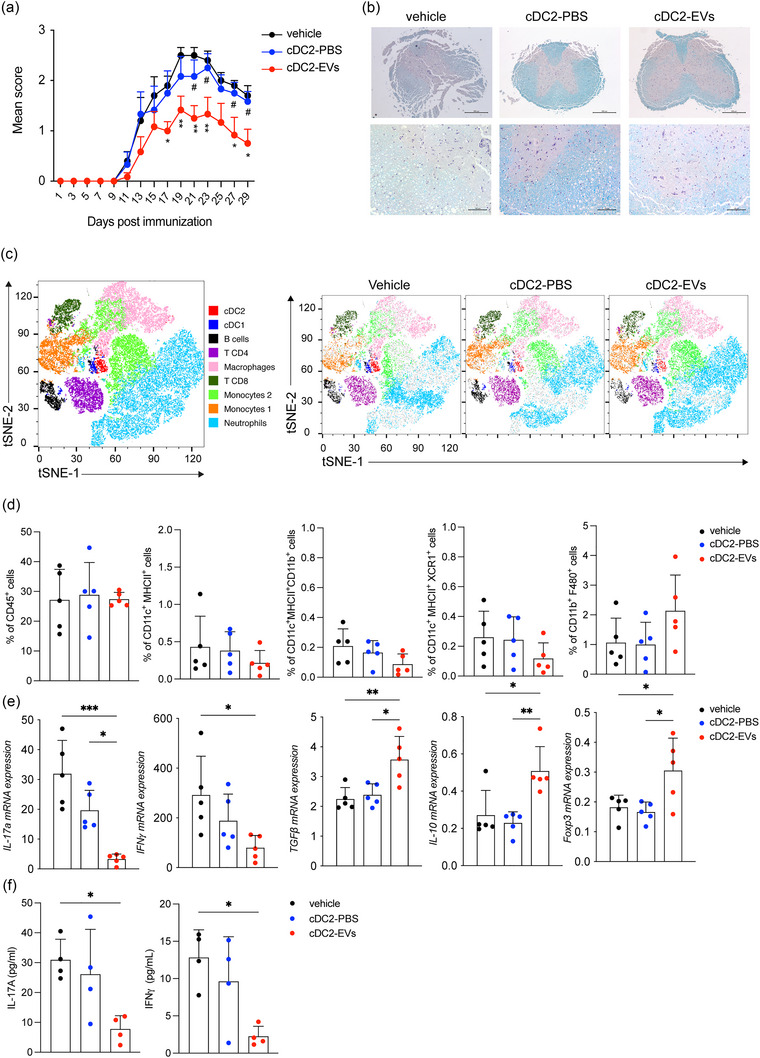
Dendritic cells (DCs) are essential orchestrators of immune responses and represent potential targets for immunomodulation in autoimmune diseases. Human amniotic fluid secretome is abundant in immunoregulatory factors, with extracellular vesicles (EVs) being a significant component. However, the impact of these EVs on dendritic cells subsets remain unexplored. In this study, we investigated the interaction between highly purified dendritic cell subsets and EVs derived from amniotic fluid stem cell lines (HAFSC-EVs). Our results suggest that HAFSC-EVs are preferentially taken up by conventional dendritic cell type 2 (cDC2) through CD29 receptor-mediated internalization, resulting in a tolerogenic DC phenotype characterized by reduced expression and production of pro-inflammatory mediators. Furthermore, treatment of cDC2 cells with HAFSC-EVs in coculture systems resulted in a higher proportion of T cells expressing the regulatory T cell marker Foxp3 compared to vehicle-treated control cells. Moreover, transfer of HAFSC-EV-treated cDC2s into an EAE mouse model resulted in the suppression of autoimmune responses and clinical improvement. These results suggest that HAFSC-EVs may serve as a promising tool for reprogramming inflammatory cDC2s towards a tolerogenic phenotype and for controlling autoimmune responses in the central nervous system, representing a potential platform for the study of the effects of EVs in DC subsets.

Keywords: amniotic fluid stem cells; autoimmune diseases; conventional dendritic cell type 2 (cDC2); dendritic cells; experimental autoimmune encephalomyelitis (EAE); extracellular vesicles; tolerogenic phenotype.


Conflict of interest statement

The authors declare no competing interests.

Figures

FIGURE 1
FIGURE 1
Characterization of EVs derived from human amniotic fluid stem cells (HAFSC‐EVs). (a) HAFSC‐EVs morphology and diameter measure by SEM. Magnification bar corresponds to 200 nm; Violin box graph displaying mean sizes of HAFSC‐EVs. (b) HAFSC‐EVs size distribution and concentration determinated by nanoparticle tracking analysis. Representative spectra are shown. Blue values correspond to the size of the main peaks in the histogram. (c) Mean and mode of particles size (nm) and (d) mean concentration of HAFSC‐EVs (number/mL) are reported in the graphs. (e) Molecular characterization of isolated HAFSC‐EVs by Western blot of specific EV markers compared to parent stem cells. Western blot analysis revealed the presence of CD81, ARF6, Actin, Tsg101, Alix and absence of Lamin‐A that is expressed only by cells. (f) Representation plot of EVs binding on murine splenocytes and human PBMCs after 6 h exposition of cells with EVs (HAFSC‐EVslow and HAFSC‐EVshigh correspond to 1.3 × 109 and 2.6 × 109 particles/1 × 106 cells). Data are represented as mean ± SD of MFI (mean fluorescent intensity). *p < 0.05; **p < 0.01 by one‐way ANOVA with Tukey's multiple comparison test.
FIGURE 2
FIGURE 2
HAFSC‐EVs uptake in immune cells. (a) Total hPBMC and murine splenocytes were treated in vitro with Dil‐HAFSC‐EV 1.3 × 109 (HAFSC‐EVlow) for 6 h, washed with PBS, stained with the fluorophore‐conjugated antibodies and analysed by flow cytometry. Two‐dimensional t‐SNE analysis (FlowJo) represents the various cell populations before and after treatment with HAFSC‐EVs and the distribution of EVs (red) on total human PBMCs and murine splenocytes (grey). Data shown are representative of three independent experiments. (b) Dil signal was registered in different immune cell populations by using antibodies directed against specific immune cell markers and analysed by Flow Jo. The most significant EVs uptake was detected in cDC2 cells both in human and murine samples. Data are represented as mean ± SD of MFI (mean fluorescent intensity) of three experiments (**p < 0.01, ***p < 0.001, ****p < 0.0001 two‐way ANOVA with Bonferroni's multiple comparison test). (c) Dil‐HAFSC‐EV or vehicle were injected intravenously into mice, and spleens were harvested after 24 h (see also in Figure S2). Dil signal was evaluated ex‐vivo by flow cytometry in different immune cell populations. Data are represented as mean ± SD of MFI (mean fluorescent intensity) of three independent experiments (****p < 0.0001 two‐way ANOVA with Bonferroni's multiple comparison test). (d) Vesicles uptake was measured in bone marrow derived DCs (cDC1 and cDC2) after 6 h incubation with 1.3 × 109 (HAFSC‐EVslow) and 2.6 × 109 (HAFSC‐EVshigh) Dil‐HAFSC‐EVs /1 × 106 cells. Indicated is the mean ± SD of MFI of cDC1 and cDC2, detected by anti‐CD24 and anti‐CD172, respectively, positive for Dil‐HAFSC‐EVs (showed histograms is one experiment representative of three) (*p < 0.05 **p < 0.001 two‐way ANOVA with Tukey recommended multiple comparison test). (e) Vesicles uptake by cDC1 and cDC2 derived from bone marrow analysed by SEM (scanning electron microscopy) after 6 h EVs treatment. Representative images of three different experiments. Magnification bar corresponds to 1 μm. (f) Confocal immunofluorescence images of cDC1 and cDC2 cells treated with Dil‐labelled‐HAFSC‐EVs for 6 hours, controls were treated with vehicle. Pictures show representative confocal fluorescence images of three independent experiments. Magnification bar corresponds to 10 μm.
FIGURE 3
FIGURE 3
Integrin CD29 mediates HAFSC‐EVs trafficking to cDC2. (a) Heatmap displaying gene expression of ITGB1 and ITGB3 across diverse immune cell populations in mouse splenocytes (GSE108097) and human PBMC (GSE107011). Log‐transformed transcripts per million (log2(TPM+1)) values were used. Colour scale indicates relative expression levels (red for higher, blue for lower). (b) Itgß1 protein expression on immune cells by FACS analysis on total murine splenocytes (n = 4) and human PBMC (n = 7) reported as MFI ± SD. (c, d) CD29 expression by murine and human cDC1 and cDC2 reported as percentage of CD29 positive cells and as MFI ± SD (*p < 0.05 **p < 0.005, unpaired t‐test, two‐tailed). (e, f) Flow cytometry analysis of EVs‐Dil+ murine and human cDC2 after treatment with CD29 neutralizing or Isotype antibody (as control). Data are shown as mean ± SD of MFI or percentage of Dil+cDC2 (n = 3, *p < 0.05; **p < 0.01, ***p < 0.001 by one‐way ANOVA with Bonferroni's multiple comparison test).
FIGURE 4
FIGURE 4
Analysis of HAFSC‐EVs composition. (a) Comparison of lipids composition of HAFSCs and HAFSC‐EVs membrane. Relative abundances for each lipid classes in cells and EVs: TG Triacylglycerols, PC Glycerophosphocholines, LPC Monoacylglycerophosphocholines, PE Glycerophosphoethanolamines, PS Glycerophosphoserines, Cer Ceramides, SM Sphingomyelins, SE Sterol Lipids, Other Sphingolipids. (b) The Venn diagram of proteins identified in HAFSC‐EVs and EVs isolated from biofluids (amniotic fluid, aqueous humour, plasma, serum, saliva, urine) and placenta. (c) Enrichment analysis of site of expression of proteins identified in the HAFSC‐EVs performed by Funrich. (d) Gene Ontology terms and Reactome Pathways enrichment analyses performed by WebGestalt. Among the 10 most enriched functional terms listed in the Table S1 sheet “Enriched CC_GO TERMS”, the first seven are reported in the histograms. Within the MF_GO terms, only six terms were found significantly enriched. CC: Cell Component; BP: Biological Process; MF: Molecular Function. (e) Network generated in Ingenuity Pathway Analysis (IPA) for proteins identified in HAFSC‐EVs. The meaning of the shapes (nodes) and type of interactions (edges) are defined in the graphical legends. Blu nodes are proteins found in HAFSC‐EVs; green nodes indicate functional activities in which HAFSC‐EVs proteins are involved; pink nodes are predicted direct targets of HAFSC‐EVs proteins. (f) Mixed phenotype‐miRNAs network generated by Ingenuity Pathway Analysis (IPA) for miRNAs identified in HAFSC‐EVs. 31 miRNAs were associated to inflammation; blue nodes are associated with chronic inflammatory disorders while red nodes are implicated in inflammation of absolute anatomical region or body cavity.
FIGURE 5
FIGURE 5
cDC2 conditioning by HAFSC‐EVs treatment. (a, b) Analysis of cDC2 activation markers was performed by FACS by overnight incubation with various amounts of HAFSC‐EVs as shown. Data are shown as mean ± SD of MFI (n = 3, *p < 0.05; by one‐way ANOVA with Tukey recommended multiple comparison test). (c) Analysis of cytokines produced by bone marrow derived cDC2 pre‐treated overnight with HAFSC‐EVs and subsequently treated with LPS (1 ug/mL) for 6 h in the presence of PMA/Ionomycin and Brefeldin‐A. Percentage of cells positive for IL‐6, IL‐12, IL‐23, TNF‐α, and LAP are shown as mean ± SD (n = 3, *p < 0.05; ***p < 0.001 by unpaired t‐test, two‐tailed). (d) Schematic representation of co‐culture characteristics between EVs‐conditionated‐cDC2 and mouse CD4+ T cells. (e) OT.II CD4+ T cells were co‐cultured with cDC2 pretreated with HAFSC‐EVslow overnight as indicated in D, in the presence of different concentrations of soluble OVA protein. Data are shown as MFI (n = 3, *p < 0.05; by two‐way ANOVA with Bonferroni's multiple comparison test). (f) cDC2, treated as in D, were assayed for presentation to CFSE‐labelled OT‐II T cells in the presence of different concentrations of soluble OVA protein. Data are shown as percentage of CFSECD4+CD44+ TCRVα2+ as mean ± SD (n = 3, *p < 0.05; ***p < 0.001, ****p < 0.0001, two‐way ANOVA with Bonferroni's multiple comparison test). (g) CD4+ T cells were purified from the spleen of wild type mice and co‐cultured with cDC2 pre‐treated with HAFSC‐EVslow. Three days after Foxp3 expression was evaluated by flow cytometry. Data are shown as mean ± SD of percentage of CD25+Foxp3+ cells (n = 3, *p < 0.05; by unpaired t‐test, two‐tailed). Dots represent each individual mouse.
FIGURE 6
FIGURE 6
HAFSC‐EVs conditioned cDC2 induce immune‐regulatory functions in EAE. (a) EAE score in mice i.v injected with vehicle, cDC2 pretreated with vehicle (PBS) or HAFSC‐EVslow. Data are mean of daily EAE scores ± SD, n = 2, with n = 7 mice per group. *p < 0.05, **p < 0.01 (vehicle vs. cDC2‐EV), # p < 0.05 (cDC2‐PBS vs. cDC2‐EV) by two‐way ANOVA followed by Tukey recommended multiple comparison test. (b) Spinal cords were collected at sacrifice (30 days from immunization) from three mice per group, sectioned and stained with luxol fast blue for myelin. Scale Bar 500 and 100 μM. (c) tSNE plots of immune cells analysed in spinal cords of mice with EAE treated with vehicle, cDC2‐PBS and cDC2‐EVs showing nine clusters, coloured by density clustering and annotated by cell‐type identity. tSNE analysis was performed by FlowJo software. (d) Statistical analysis of immune infiltrate in spinal cords by flow cytometry. Data are reported as mean ± SD of the frequency of CD45+ immune cells. (e) Gene expression of IL‐17a, IFN‐𝛾, TGFβ, IL‐10, and Foxp3 in cervical lymph nodes activated in vitro with MOG peptide for 24 h and detected by Real Time PCR. mRNA for various cytokine transcripts were normalized by ß‐ACTIN expression. Fold change is relative to nonactivated lymph nodes. Data are mean ± SD *p < 0.05, **p < 0.01, ***p < 0.001, one‐way ANOVA followed by Bonferroni multiple comparison test. (f) Quantification of proteins in supernatants of cervical lymph nodes activated as in E and detected by ELISA. Data are means ± SD *p < 0.05, by one‐way ANOVA followed by Bonferroni multiple comparison test.

References

    1. Akbar, N. , Paget, D. , & Choudhury, R. P. (2021). Extracellular vesicles in innate immune cell programming. Biomedicines, 9, 713. - PMC - PubMed
    1. Anderson, D. A. 3rd , Dutertre, C. A. , Ginhoux, F. , & Murphy, K. M. (2021). Genetic models of human and mouse dendritic cell development and function. Nature Reviews Immunology, 21, 101–115. - PMC - PubMed
    1. Audiger, C. , Rahman, M. J. , Yun, T. J. , Tarbell, K. V. , & Lesage, S. (2017). The importance of dendritic cells in maintaining immune tolerance. Journal of Immunology, 198, 2223–2231. - PMC - PubMed
    1. Awasthi, A. , Carrier, Y. , Peron, J. P. , Bettelli, E. , Kamanaka, M. , Flavell, R. A. , Kuchroo, V. K. , Oukka, M. , & Weiner, H. L. (2007). A dominant function for interleukin 27 in generating interleukin 10‐producing anti‐inflammatory T cells. Nature Immunology, 8, 1380–1389. - PubMed
    1. Balbi, C. , Piccoli, M. , Barile, L. , Papait, A. , Armirotti, A. , Principi, E. , Reverberi, D. , Pascucci, L. , Becherini, P. , Varesio, L. , Mogni, M. , Coviello, D. , Bandiera, T. , Pozzobon, M. , Cancedda, R. , & Bollini, S. (2017). First characterization of human amniotic fluid stem cell extracellular vesicles as a powerful paracrine tool endowed with regenerative potential. Stem Cells Translational Medicine, 6, 1340–1355. - PMC - PubMed

MeSH terms