. 2024 Jun 6;15(1):4841.
doi: 10.1038/s41467-024-49209-w.

KSHV infection of B cells primes protective T cell responses in humanized mice

Affiliations

KSHV infection of B cells primes protective T cell responses in humanized mice

Nicole Caduff et al. Nat Commun. .

Abstract

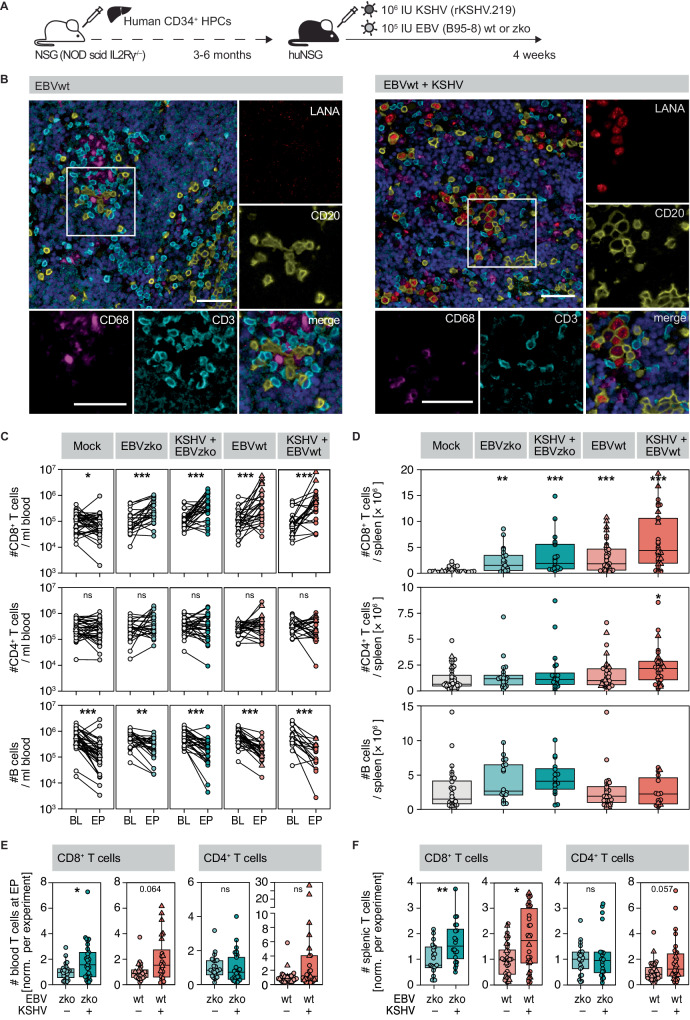
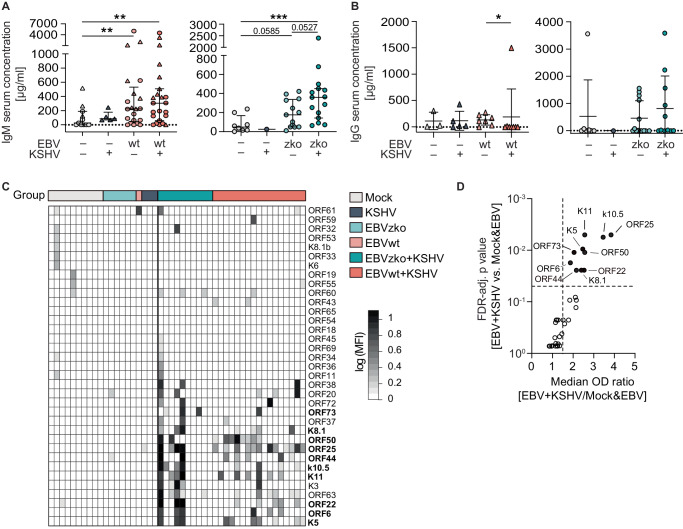
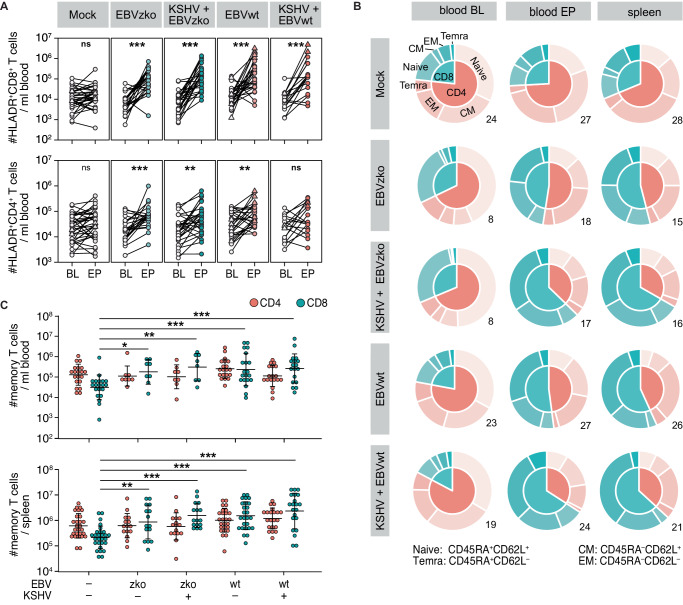
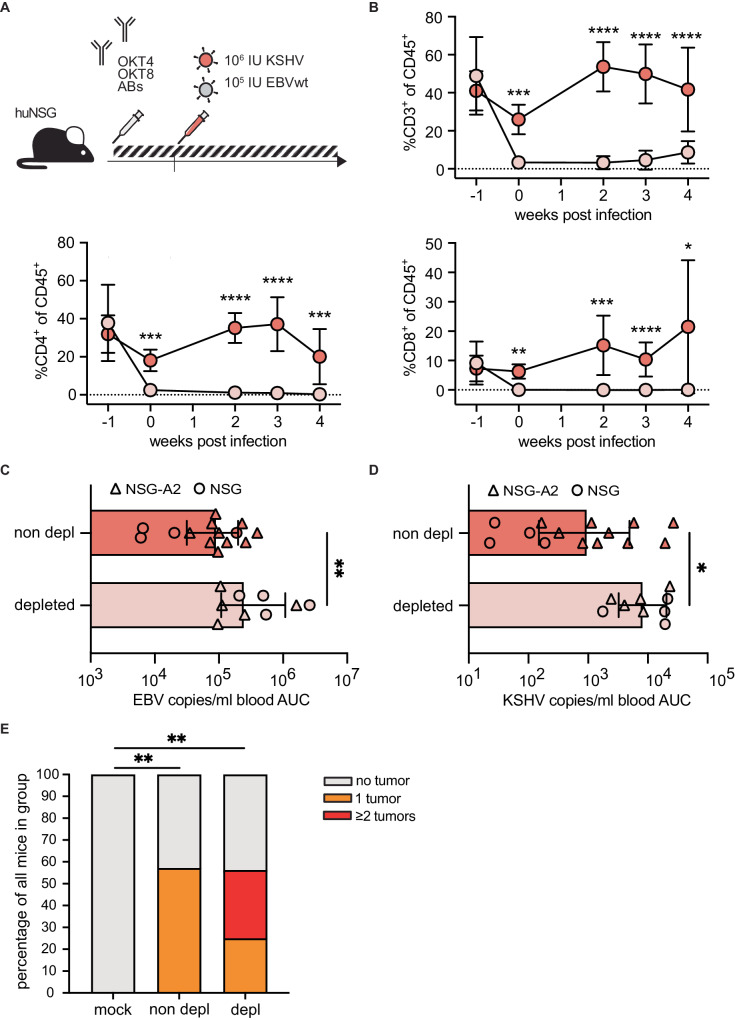
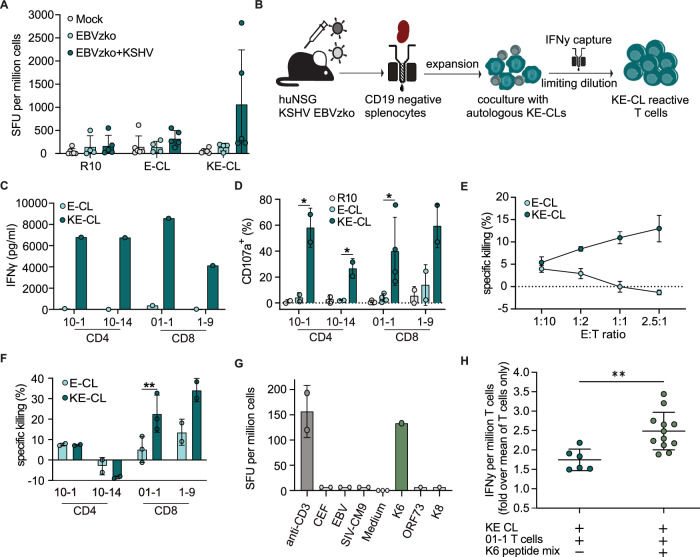
Kaposi sarcoma associated herpesvirus (KSHV) is associated with around 1% of all human tumors, including the B cell malignancy primary effusion lymphoma (PEL), in which co-infection with the Epstein Barr virus (EBV) can almost always be found in malignant cells. Here, we demonstrate that KSHV/EBV co-infection of mice with reconstituted human immune systems (humanized mice) leads to IgM responses against both latent and lytic KSHV antigens, and expansion of central and effector memory CD4+ and CD8+ T cells. Among these, KSHV/EBV dual-infection allows for the priming of CD8+ T cells that are specific for the lytic KSHV antigen K6 and able to kill KSHV/EBV infected B cells. This suggests that K6 may represent a vaccine antigen for the control of KSHV and its associated pathologies in high seroprevalence regions, such as Sub-Saharan Africa.


Conflict of interest statement

The authors declare no competing interests.

Figures

Fig. 1
Fig. 1. KSHV infection elicits an expansion of CD8+ T cells in EBV co-infected humanized mice.
A Experimental outline of EBV and KSHV infections in NSG mice reconstituted with human fetal liver derived CD34+ HPCs. Animals were infected intraperitoneally (i.p.) with KSHV and/or wild-type EBV (EBVwt), lytic replication deficient BZLF-1 knock-out EBV (EBVzko) or mock-infected with PBS at the age of three to six months and euthanized at 4 weeks post infection (p.i.) or when predetermined euthanasia criteria were met. B Co-staining of LANA with CD20, CD3 and CD68 on splenic sections of EBVwt (left) and EBVwt+KSHV (right) infected mice. C Human CD45+CD3+CD8+, CD45+CD3+CD4+ and CD45+CD19+ cells/ml blood measured before infection (baseline, BL) and at experiment termination (end point, EP). Composite data from 13 independent experiments for T cell data with N = 35 (mock), N = 24 (EBVzko), N = 28 (KSHV+EBVzko), N = 26 (EBVwt) and N = 22 (KSHV+EBVzko) mice; and from 12 independent experiments for B cell data with N = 36 (mock), N = 24 (EBVzko), N = 29 (KSHV+EBVzko), N = 28 (EBVwt) and N = 17 (KSHV+EBVwt) mice. Two sided Wilcoxon test. Significant p-values left to right: CD8: 0.04383; 5.329e-5; 5.53e-5; 0.0003636; 0.0006938; B cells: 6.657e-6; 0.002815; 1.193e-5; 5.245e-6; 3.052e-5. D Number of human CD45+CD3+CD8+, CD45+CD3+CD4+ and CD45+CD19+ cells per spleen. Composite data from 14 independent experiments for T cells with N = 34 (CD8) and 38 (CD4) (mock), N = 32 (CD8) and 21 (CD4) (EBVzko), N = 19 (KSHV+EBVzko), N = 36 (EBVwt), N = 30 (KSHV+EBVwt) mice, and 10 independent experiments for B cells with N = 28 (mock), N = 18 (EBVzko), N = 16 (KSHV+EBVzko), N = 27 (EBVwt) and N = 15 (KSHV+EBVwt) mice. Kruskal Wallis followed by Dunn’s test with Bonferroni (BF)-corrected p-values. Significant p values from left to right: CD8: 4.761e-3; 3.5799e-5; 6.577e-6; 2.116e-10; CD4: 0.006. E CD45+CD3+CD8+ and CD45+CD3+CD4+ cell numbers measured at 4 weeks p.i. in the blood or (F) spleen, normalized to the respective EBVzko or EBVwt single-infected group per experiment. Composite data of (E) 7 (EBVzko) and 8 (EBVwt) independent experiments with N = 26 (Ezko), N = 29 (KSHV+Ezko), N = 27 (Ewt), N = 24 (KSHV+Ewt). Two sided Mann Whitney U Test (MWU), significant p-values from left to right: 0.01297  (F) 6 (EBVzko) and 11 (EBVwt) independent experiments with N = 21 (Ezko), N = 20 (KSHV+Ezko), N = 36 (Ewt), N = 30 (KSHV+Ewt). Two sided MWU, significant p values from left to right: 0.008417; 0.03508. *p < 0.05, **p < 0.01, ***p < 0.001. DF Box plot hinges correspond to 25th and 75th percentiles, shown are median and Turkey Whiskers. Source data are provided as a Source data file.
Fig. 2
Fig. 2. Limited KSHV-specific humoral responses are generated in humanized mice upon KSHV infection.
A IgM serum levels of humanized NSG mice 4 weeks after i.p. infection with mock, KSHV only, EBV (wt or zko) only or EBV (wt or zko) and KSHV. 11 (EBVwt) independent experiments with serum from N = 11 (mock), N = 5 (KSHV), N = 21 (EBVwt), and N = 23 (KSHV+EBVwt) mice and 6 (EBVzko) independent experiments with N = 8 (mock), N = 1 (KSHV), N = 13 (EBVzko) and N = 15 (KSHV+EBVzko) mice. Data are presented as individual data points with mean and SD. MWU **p < 0.01, ***p < 0.001. Significant p values: mock – Ewt 0.0099; mock – Ewt+K 0.0023; mock – Ezko+K 0.0008. B IgG serum levels of humanized NSG mice 4 weeks after i.p. infection with mock, KSHV only, EBV (wt or zko) only or EBV (wt or zko) and KSHV. 3 (EBVwt) independent experiments with serum from N = 3 (mock), N = 5 (KSHV), N = 7 (EBVwt), and N = 8 (KSHV+EBVwt) mice and 6 (EBVzko) independent experiments with N = 7 (mock), N = 1 (KSHV), N = 14 (EBVzko) and N = 11 (KSHV+EBVzko) mice. Data are presented as individual data points with mean and SD. Two sided MWU *p < 0.05. Significant p value Ewt – Ewt+K 0.0126  (C) Heatmap of KSHV-specific IgM antibodies in serum from humanized mice 4 weeks after i.p. infection with mock, KSHV, EBV (wt or zko) or EBV (wt or zko) and KSHV, measured by ELISA. Columns represent mice, rows represent antigens. Color intensity represents the background-substracted optical density (OD) on a logarithmic scale. D Ratio of median sero-reactivity (OD) of EBV + KSHV and Mock&EBV per antigen is indicated on the x-axis with the corresponding FDR-adjusted p-value on the y-axis. Labels indicate antigens with a significant (p < 0.05) and greater than 1.5 fold sero-reactivity in EBV+KSHV+ vs Mock&EBV+ mice. C, D Composite data with 47 mice from 4 independent experiments, N = 10 (mock), N = 3 (KSHV), N = 6 (Ezko), N = 10 (Ezko+K), N = 1 (Ew), N = 17 (Ew+K) mice per group. Source data are provided as a Source data file.
Fig. 3
Fig. 3. KSHV/EBV co-infection of humanized mice activates T cells and drives effector and central memory T cell differentiation.
A Human CD45+CD3+CD8+HLA-DR+ and CD45+CD3+CD4+HLA-DR+ cells / ml blood at baseline (BL) and at experimental end point (EP). Composite data from 12 independent experiments with N = 35 (mock), N = 24 (EBVzko), N = 28 (KSHV+EBVzko), N = 26 (EBVwt) and N = 17 (KSHV+EBVwt) mice. Two sided Wilcoxon test. Exact p-values left to right: CD8+HLA-DR: 0.1196; 1.744e-6; 6.149e-9; 1.895e-5; 2.889e-5; CD4+HLA-DR: 0.05115; 0.0001503; 0.001673; 0.00148; 0.06045. B, C Composite data of 8 (blood) and 10 (spleen) independent experiments with N = 20 (blood) and 28 (spleen) (mock), N = 8 (blood) and 15 (spleen) (EBVzko), N = 8 (blood) and 16 (spleen) (KSHV+EBVzko), N = 20 (blood) and 26 (spleen) (EBVwt) and N = 18 (blood) and 21 (spleen) (KSHV+EBVwt) mice. Naive: CD62L+CD45RA+, central memory (CM): CD62L+CD45RA, effector memory (EM): CD62LCD45RA, effector memory RA+ (Temra): CD62LCD45RA+. B Differentiation status of T cells in peripheral blood and spleen presented as pie charts. C Number of T cells with Temra, EM or CM phenotype in peripheral blood and spleen at end point. Data are presented as individual data points with mean and SD. Two sided unpaired t-test. Significant p-values left to right: Blood: 0.040467; 0.00419; 0.000665; 0.000413; Spleen: 0.00475; 1.64e-5; 1.01e-6; 2.34e-8. *p < 0.05, **p < 0.01, ***p < 0.001. Source data are provided as a Source data file.
Fig. 4
Fig. 4. T cell depletion increases viral loads and tumor burden of KSHV/EBV co-infected mice.
A Experimental outline of KSHV EBV co-infections with or without T cell depletion by i.p. injection of αCD8 (OKT8) and αCD4 (OKT4) antibodies. B Percentage of CD45+ CD3+, CD45+ CD4+, CD45+ CD8+ T cells in blood throughout the course of the experiment comparing mice with and without T cell depletion. Data present mean and SD. Two way mixed effects model with Geisser-Greenhouse correction, for comparisons Bonferroni’s multiple comparison test was performed. Significant p-values left to right: CD3: 0.0006; < 0.0001; < 0.0001; < 0.0001. CD4: 0.0007; < 0.000; < 0.0001; 0.0002; CD8: 0.0024; 0.0002; < 0.0001; 0.0129. C EBV copies/ml blood and (D) KSHV copies/ml blood displayed as area under the curve (AUC) during the experiment for KSHV/EBV co-infected mice with and without T cell depletion. Mean with SD, two sided MWU; Exact p-values are (C) 0.0086 and (D) 0.0252 (E) Tumor load of mock and KSHV/EBV co-infected animals with and without T cell depletion. Two sided MWU. Exact p values mock – non depl 0.0022; mock – depleted 0.0028. Composite data of 3 independent experiments (2 NSG-A2, 1 NSG) with N = 25 (non-depleted) and N = 13 (depleted) mice in (B) and N = 13 (non-depleted) and N = 9 (depleted) mice in (C, D). *p < 0.05; **p < 0.01; ***p < 0.001; ****p < 0.0001. Source data are provided as a Source data file.
Fig. 5
Fig. 5. KSHV-specific T cells are primed in KSHV-infected humanized mice.
A IFNγ ELISpot of CD19-negative cells isolated from humanized mice after overnight culture with medium (R10), E-CL or KE-CL. Shown as spot forming units per one million CD19-negative cells; data are presented as individual values for R10 and mean values from duplicates for E-CL and KE-CL, with mean and SD. 1 experiment with N = 6 (Mock), N = 4 (EBVzko) and N = 5 (EBVzko+KSHV) animals. B. Experimental outline of the T cell isolation protocol from KSHV/EBV co-infected huNSG mice. CD19-negative splenocytes from KSHV+/EBVzko+ mice were co-cultured with autologous KE-CLs for 24 h, IFNγ producing cells were isolated by IFNγ capture assay and cultured in limiting dilution. C IFNγ levels (pg/ml) in supernatant of isolated CD4+ and CD8+ T cell subpopulations after co-culture with E-CL or KE-CL were determined by ELISA upon growth after single cell dilution. N = 1. D Degranulation measured by % CD107a positivity on the isolated T cell subpopulations after co-culture with R10, E-CL or KE-CL. N = 2 (10-1, 10-14 and 1-9), N = 4 (01-1) independent experiments, means of technical duplicates and SD are shown. Two sided unpaired t-test, *p < 0.05; Significant p values 10-1 0.0393; 10-14 0.0235; 01-01 0.0369. E Specific killing (% dead cells compared to target cell without T cell condition) measured for CD8+ T cell subpopulation 01-1 after co-culture with E-CL or KE-CL at different effector to target cell ratios. 1 independent experiment, Shown are means of 2 technical replicates with SD. F Specific killing measured for CD4+ and CD8+ T cell subpopulations after co-culture with E-CL or KE-CL at an effector-target ratio of 2.5 to 1. 2 (10-1, 10-14, 1-9) or 3 (01-01) independent experiments, individual values represent means of technical replicates, bars show means, error bars represent SD. Two sided MWU, **p < 0.01. exact p-value 01-01 0.0043  (G) Number of spot forming units per one million cells measured via IFNγ KSHV proteome wide ELISpot of KSHV-reactive T cells (isolated from the IFNγ capture assay) after stimulation with overlapping peptide pools for the indicated KSHV or control antigens. Figure shows the individual values from all wells with a signal (all data can be found in Supplementary Table 2) with mean and SD. H Relative IFNγ production of the T cell subpopulation 01-1 after co-culture with KE-CL or KE-CL pulsed with the K6 peptide pool. N = 2 independent experiments, n = 3 (KE-CL + T cells) and n = 6 (KE-CL + T cells + K6 peptide mix) replicates per experiment. IFNγ production relative to the mean of the T cell only condition is shown for each replicate, SD is displayed. Two sided Unpaired t-test, **p < 0.01. exact p-value 0.0033. Source data are provided as a Source data file.

References

    1. Cohen JI, Fauci AS, Varmus H, Nabel GJ. Epstein-Barr virus: an important vaccine target for cancer prevention. Sci. Transl. Med. 2011;3:107fs7. doi: 10.1126/scitranslmed.3002878. - DOI - PMC - PubMed
    1. Parkin DM. The global health burden of infection-associated cancers in the year 2002. Int J. Cancer. 2006;118:3030–3044. doi: 10.1002/ijc.21731. - DOI - PubMed
    1. Münz C. Latency and lytic replication in Epstein–Barr virus-associated oncogenesis. Nat. Rev. Microbiol. 2019;17:691–700. doi: 10.1038/s41579-019-0249-7. - DOI - PubMed
    1. Böni M, Rieble L, Münz C. Co-Infection of the Epstein–Barr Virus and the Kaposi Sarcoma-Associated Herpesvirus. Viruses. 2022;14:2709. doi: 10.3390/v14122709. - DOI - PMC - PubMed
    1. Cesarman E, Chadburn A, Rubinstein PG. KSHV/HHV8-mediated hematologic diseases. Blood. 2022;139:1013–1025. doi: 10.1182/blood.2020005470. - DOI - PMC - PubMed

MeSH terms