. 2024 Jun 6;15(1):4842.
doi: 10.1038/s41467-024-49090-7.

Central transcriptional regulator controls photosynthetic growth and carbon storage in response to high light

Affiliations

Central transcriptional regulator controls photosynthetic growth and carbon storage in response to high light

Seth Steichen et al. Nat Commun. .

Abstract

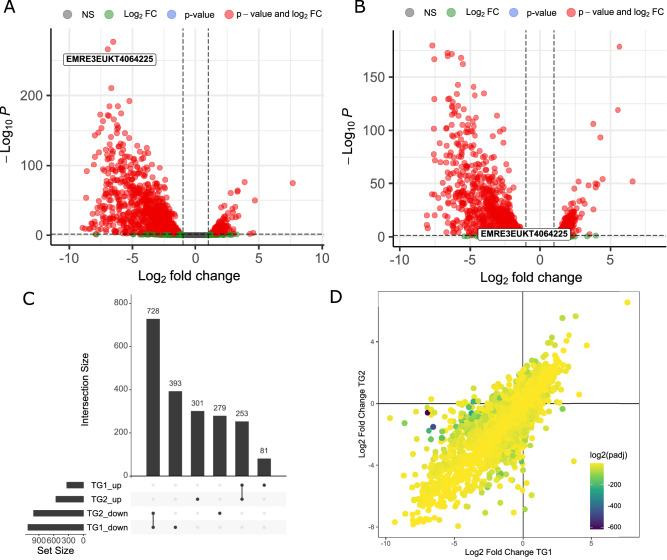
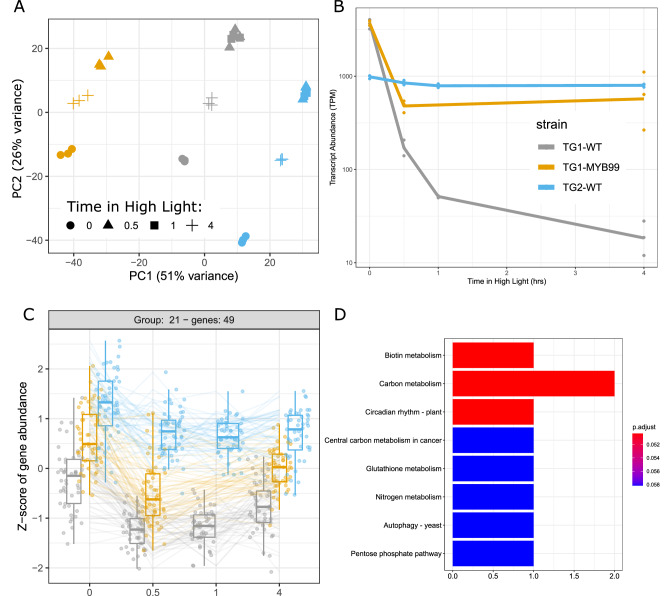
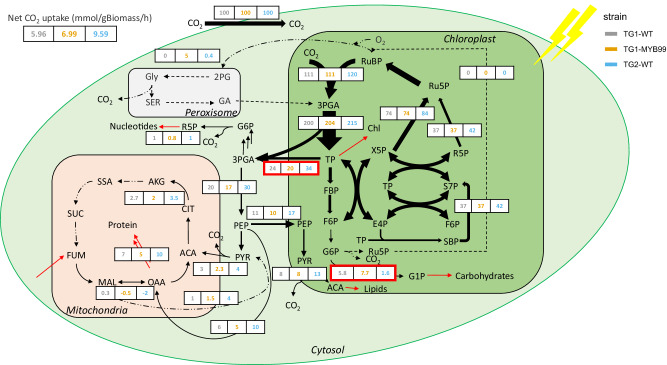
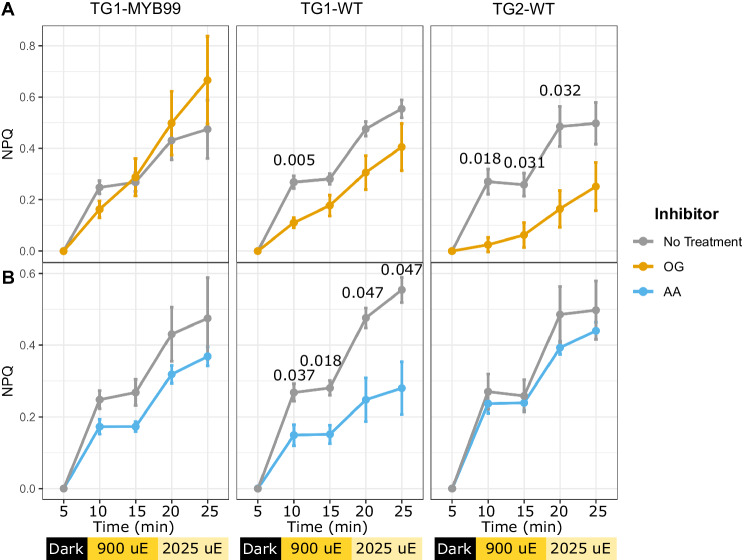
Carbon capture and biochemical storage are some of the primary drivers of photosynthetic yield and productivity. To elucidate the mechanisms governing carbon allocation, we designed a photosynthetic light response test system for genetic and metabolic carbon assimilation tracking, using microalgae as simplified plant models. The systems biology mapping of high light-responsive photophysiology and carbon utilization dynamics between two variants of the same Picochlorum celeri species, TG1 and TG2 elucidated metabolic bottlenecks and transport rates of intermediates using instationary 13C-fluxomics. Simultaneous global gene expression dynamics showed 73% of the annotated genes responding within one hour, elucidating a singular, diel-responsive transcription factor, closely related to the CCA1/LHY clock genes in plants, with significantly altered expression in TG2. Transgenic P. celeri TG1 cells expressing the TG2 CCA1/LHY gene, showed 15% increase in growth rates and 25% increase in storage carbohydrate content, supporting a coordinating regulatory function for a single transcription factor.


Conflict of interest statement

The authors declare no competing interests.

Figures

Fig. 1
Fig. 1. Gene expression variation between TG1-WT and TG2-WT upon exposure to high light intensity.
RNA-seq data collected from wild type P. celeri cultures after 1 h of exposure to HL conditions following acclimation to LL (T = 0). Changes in transcript abundances of (A) TG1 and (B) TG2 cultures expressed as Log2 of the fold changes between 1 h high light and steady state low light growth. Dashed lines represent threshold values for fold change and p-values (L2FC(1) and 0.05, respectively) used to identify significant gene sets, as determined by a two-sided Wald test using Benjamini–Hochberg multiple testing adjustment. The putative CCA1 transcript is labeled in each with its transcript ID number, and not significant (NS) genes colored in gray. C Comparison of significant differentially expressed gene sets between TG1 and TG2. The sets identified in above panels were separated into up or down regulated groups and all combinations of comparison are represented in the lower matrix with the number of members shown in the above bars. D Statistical analysis to deconvolute P. celeri TG1 and TG2 isolates’ transcriptome. The results of a two-sided likelihood ratio test determining the significance of each gene to a model isolating the interaction term between high light exposure time and strain is displayed as color scaled p-values over the fold change observed for each gene. All data shown are derived from independent biological replicate cultures (n = 3). Source data are provided as a Source Data file.
Fig. 2
Fig. 2. Transcriptional responses of Picochlorum celeri TG1 and TG2 isolates and engineered TG1-MYB99 strain, in response to high intensity light shift.
A The relative position of each sample is displayed based on a principal component analysis scores plot of the regularized log transform data of the 500 most highly expressed transcripts. B CCA1 transcriptional dynamics over the acclimation time course. Relative transcript levels were computed following alignment to a reference with a single CCA1, and therefore represent the total pool of TG1 and TG2 transcript isoforms. C Time course transcript dynamics of genes clustered based on their similarity to CCA1 expression are displayed by their deviation from median transcript levels of the cluster across the time course with boxplots representing distributions of expression level variances for genes averaged from independent biological replicate cultures (n = 3) centered on the median with lower and upper bounds on the 25th and 75th percentiles, respectively. Lower and upper whiskers indicate minimum and maximum values up to 1.5 times interquartile range in each direction. The corresponding bar plot (D) of enriched functional annotation categories indicates the number of genes with each annotation type and colored by the significance of their over-representation compared to the remaining background genome as computed using a hypergeometric distribution with Benjamini–Hochberg multiple testing adjustment.
Fig. 3
Fig. 3. Flux maps determined in TG1, TG1-MYB99, and TG2 under continuous HL conditions (1000 µE).
For each reaction shown, the net fluxes are normalized to 100 units of CO2 taken up. All flux values and confidence intervals are given in Supplementary Data 4. Estimated net CO2 uptake rates for TG1, TG1-MYB99, and TG2 are 5.96, 6.99, and 9.59 mmol gBiomass-1 h-1 respectively (derived from flux models, using n = 3 biological replicated experiments). Ribulose 1,5-bisphosphate (RuBP), 3-phosphoglycerate (3PGA), Triose phosphate (TP), Fructose 1,6-bisphosphate (FBP), Fructose 6-phosphate (F6P), Glucose 6-phosphate (G6P), Glucose 1-phosphate (G1P), Ribulose 5-phosphate (Ru5P), Erythrose 4-phosphate (E4P), Ribose 5-phosphate (R5P), Xylulose 5-phosphate (X5P), Sedoheptulose-7-phosphate (S7P), Sedoheptulose-1,7-bisphosphate (SBP), Phosphoenolpyruvate (PEP), Acetyl-CoA (ACA), Pyruvate (PYR), Glycine (Gly), Serine (SER), 2-phosphoglycolate (2PG), Glycolic acid (GA), Citrate (CIT), Alpha-ketoglutarate (AKG), Succinic semialdehyde (SSA), Succinate (SUC), Fumarate (FUM), Malate (MAL), Oxaloacetate (OAA). Black arrows represent intracellular flux while red arrows represent fluxes to/from biomass sink. The width of the black arrows is indicative of the magnitude of the flux. The red boxes highlight reactions catalyzed by phosphoglucomutase (PGM) and triose phosphate transporter (TPT3) which are implicated in the differing biomass composition phenotypes.
Fig. 4
Fig. 4. Non-photochemical quenching (NPQ) responses of high light acclimated cell cultures.
Replicate cultures were sampled and treated with inhibitors reported to interfere with different NPQ mechanisms including (A) octyl gallate (OG) and (B) antimycin A (AA). Data points are presented as mean values ± SD of biological replicate cultures (n = 3). Asterisks indicate significant differences between inhibitor treated NPQ measures and untreated control values as determined by a two-sided T-test, with p-values displayed above each significantly different comparison (p < 0.05) and insignificant p-values omitted.

Similar articles

Cited by

References

    1. Ort DR, et al. Redesigning photosynthesis to sustainably meet global food and bioenergy demand. Proc. Natl. Acad. Sci. USA. 2015;112:8529–8536. doi: 10.1073/pnas.1424031112. - DOI - PMC - PubMed
    1. Simkin AJ, López-Calcagno PE, Raines CA. Feeding the world: improving photosynthetic efficiency for sustainable crop production. J. Exp. Bot. 2019;70:1119–1140. doi: 10.1093/jxb/ery445. - DOI - PMC - PubMed
    1. Wei S, et al. A transcriptional regulator that boosts grain yields and shortens the growth duration of rice. Science. 2022;377:eabi8455. doi: 10.1126/science.abi8455. - DOI - PubMed
    1. Krishnan A, et al. Picochlorum celeri as a model system for robust outdoor algal growth in seawater. Sci. Rep. 2021;11:11649. doi: 10.1038/s41598-021-91106-5. - DOI - PMC - PubMed
    1. Dahlin LR, et al. Development of a high-productivity, halophilic, thermotolerant microalga Picochlorum renovo. Commun. Biol. 2019;2:1–9. doi: 10.1038/s42003-019-0620-2. - DOI - PMC - PubMed

MeSH terms