. 2024 Jul;30(7):1913-1922.
doi: 10.1038/s41591-024-03044-0. Epub 2024 Jun 6.

Precision-guided treatment in high-risk pediatric cancers

Affiliations

Precision-guided treatment in high-risk pediatric cancers

Loretta M S Lau et al. Nat Med. 2024 Jul.

Abstract

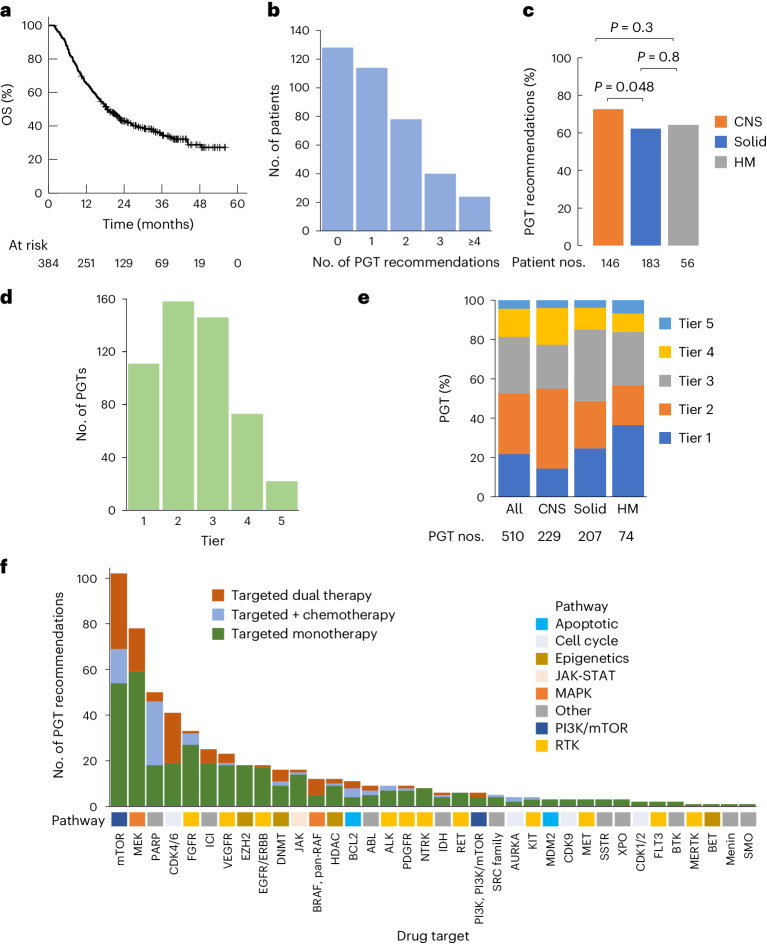
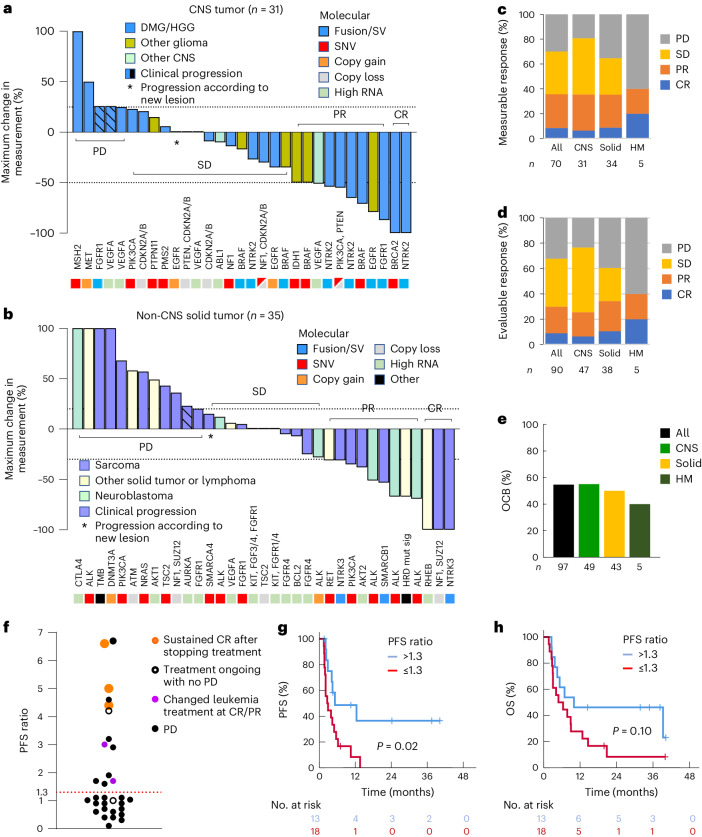
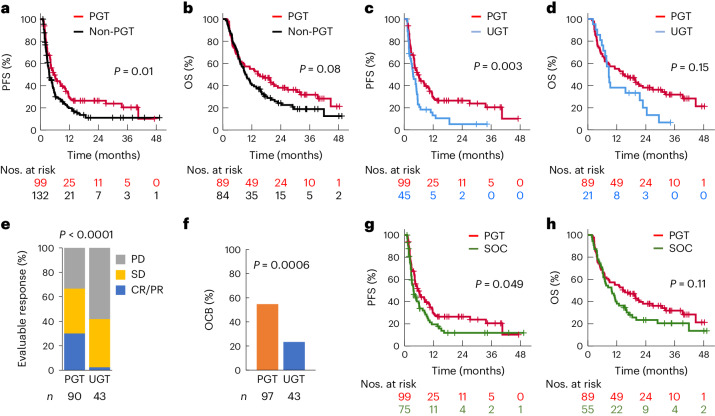
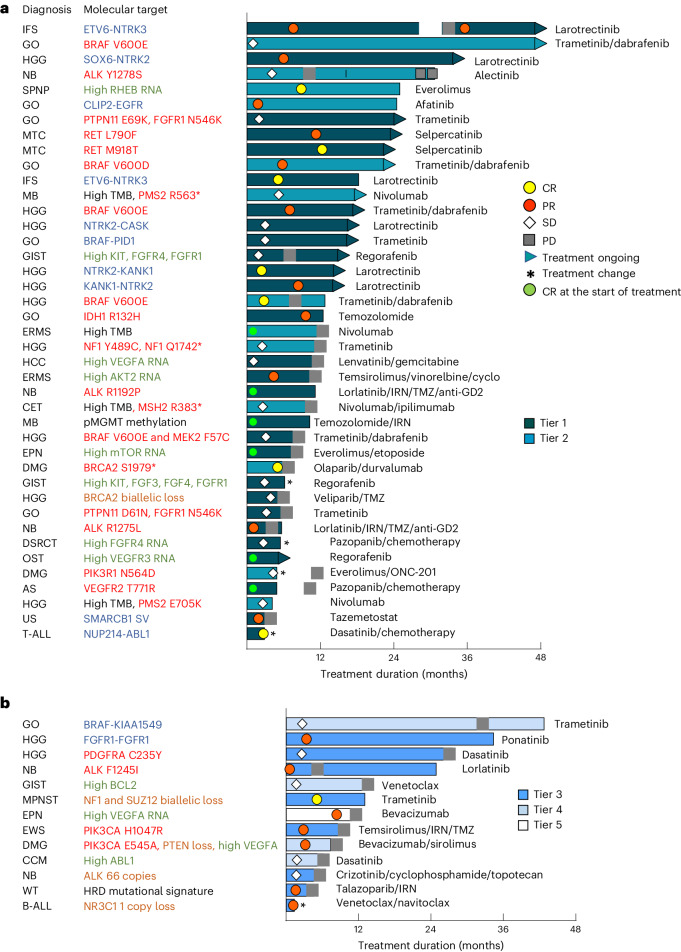
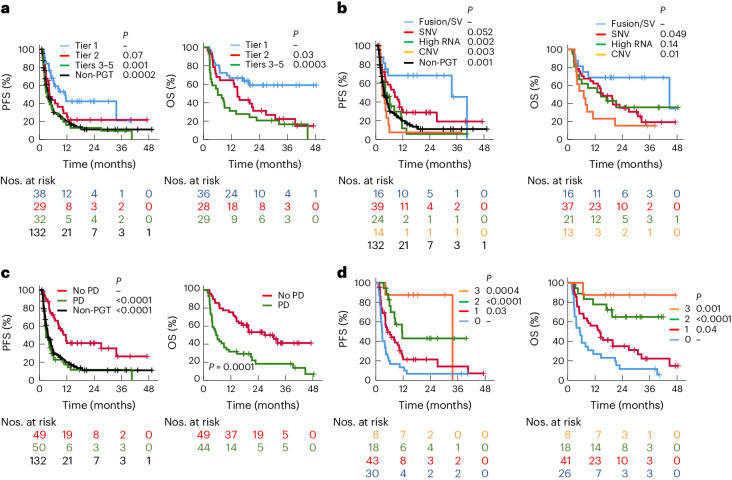
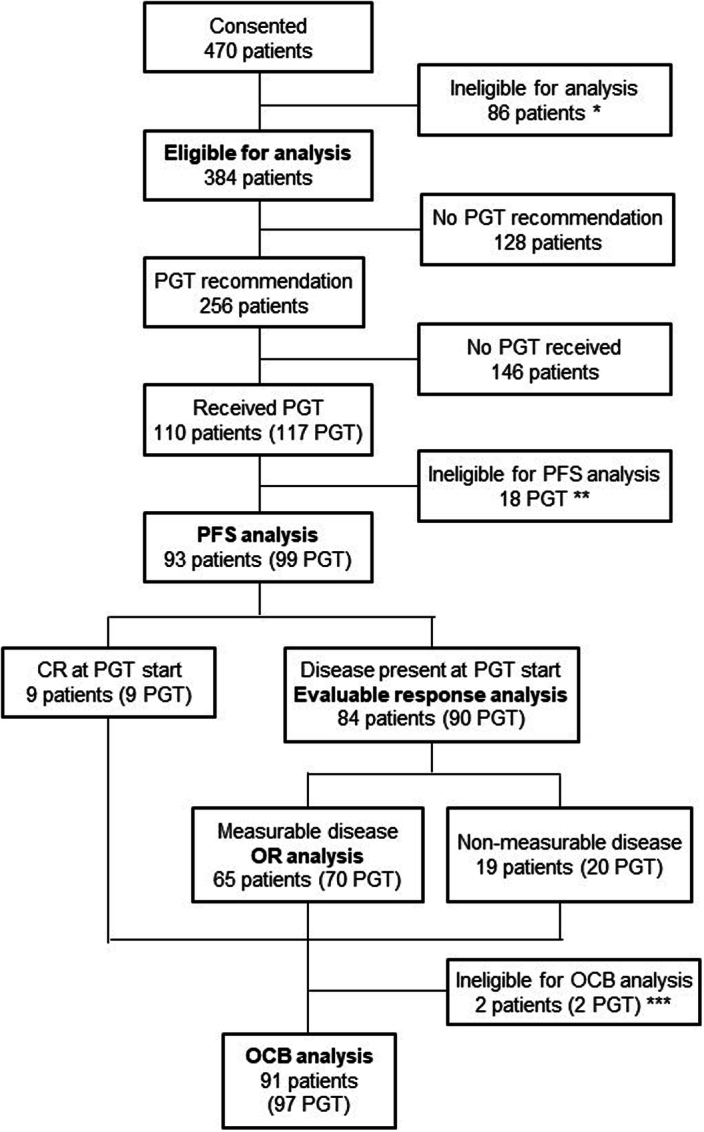
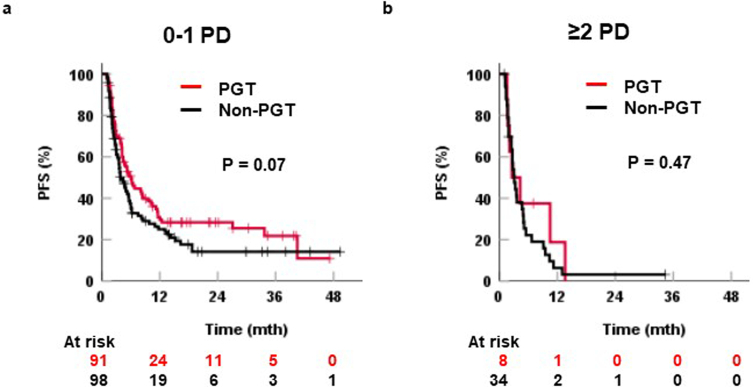
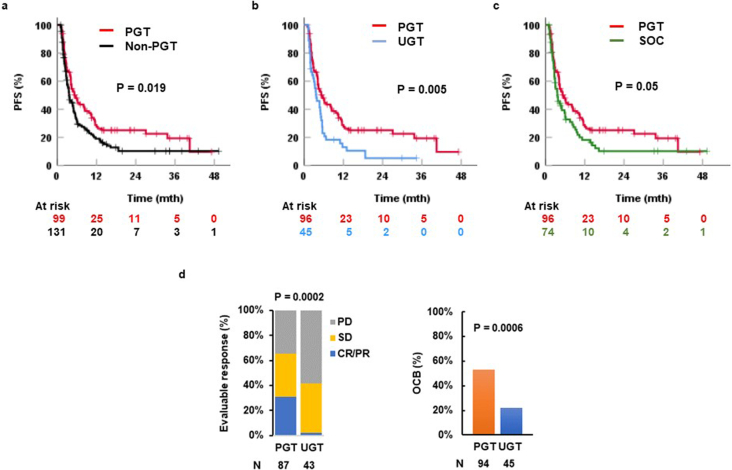
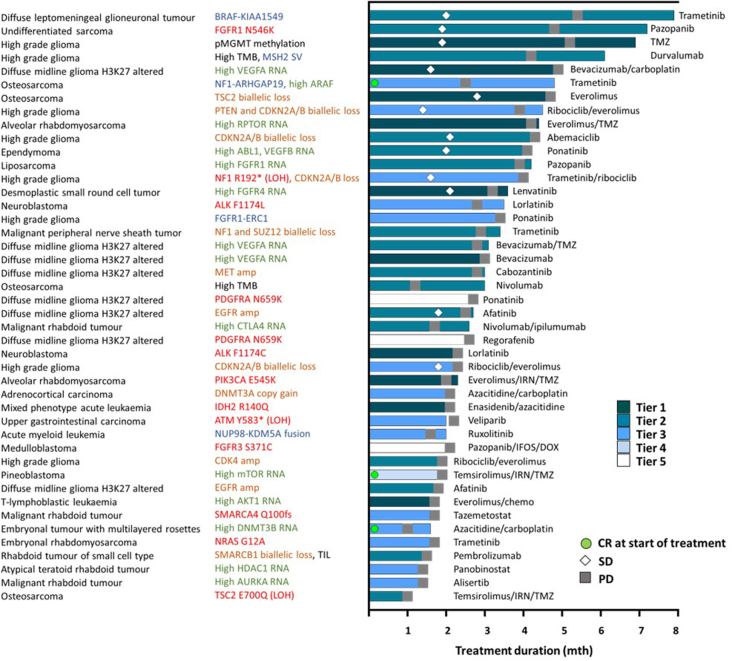
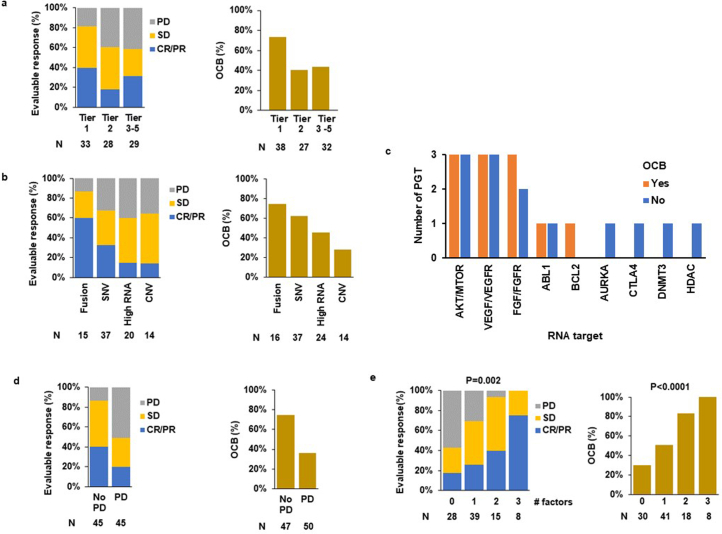
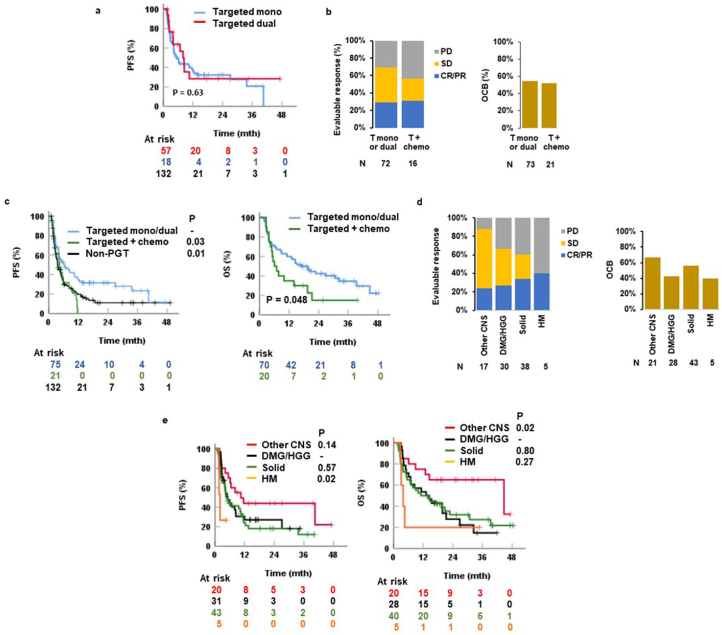
Recent research showed that precision medicine can identify new treatment strategies for patients with childhood cancers. However, it is unclear which patients will benefit most from precision-guided treatment (PGT). Here we report consecutive data from 384 patients with high-risk pediatric cancer (with an expected cure rate of less than 30%) who had at least 18 months of follow-up on the ZERO Childhood Cancer Precision Medicine Program PRecISion Medicine for Children with Cancer (PRISM) trial. A total of 256 (67%) patients received PGT recommendations and 110 (29%) received a recommended treatment. PGT resulted in a 36% objective response rate and improved 2-year progression-free survival compared with standard of care (26% versus 12%; P = 0.049) or targeted agents not guided by molecular findings (26% versus 5.2%; P = 0.003). PGT based on tier 1 evidence, PGT targeting fusions or commenced before disease progression had the greatest clinical benefit. Our data show that PGT informed by comprehensive molecular profiling significantly improves outcomes for children with high-risk cancers. ClinicalTrials.gov registration: NCT03336931.


Conflict of interest statement

All authors, except P.G.E., S.-L.K., L.M.S.L., J.R.H., N.G.G. and D.S.Z., declare no competing interests. L.M.S.L. received consulting and advisory board fees from Bayer; J.R.H. received fees from Bayer, AstraZeneca/Alexion and Boxer Capital; N.G.G received fees to his institution from Bayer and Day One; D.S.Z. received fees from Bayer, AstraZeneca/Alexion, Accendatech, Novartis, Day One, FivePhusion, Amgen and Norgine, and research support from Accendatech. P.G.E. and S.-L.K. are recipients of a share in milestone and royalty payments for venetoclax development.

Figures

Fig. 1
Fig. 1. Clinical uptake of PGT.
a, OS of 384 patients with high-risk cancers. b, Number of PGT recommendations per patient. c, Frequency of PGT recommendations according to cancer type. d, Number of PGT recommendations from the highest level of supporting evidence to the lowest (tier 1, clinical evidence in the same cancer; tier 2, clinical evidence in a different cancer; tier 3, preclinical evidence in the same cancer; tier 4, preclinical evidence in a different cancer; tier 5, consensus opinion). e, Distribution of PGT recommendation tier according to cancer type. f, Types of targeted therapy in relation to the drug target. Targeted therapy was categorized into targeted monotherapy, targeted dual therapy and targeted agent in combination with chemotherapy. The corresponding molecular pathway for each of the drug targets is shown. c, P values for comparison of proportions using a two-sided chi-squared test.
Fig. 2
Fig. 2. Patients receiving PGT experienced a clinical response.
a, Waterfall plot for 31 CNS tumors with measurable disease at the start of a PGT. Treatment response was evaluated using the RANO criteria. The dotted lines at 25% and −50% delineate the category of response (≥25%, PD; 25 to −50%, SD; −50% or lower to −99%, PR; −100%, CR). b, Waterfall plot for 35 solid tumors with measurable disease at the start of a PGT. Treatment response was evaluated using the RECIST or PERCIST criteria. The dotted lines at 25% and −30% delineate the category of response (≥25%, PD; 25 to −30%, SD; −30% or lower to −99%, PR; −100%, CR). c, Response according to cancer type to 70 PGTs given with measurable disease. d, Response according to cancer type to 90 PGTs with evaluable disease (70 measurable and 20 non-measurable). e, OCB rate in 97 PGTs. OCB was defined as CR, PR and SD of 24 weeks’ duration or longer. f, PFS ratio for 31 PGTs. The PFS ratio was defined as the PFS duration of the PGT to that of a previous treatment in the same patient. A PFS ratio greater than 1.3 (above the dotted line) represents prolongation of the progression-free period for more than 30% by the PGT compared to a previous treatment. The color of the dots denotes the clinical course. g,h, PFS (g) and OS (h) stratified according to PFS ratio. A two-sided log-rank test was used to compare the Kaplan–Meier survival curves.
Fig. 3
Fig. 3. Superior clinical outcome of PGT.
a,b, PFS (a) and OS (b) stratified according to PGT and non-PGT commenced at any point after MTB discussion. c,d, PFS (c) and OS (d) stratified according to PGT and UGT, that is, new therapy not molecularly guided. e, Response to PGT and UGT in patients with evaluable disease. f, OCB rate in PGT and UGT. OCB was defined as CR, PR and SD of 24 weeks’ duration or longer, and ongoing CR of 24 weeks or longer for patients who were in CR at the start of treatment. A two-sided chi-squared test was used to compare the CR and PR rate in e and OCB rate in f. g,h, PFS (g) and OS (h) stratified according to PGT and SOC. For OS comparison, a patient was categorized according to the first treatment that was initiated after MTB discussion. The Kaplan–Meier survival curves were compared using a two-sided log-rank test.
Fig. 4
Fig. 4. PGT leads to OCB.
a,b, Swimmer plot of 53 PGTs (51 patients) leading to OCB. OCB includes CR, PR and SD for a duration of 24 weeks or longer and ongoing CR of 24 weeks or longer for patients who were in CR at the start of treatment. Forty-one PGTs with tier 1 and 2 recommendations are show in a and 12 with tier 3–5 recommendations are shown in b. The color of the bars indicates the tier of a PGT recommendation. The symbols indicate the responses and treatment status. The diagnosis and molecular targets for each patient are shown. The types of molecular aberration are denoted by different colored text. The fusion or structural variant (SV) is shown in blue, SNVs in red, high RNA expression in green, copy number variant in brown and other alterations in black. AS, angiosarcoma; B-ALL, B cell acute lymphoblastic leukemia; CCM, clear cell meningioma; CET, CNS embryonal tumor not otherwise specified; DMG, diffuse midline glioma H3K27M-altered; DSRCT, desmoplastic small round cell tumor; ERMS, embryonal rhabdomyosarcoma; GIST, gastrointestinal stromal tumor; GO, glioma other; HCC, hepatocellular carcinoma; HGG, high-grade glioma; IFS, infantile fibrosarcoma; MPNST, malignant peripheral nerve sheath tumor; MTV, medullary thyroid carcinoma; NB, neuroblastoma; SPNP, solid pseudopapillary neoplasm of the pancreas; T-ALL, T cell acute lymphoblastic leukemia; US, undifferentiated sarcoma; WT, Wilms tumor.
Fig. 5
Fig. 5. Factors influencing the clinical outcome of PGT.
ad, PFS and OS stratified according to the tier of PGT (a), the types of molecular aberration (b), PD from enrollment to the start of PGT (c) and the number of favorable prognostic factors (d). A two-sided log-rank test was used to compare the Kaplan–Meier survival curves of two groups; the reference subgroup is indicated by a dash.
Extended Data Fig. 1
Extended Data Fig. 1. CONSORT diagram.
Consort diagram of 470 patients consented in the PRISM study between Sep 2017 and Dec 2020. 384 patients were eligible for outcome analysis. * ineligible due to non-high-risk cancer diagnosis, lack of appropriate sample or death prior to presentation at the molecular tumour board. ** ineligible due to treatment duration <4 weeks, disease progression within the first 4 weeks of treatment or no response evaluation. *** not evaluable for OCB due to cessation of treatment before 24 weeks in the absence of disease progression where stable disease was best response. CR, complete remission; OCB, objective clinical benefit; OR, objective response of measurable disease; PGT, precision-guided treatment; PFS, progression-free survival.
Extended Data Fig. 2
Extended Data Fig. 2. Progression-free survival of precision-guided treatment (PGT) and non-PGT by disease status.
Progression-free survival (PFS) of PGT and non-PGT for (a) treatment given at no disease progression (PD) or one PD only since study enrolment and (b) treatment received at ≥2 PD since study enrolment. Log rank test is used to compare the Kaplan Meier survival curves.
Extended Data Fig. 3
Extended Data Fig. 3. Outcome of treatment with pilocytic astrocytoma excluded from analysis.
a–c, Progression-free survival (PFS) of PGT comparing with (a) non-PGT, (b) UGT (molecularly unguided therapy) and (c) standard of care (SOC) treatment. d, Evaluable response and objective clinical benefit (OCB) of PGT and UGT. Log rank test is used to compare the Kaplan Meier survival curves and Chi-square test is used to compare evaluable response and OCB.
Extended Data Fig. 4
Extended Data Fig. 4. Swimmer plot of 44 precision-guided treatments (PGTs) which did not lead to objective clinical benefit (OCB).
Lack of OCB includes patients with disease at the start of treatment who had stable disease (SD) for <24 weeks duration or progressive disease (PD) and patients in complete remission (CR) at the start of treatment with relapse-free duration <24 weeks. The color of the bars indicates tier of a PGT recommendation. Symbols indicate responses and treatment status. The diagnosis and molecular targets for each patient are shown. The types of molecular aberration are denoted by different color text. Fusion or structural variant (SV) is shown in blue, single nucleotide variants in red, high RNA expression in green, copy number variant in brown and other alterations in black.
Extended Data Fig. 5
Extended Data Fig. 5. Factors influencing response to precision-guided therapy (PGT).
a, b, Evaluable response and objective clinical benefit (OCB) rate by (a) tier of PGT recommendation and (b) stratified by types of molecular aberration. c, The number of PGTs with and without OCB for each specific RNA targets or pathways. d, e, Evaluable response and OCB rate by (d) progressive disease (PD) from enrolment to the start of PGT and (e) number of favorable prognostic factors. Chi-square test is used to compare evaluable response and OCB rate between 2 groups and the actual P values are presented in Table 1. The P value shown in panel (d) is for Chi-square test for trend. CNV, copy number variation; CR, complete response; PR, partial response; PD, progressive disease; SD, stable disease; SNV, single nucleotide variant; SV, structural variant.
Extended Data Fig. 6
Extended Data Fig. 6. Clinical outcome of precision-guided targeted therapy by treatment and cancer types.
a, Progression-free survival (PFS) for targeted monotherapy (mono) and targeted dual therapy. b, Evaluable response and objective clinical benefit (OCB) rate by type of targeted therapy. c, PFS and OS by types of treatment. d, Evaluable response and OCB by cancer types. e, PFS and OS by cancer types. Two-sided log rank test is used to compare the Kaplan Meier survival curves of 2 groups, with the reference subgroup indicated by a dash and P value next to the group for comparison. Two-sided chi-square test is used to compare evaluable response and OCB rate between 2 groups and the P values are presented in Table 1. CR, complete response; DMG, diffuse midline glioma H3K27M-altered; HGG, high grade glioma; HM, hematologic malignancy; PR, partial response; PD, progressive disease; SD, stable disease.

References

    1. Wong, M. et al. Whole genome, transcriptome and methylome profiling enhances actionable target discovery in high-risk pediatric cancer. Nat. Med.26, 1742–1753 (2020). 10.1038/s41591-020-1072-4 - DOI - PubMed
    1. van Tilburg, C. M. et al. The pediatric precision oncology INFORM registry: clinical outcome and benefit for patients with very high-evidence targets. Cancer Discov.11, 2764–2779 (2021). 10.1158/2159-8290.CD-21-0094 - DOI - PMC - PubMed
    1. Church, A. J. et al. Molecular profiling identifies targeted therapy opportunities in pediatric solid cancer. Nat. Med.28, 1581–1589 (2022). 10.1038/s41591-022-01856-6 - DOI - PMC - PubMed
    1. Berlanga, P. et al. The European MAPPYACTS trial: precision medicine program in pediatric and adolescent patients with recurrent malignancies. Cancer Discov.12, 1266–1281 (2022). 10.1158/2159-8290.CD-21-1136 - DOI - PMC - PubMed
    1. Ecker, J. et al. Molecular diagnostics enables detection of actionable targets: the Pediatric Targeted Therapy 2.0 registry. Eur. J. Cancer180, 71–84 (2023). 10.1016/j.ejca.2022.11.015 - DOI - PubMed

Associated data