. 2024 Aug;5(8):1206-1226.
doi: 10.1038/s43018-024-00771-8. Epub 2024 Jun 6.

Nucleotide metabolism in cancer cells fuels a UDP-driven macrophage cross-talk, promoting immunosuppression and immunotherapy resistance

Affiliations

Nucleotide metabolism in cancer cells fuels a UDP-driven macrophage cross-talk, promoting immunosuppression and immunotherapy resistance

Tommaso Scolaro et al. Nat Cancer. 2024 Aug.

Abstract

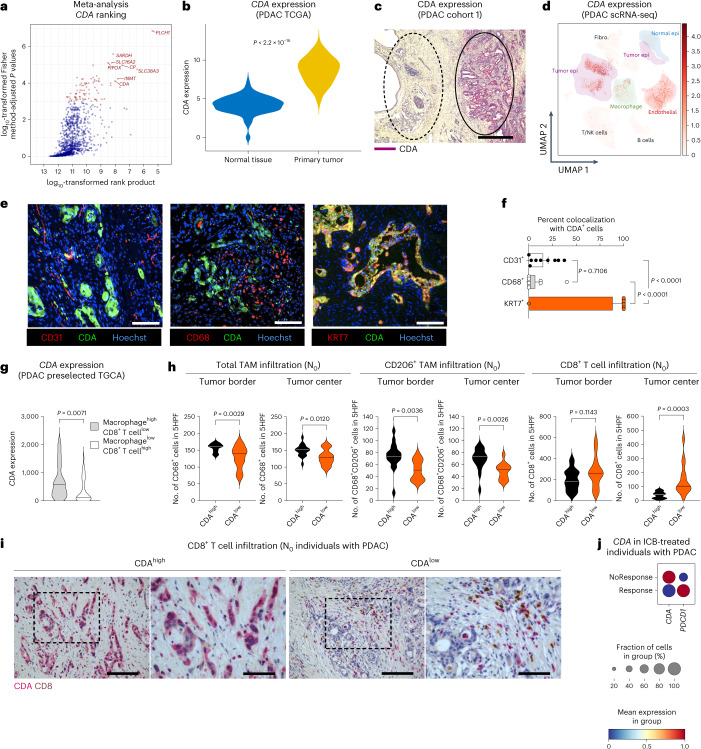
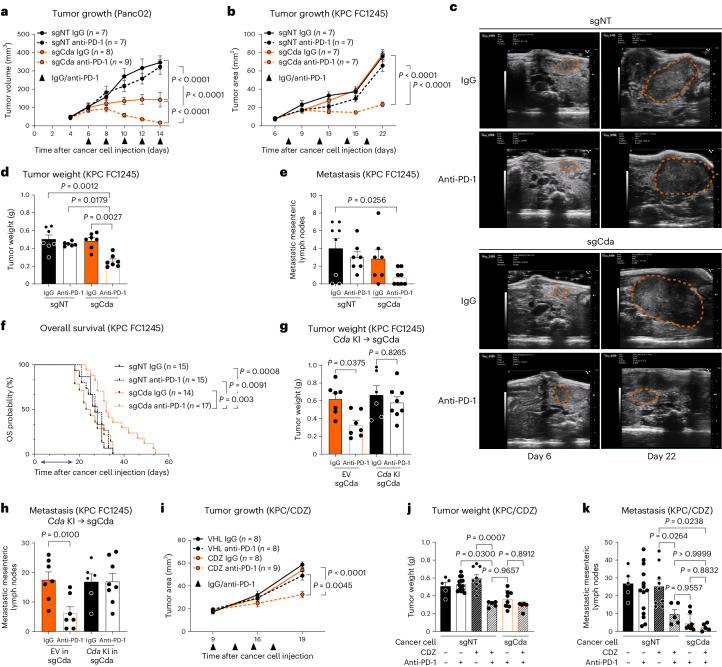
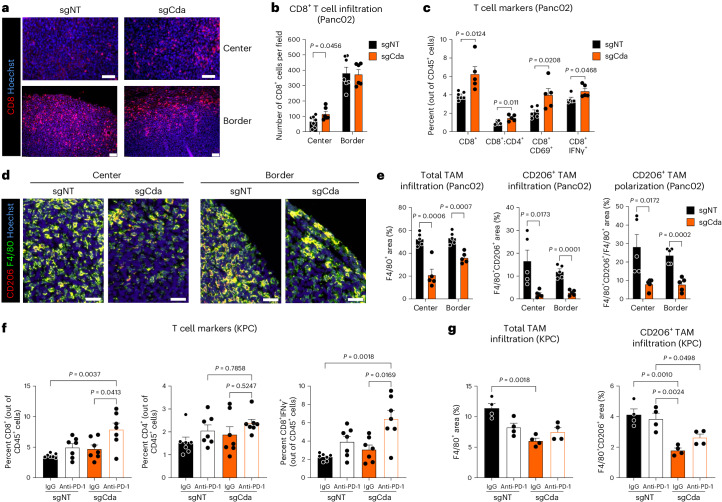
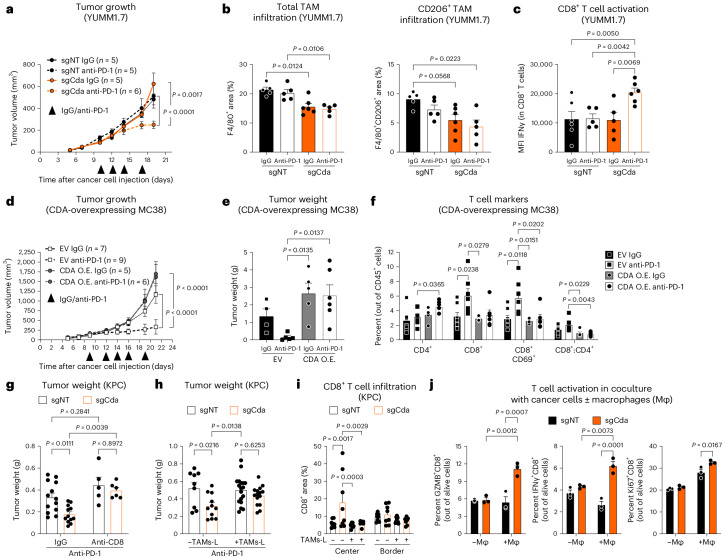
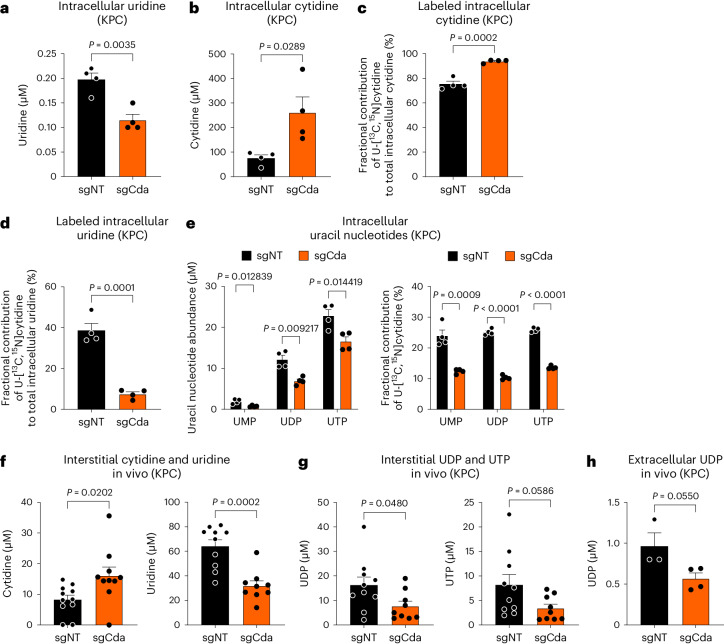
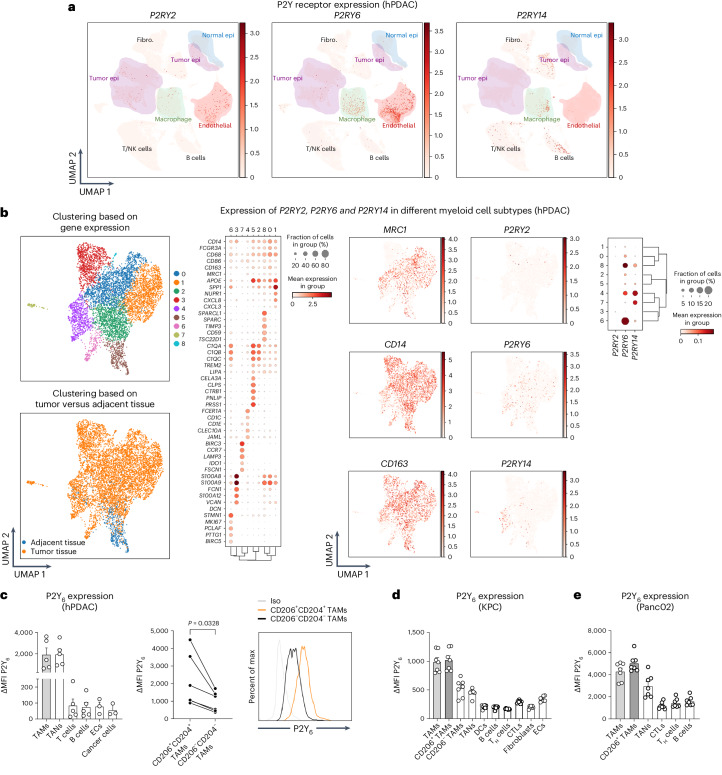
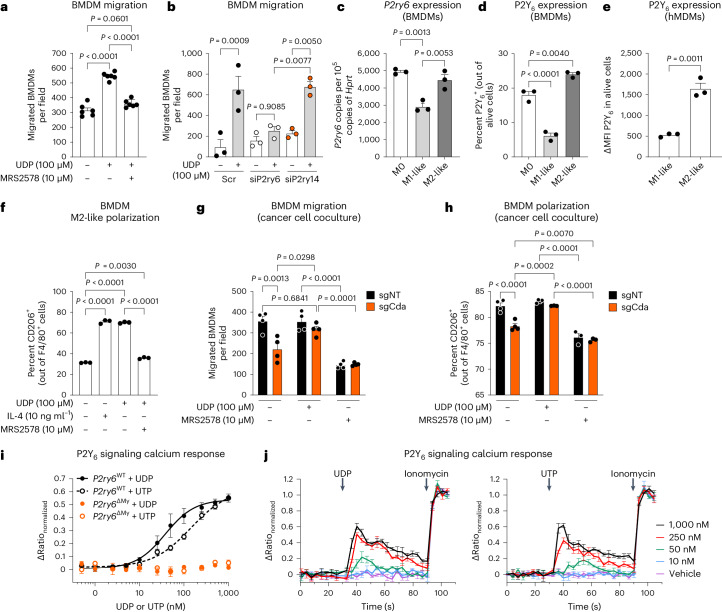
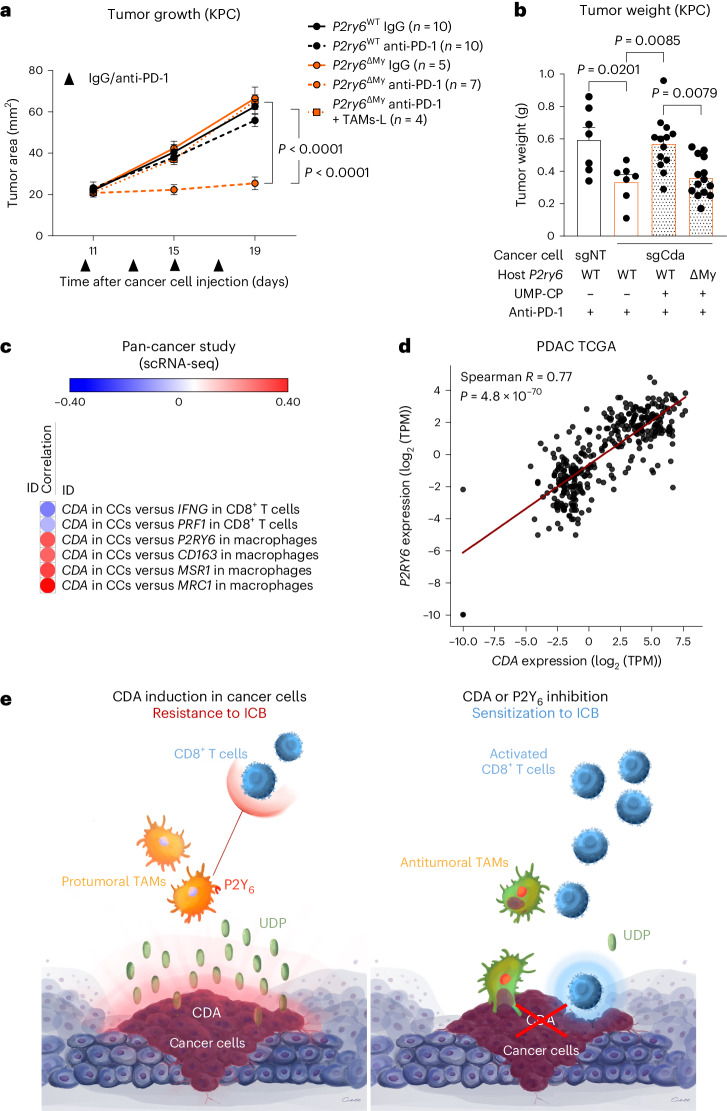
Many individuals with cancer are resistant to immunotherapies. Here, we identify the gene encoding the pyrimidine salvage pathway enzyme cytidine deaminase (CDA) among the top upregulated metabolic genes in several immunotherapy-resistant tumors. We show that CDA in cancer cells contributes to the uridine diphosphate (UDP) pool. Extracellular UDP hijacks immunosuppressive tumor-associated macrophages (TAMs) through its receptor P2Y6. Pharmacologic or genetic inhibition of CDA in cancer cells (or P2Y6 in TAMs) disrupts TAM-mediated immunosuppression, promoting cytotoxic T cell entry and susceptibility to anti-programmed cell death protein 1 (anti-PD-1) treatment in resistant pancreatic ductal adenocarcinoma (PDAC) and melanoma models. Conversely, CDA overexpression in CDA-depleted PDACs or anti-PD-1-responsive colorectal tumors or systemic UDP administration (re)establishes resistance. In individuals with PDAC, high CDA levels in cancer cells correlate with increased TAMs, lower cytotoxic T cells and possibly anti-PD-1 resistance. In a pan-cancer single-cell atlas, CDAhigh cancer cells match with T cell cytotoxicity dysfunction and P2RY6high TAMs. Overall, we suggest CDA and P2Y6 as potential targets for cancer immunotherapy.


Conflict of interest statement

The authors declare no conflicts of interest.

Figures

Fig. 1
Fig. 1. CDA is associated with resistance to immunotherapy.
a, Meta-analysis on four datasets. Red indicates genes with adjusted P values of <1 × 10–3; CDA: 9 of 1,321; adjusted P value of <1 × 10–4. b, CDA expression in pancreatic cancer (n = 183) and normal pancreatic tissues (n = 167). c, Representative image of CDA staining (purple) in tumor (right ellipse) and adjacent tissue (left ellipse) of an individual with PDAC (cohort 1, n = 63); scale bar, 100 µm. d, UMAP representing CDA expression in different cell populations of pancreatic tissue from treatment-naive individuals with PDAC (n = 24). The number of cells analyzed is 83,960; epi, epithelial cells; Fibro., fibroblasts. e,f, Representative micrographs (e) and related quantification (percentage of colocalization; f) of CDA (green) with cancer cells; n = 9 out of cohort 1; scale bar, 50 µm. g, Violin plot of CDA expression in macrophagehighCD8+ T celllow (n = 64) versus macrophagelowCD8+ T cellhigh (n = 31) individuals with PDAC in TCGA. h, Histological analysis of treatment-naive, resectable PDAC tumors (out of cohort 1; stage I–IIa; N0). Violin plots showing quantification of total CD68+ (left), immunosuppressive CD206+ TAMs (middle) and cytotoxic T cells (CD8+; right) at the tumor border or center (CDAhigh n = 18 individuals with PDAC; CDAlow n = 14 individuals with PDAC); 5HPF, five high-power fields. i, Representative images of cytotoxic T cell (CD8; brown) infiltration in the tumor core (low magnification on the left and a zoom on the right) of an individual with PDAC (cohort 1, n = 63); scale bars, 10 µm (left) and 5 µm (right). j, Dot plot of CDA and PDCD1 expression in PDAC tumors from individuals before three cycles of ICB (combined with radiation on the second cycle). Mean expression is shown as color and is standard scaled (binarized), whereas dot size represents the fraction of samples with expression (Response n = 2; NoResponse n = 5). In bd and fj, n represents the number of individuals. Data were analyzed by unpaired, two-tailed Student’s t-tests (b, g and h), one-way analysis of variance (ANOVA) with Tukey’s multiple comparison test (f) and Fisher’s combined probability test (one sided; a). Data are shown as mean ± s.e.m. Source data
Fig. 2
Fig. 2. Targeting CDA improves anti-PD-1 therapy efficacy.
a, Growth of sgNT (control) and sgCda s.c. Panc02 tumors treated with anti-PD-1 or control IgG (sgNT (IgG) n = 7, sgNT (anti-PD-1) n = 7, sgCda (IgG) n = 8, sgCda (anti-PD-1) n = 9). The treatment regimen is indicated by the black arrowheads. b, Ultrasound-guided longitudinal measurements of sgNT and sgCda orthotopic KPC FC1245 tumors treated with anti-PD-1 or control IgG (sgNT (IgG) n = 7, sgNT (anti-PD-1) n = 7, sgCda (IgG) n = 7, sgCda (anti-PD-1) n = 7). c, Representative images (ultrasound) at day 6 and day 22 after cancer cell injection of sgNT and sgCda KPC FC1245 tumors. d, Weight of KPC FC1245 sgNT and sgCda tumors at end stage treated with anti-PD-1 or control IgG (sgNT (IgG) n = 7, sgNT (anti-PD-1) n = 6, sgCda (IgG) n = 7, sgCda (anti-PD-1) n = 7). e, Quantification of metastatic mesenteric lymph nodes in sgNT and sgCda KPC FC1245 tumor-bearing mice treated with anti-PD-1 or control IgG (sgNT (IgG) n = 8, sgNT (anti-PD-1) n = 7, sgCda (IgG) n = 7, sgCda (anti-PD-1) n = 8). Treatment regimen is indicated in b by the black arrowheads. f, Kaplan–Meier curves of mice bearing tumors derived from sgNT and sgCda KPC FC1245 clones treated with anti-PD-1 or control IgG (sgNT (IgG) n = 15, sgNT (anti-PD-1) n = 15, sgCda clones (IgG) n = 14, sgCda clones (anti-PD-1) n = 17). Data are representative of a pool of three independent experiments; OS, overall survival. g, Weight of control (EV in sgCda) and Cda knock-in (Cda KI in sgCda) tumors treated with anti-PD-1 or control IgG. h, Quantification of metastatic mesenteric lymph nodes in control and Cda knock-in tumor-bearing mice treated with anti-PD-1 or control IgG (in gh, EV (IgG) n = 7, EV (anti-PD-1) n = 7, Cda KI (IgG) n = 6, Cda KI (anti-PD-1) n = 8). Data are representative of a pool of two independent experiments. i, Ultrasound-guided longitudinal measurements of orthotopic KPC FC1245 tumors treated with CDZ or vehicle (VHL) and anti-PD-1 or control IgG (vehicle (IgG) n = 8, VHL (anti-PD-1) n = 8, CDZ (IgG) n = 8, CDZ (anti-PD-1) n = 9). Treatment regimen is indicated by the black arrowheads. j, Weight of sgNT and sgCda KPC FC1245 tumors treated with CDZ or vehicle and anti-PD-1 or IgG. k, Quantification of metastatic mesenteric lymph nodes in CDZ- or vehicle-treated sgNT and sgCda KPC FC1245 tumor-bearing mice in combination with anti-PD-1 or IgG (in jk, vehicle sgNT (IgG) n = 5, vehicle sgNT (anti-PD-1) n = 14, CDZ sgNT (IgG) n = 9, CDZ sgNT (anti-PD-1) n = 5, vehicle sgCda (IgG) n = 8, CDZ sgCda (anti-PD-1) n = 5). In a, b and dk, n represents biological replicates. Data were analyzed by by two-way repeated measures ANOVA (a, b and i), two-way ANOVA with Tukey’s multiple comparison test (d, e, g, h, j and k) or log-rank hypothesis test (Mantel–Cox test; f). Data are shown as mean ± s.e.m. Source data
Fig. 3
Fig. 3. Targeting CDA skews TAMs toward a T cell stimulatory phenotype.
ac, T cell immune cell landscape in sgNT and sgCda (IgG-treated) s.c. Panc02 tumors. Representative micrographs of cytotoxic CD8+ T cells of sgNT and sgCda Panc02 tumors (center, top; border, bottom; a) and related histological quantification are shown (b; sgNT (center) n = 7, sgNT (border) n = 7, sgCda (center) n = 6, sgCda (border) n = 6). c, Flow cytometric quantification of cytotoxic T cells (CD8+), CD8+:CD4+ T cell ratio and activated cytotoxic T cells (CD8+CD69+ and CD8+IFNγ+) in sgNT and sgCda (IgG-treated) Panc02 tumors (CD8+IFNγ+, sgNT n = 5 and sgCda n = 5; all others, sgNT n = 6 and sgCda n = 5); scale bars, 50 µm (top) and 10 µm (bottom). d,e, Macrophage immune landscape in sgNT and sgCda (IgG-treated) s.c. Panc02 tumors. Representative micrographs (d) and related histological quantification (e) of total TAM infiltration (left; percentage of F4/80+ cells out of total area), CD206+ TAM infiltration (middle; percentage of F4/80+CD206+ cells out of total area) and CD206+ TAM polarization (right; F4/80+CD206+ cells out of F4/80+ area) in sgNT and sgCda (IgG-treated) Panc02 tumors (center and border) are shown (sgNT (center) n = 5, sgNT (border) n = 5, sgCda (center) n = 5, sgCda (border) n = 5); scale bar, 50 µm. f, T cell immune cell landscape in sgNT and sgCda orthotopic KPC FC1245 tumors. Flow cytometric quantification of cytotoxic T cells (left; CD8+), helper T cells (middle; CD4+) and activated T cells (right; CD8+IFNγ+) in sgNT and sgCda orthotopic KPC tumors treated with anti-PD-1 or control IgG (sgNT (IgG) n = 7, sgNT (anti-PD-1) n = 7, sgCda (IgG) n = 7, sgCda (anti-PD-1) n = 7). g, Macrophage immune landscape in sgNT and sgCda orthotopic KPC FC1245 tumors. Histological quantification of total TAM infiltration (left; percentage of F4/80+ cells out of total area) and CD206+ TAM infiltration (right; percentage of F4/80+CD206+ cells out of total area) in sgNT and sgCda orthotopic KPC tumors treated with anti-PD-1 or control IgG (sgNT (IgG) n = 4, sgNT (anti-PD-1) n = 4, sgCda (IgG) n = 4, sgCda (anti-PD-1) n = 4). In b and c and eg, n represents biological replicates. Data were analyzed by multiple unpaired, two-tailed Student’s t-tests (b, c and e), two-way ANOVA with Tukey’s multiple comparison test (f and g) or two-way repeated measures ANOVA (h). Data are shown as mean ± s.e.m. Source data
Fig. 4
Fig. 4. Targeting CDA overcomes anti-PD-1 resistance by shaping the TME.
ac, Tumor volume (a), histological quantification of total TAM infiltration (percentage of F4/80+ cells out of total area) and CD206+ TAM infiltration (percentage of F4/80+CD206+ cells out of total area; b) and flow cytometric quantification of activated cytotoxic CD8+ T cells (mean fluorescence intensity (MFI) IFNγ) in sgNT and sgCda orthotopic YUMM1.7 tumors treated with anti-PD-1 or control IgG (c; sgNT (IgG) n = 5, sgNT (anti-PD-1) n = 5, sgCda (IgG) n = 5, sgCda (anti-PD-1) n = 6 (a); sgNT (IgG) n = 5, sgNT (anti-PD-1) n = 5, sgCda (IgG) n = 6, sgCda (anti-PD-1) n = 5 (b); sgNT (IgG) n = 6, sgNT (anti-PD-1) n = 5, sgCda (IgG) n = 5, sgCda (anti-PD-1) n = 6 (c)). Treatment regimen is indicated in a by the black arrowheads. d,e, Volume (d) and weight of MC38 tumors overexpressing CDA (CDA O.E.) or their control (EV) treated with anti-PD-1 or control IgG (e). f, Flow cytometric quantification of intratumoral helper T cells (CD4+), cytotoxic T cells (CD8+), early activated T cells (CD8+CD69+) and CD8+:CD4+ T cell ratio (IgG n = 5, CDA O.E. (anti-PD-1) n = 6, EV (IgG) n = 4–7, EV (anti-PD-1) n = 5–9). Treatment regimen is indicated in d by the black arrowheads. g, Weight of sgNT and sgCda orthotopic KPC FC1245 tumors in mice treated with IgG or CD8-depleting antibody. All mice were treated with anti-PD-1 (sgNT (IgG) n = 13, sgNT (anti-CD8) n = 5, sgCda (IgG) n = 12, sgCda (anti-CD8) n = 6). Data are representative of a pool of two independent experiments. h, Weight of sgNT and sgCda orthotopic KPC FC1245 tumors resulting from cancer cells implanted alone or with TAMs-L (sgNT (–TAMs-L) n = 9, sgNT (+TAMs-L) n = 18, sgCda (–TAMs-L) n = 11, sgCda (+TAMs-L) n = 15). Data are representative of a pool of two independent experiments. i, Histological quantification of cytotoxic CD8+ T cells (center and border; sgNT (–TAMs-L) n = 8, sgNT (+TAMs-L) n = 9, sgCda (–TAMs-L) n = 8, sgCda (+TAMs-L) n = 7). All mice were treated with anti-PD-1. j, Flow cytometric quantification of activated (GZMB+ and INFγ+) and proliferating (Ki67+) OT-I CD8+ T cells in coculture with OVA-expressing sgNT or sgCda Panc02 cells with or without BMDMs (Mφ; n = 3). In ai, n represents biological replicates, whereas in j, n represents independently collected cell seedings. Data were analyzed by two-way ANOVA with Tukey’s multiple comparison test (b, c, g, h and j), two-way repeated measures ANOVA (a and d), one-way ANOVA with Tukey’s multiple comparison test (e and f) or two-way ANOVA with a Sidak’s multiple comparison test (i). Data are shown as mean ± s.e.m. Source data
Fig. 5
Fig. 5. CDA regulates uracil nucleotide production by cancer cells.
a,b, Intracellular abundance of total uridine (a) and cytidine (b) in sgNT and sgCda KPC FC1245 cells (sgNT n = 4 and sgCda n = 4). c,d, Fractional contribution (percentage of labeled metabolite out of total amount) of supplemented 0.1 mM [13C9,15N3]cytidine to the intracellular cytidine (c) and uridine (d) pools in sgNT and sgCda KPC FC1245 cells (sgNT n = 4 and sgCda n = 4). e, Left, intracellular levels of uracil nucleotides (UMP, UDP and UTP) in sgNT and sgCda KPC FC1245 cells. Right, fractional contribution of supplemented 0.1 mM [13C9,15N3]cytidine to the intracellular uracil nucleotide pools (sgNT n = 4 and sgCda n = 4). f, Extracellular levels of cytidine (left) and uridine (right) in the interstitial fluid of orthotopic sgNT and sgCda KPC FC1245 tumors (sgNT n = 11 and sgCda n = 10 (left); sgNT n = 10 and sgCda n = 9 (right)). g, Extracellular levels of UDP (left) and UTP (right) in the interstitial fluid of orthotopic sgNT and sgCda KPC FC1245 tumors (sgNT n = 10 and sgCda n = 9). h, Extracellular levels of UDP in the culture medium of sgNT and sgCda KPC FC1245 cells (sgNT n = 3 and sgCda n = 4). In ae and h, n represents independently collected cell seedings. In f and g, n represents biological replicates. In ag, cytidine, uridine and uracil-containing nucleotides were measured by using LC–MS. In h, UDP in the culture medium was measured by using enzyme-linked immunosorbent assays. In ae, KPC FC1245 cells were cultured in DMEM supplemented with 10% dialyzed FBS (to remove the naturally present cytidine) and 0.1 mM [13C9,15N3]cytidine. In h, KPC FC1245 cells were cultured in DMEM supplemented with 10% dialyzed FBS (to remove the naturally present cytidine) and 0.1 mM unlabeled cytidine. Data were analyzed by unpaired, two-tailed Student’s t-tests (ad and fh) or multiple unpaired, two-tailed Student’s t-tests (e). Data are shown as mean ± s.e.m. Source data
Fig. 6
Fig. 6. Expression profile of the UDP cognate receptor P2Y6.
a, UMAP of P2RY2, P2RY6 and P2RY14 expression in different cell populations of pancreatic tissue from treatment-naive individuals with PDAC (n = 24). The number of cells analyzed is 83,960. b, Subclustering of myeloid cells/macrophages in single-cell data of human PDAC. Left, cluster analysis based on gene expression (top) or primary tumor versus adjacent tissue (bottom). The dot plot on the right shows the expression of some myeloid genes in the different clusters. Middle, UMAP of the anti-inflammatory gene MRC1 (CD206) or the pan-myeloid markers CD14 and CD163 (left column) and UMAP of P2RY2, P2RY6 and P2RY14 (right column). Right, dot plot showing P2RY2, P2RY6 and P2RY14 expression across the different myeloid cell subclusters. P2RY4 was undetectable. The number of cells analyzed is 6,482. c, Left, flow cytometric quantification of P2Y6 expression (ΔMFI, that is, MFI of P2Y6 minus MFI of the fluorescence minus one (FMO)) in different cell populations of human PDAC samples. Middle, flow cytometric quantification of P2Y6 expression (ΔMFI P2Y6) in paired M1-like (CD206CD204) and M2-like (CD206+CD204+) TAMs in human PDAC tumors. Right, representative histogram of P2Y6 expression (ΔMFI P2Y6) in TAM subsets; Iso, isotype control; % max, each curve was scaled to mode = 100% (ECs and cancer cells, n = 3 (left); all others n = 5; n = 6 (right)). d,e, Flow cytometric quantification of P2Y6 expression (ΔMFI P2Y6) in different cell populations from orthotopic KPC FC1245 (d) and s.c. Panc02 (e) tumors (n = 7). In c, n represents the number of individuals. In d and e, n represents the number of biological replicates. Data were analyzed by paired, two-tailed Student’s t-tests (c, middle) and are shown as mean ± s.e.m. Source data
Fig. 7
Fig. 7. CDA–UDP–P2Y6 axis shapes macrophage phenotype.
a, BMDM migration in response to UDP (100 µM), MRS2578 (10 µM), UDP + MRS2578 or nothing (basal; n = 6). b, Migration of P2Y6- or P2Y14-silenced BMDMs in the presence or absence of UDP (n = 3); Scr, scrambled. c, P2ry6 expression in M0 (unstimulated), M1-like (IFNγ + LPS) and M2-like (IL-4) polarized BMDMs (n = 3). d, Flow cytometric quantification of P2Y6 expression (percentage of P2Y6+ cells out of alive) in M0, M1-like and M2-like polarized BMDMs (n = 3). e, Flow cytometric quantification of P2Y6 expression (ΔMFI P2Y6 in alive cells) in M1-like (IFNγ + LPS) and M2-like (IL-4) polarized hMDMs (n = 3). f, Flow cytometric quantification of M2-like BMDMs (percentage of CD206+ out of F4/80+ cells) after stimulation with IL-4, UDP, MRS2578 or nothing (basal; n = 3). g, BMDM migration in the presence of sgNT or sgCda Panc02 cells supplemented with UDP (bottom chamber), MRS2578 (top chamber) or nothing (basal; n = 4). h, Flow cytometric quantification of M2-like BMDMs (percentage of CD206+ out of F4/80+ cells) cocultured with sgNT or sgCda Panc02 cells in the presence of UDP or MRS2578 (n = 3–4). i, Concentration–response curves for the peak increase in fluorescence ratio in response to UDP or UTP. Solid lines represent best fit with the Hill function. Half-maximal effective concentration (EC50) values were 42 ± 5 nM for UDP and 103 ± 12 nM for UTP in wild-type P2Y6 (P2y6WT) BMDMs (UDP n = 3; UTP n = 6). j, Time course of the changes in the fluorescence ratio (F340/F380) of the calcium indicator Fura-2 in P2y6WT BMDMs in response to the indicated concentrations of UDP (left) or UTP (right). Responses were normalized to the response to the calcium ionophore ionomycin (2 µM; UDP n = 3; UTP n = 6). In aj, n represents independently collected cell seedings. Data were analyzed by one-way ANOVA with Tukey’s multiple comparison test (ad and f), unpaired, two-tailed Student’s t-tests (e) or two-way ANOVA with a Tukey’s multiple comparison test (g and h). Data are shown as mean ± s.e.m. Source data
Fig. 8
Fig. 8. CDA- and UDP-dependent anti-PD-1 resistance is executed by macrophages via the P2Y6 receptor.
a, Longitudinal measurements of tumor area by ultrasound imaging in KPC FC1245 tumor-bearing P2y6WT and P2y6ΔMy mice treated with anti-PD-1 or control IgG (P2y6WT (IgG) n = 10, P2y6WT (anti-PD-1) n = 10, P2y6ΔMy (IgG) n = 5, P2y6ΔMy (anti-PD-1) n = 7, P2y6ΔMy + TAMs-L (anti-PD-1) n = 4). Treatment regimen is indicated by the black arrowheads. b, Weight of sgNT and sgCda KPC FC1245 tumors in P2y6WT and P2y6ΔMy mice treated i.p. with UMP-CP (10 mg per kg (body weight)) or PBS and cotreated with anti-PD-1 (sgNT P2y6WT (PBS) n = 7, sgCda P2y6WT (PBS) n = 7, sgCda P2y6WT (UMP-CP) n = 13, sgCda P2y6ΔMy (UMP-CP) n = 14). Data are representative of a pool of two independent experiments. c, Correlation between CDA expression in cancer cells (CCs) versus IFNG or PRF1 expression in CD8+ T cells or P2RY6, CD163, MSR1 or MRC1 expression in macrophages at single-cell resolution in 11 diverse cancer types. d, Spearman correlation analysis between P2RY6 and CDA expression in individuals with PDAC from TCGA (n = 177); TPM, transcripts per million. e, Scheme of the contribution of CDA and P2Y6+ macrophages to immunotherapy resistance. Induction of CDA expression in pancreatic cancer cells contributes to the production and release of uracil nucleotides. Released UDP, as well as UTP-derived UDP, binds with high affinity to the cognate receptor P2Y6 expressed by TAMs, therefore fostering their recruitment and immunosuppressive features. This ultimately shields the tumor from the entry and activation of cytotoxic T cells, a condition that renders the tumor refractory to anti-PD-1 treatment. Inhibition of CDA or P2Y6 breaks this cross-talk between cancer cells and TAMs by decreasing the amount of UDP in the TME. It follows that tumors are less infiltrated by immunosuppressive TAMs, and their phenotype is now more immunostimulatory, altogether favoring (instead of preventing) the recruitment and activation of cytotoxic T cells in response to anti-PD-1 treatment. Under this condition, resistant tumors are sensitized to anti-PD-1 therapy, displaying reduced primary growth and metastatic dissemination. In a and b, n represents biological replicates. Data were analyzed by two-way repeated measures ANOVA (a), two-way ANOVA with a Tukey’s multiple comparison test (b) and two-sided Spearman’s test (c). Data are shown as mean ± s.e.m. Source data
Extended Data Fig. 1
Extended Data Fig. 1. Identification of CDA in cancer cells as metabolic player in immunotherapy resistance.
(a) Volume of MC38, CT26 and Panc02 tumors, treated with anti-CTLA-4 (blue), anti-PD-1 (red) or control (CTRL) IgG (black line). n=6-8. n represents biological replicates. (b) Volcano plots depicting log2 fold change and log10 (p-value) of differentially expressed genes (Cda / CDA indicated in red) between responsive and non-responsive tumors, for each of the datasets. From left to right, (1; GSE196790) MC38 vs Panc02; murine; anti-CTLA-4 and anti-PD-1 treatment; log2 fold change = 1.93, p-value < 1x10⁻⁴; (2; GSE78220) metastatic melanoma; human; anti-PD-1 treatment; log2 fold change = 1.73, p-value = 0.038; (3; GSE67501) renal cancer; human; anti-PD-1 treatment; log2 fold change = 1.60, p-value = 0.027; (4; phs000452.v2.p) metastatic melanoma; human; anti-CTLA-4 treatment; log2 fold change = -1.59, p-value = 0.254. Statistical analysis: p value was assessed by two-way RM ANOVA (a), two-sided limma package (b). Graphs show mean ± SEM.
Extended Data Fig. 2
Extended Data Fig. 2. CDA in cancer cells correlates with immunosuppression.
(a) Violin plot from Xena PanCAN-GTex platform (and selecting for TCGA bulk RNA sequencing datasets only) representing CDA expression in colon (Normal Tissue n=308, Primary Tumor n=288), stomach (Normal Tissue n=210, Primary Tumor n=414) and esophagus (Normal Tissue n=653, Primary Tumor n=195) cancer. (b–d) Histological analysis of treatment-naïve, resectable PDAC tumors (out of cohort #1; stage IIb-III; N1-N2). (b) Violin plots of histological quantification of total CD68+ at tumor border or center. (c) Violin plots of histological quantification of immunosuppressive CD206+ tumor-associated macrophages (TAMs) at tumor border or center. (d) Violin plots of histological quantification of cytotoxic T cells (CD8+) at tumor border or center. CDAhigh n=14 and CDAlow n=17 PDAC patients. (e) Cda expression in different cell populations sorted from murine orthotopic KPC FC1245 tumors. n=4. n represents biological replicates. (f) Cda expression in different cell populations sorted from murine s.c. Panc02 tumors (sorted Panc02 CD90.1+ cells and in vitro Panc02 cells in grey as reference). TAMs n=4; in vitro Panc02 n=3; all the others n=2. n represents biological replicates. (g) Cda expression in different cell populations in mouse PDAC (KPC GEMM) from a publicly available single-cell RNA-sequencing (scRNAseq) dataset. n=4. n represents biological replicates. Statistical analysis: p value was assessed by unpaired, two-tailed Student’s t-test (a, b-d). Graphs show mean ± SEM.
Extended Data Fig. 3
Extended Data Fig. 3. Tools’ validation for the study of CDA’s role in immunotherapy resistance.
(a-b) (a) Cda expression in control (sgNT) and sgCda #1 or sgCda #2 (otherwise called sgCda) Panc02 cells. n=3. n represents independently collected cell seedings. (b) CDA expression in sgNT and sgCda #1 or sgCda #2 Panc02 cells. Representative out of 3 independent experiments. Arrowhead shows CDA specific band. (c-e) (c) Weight of sgNT and sgCda s.c. Panc02 tumors, treated with anti-PD-1 or control IgG. sgNT (IgG) n=7, sgNT (anti-PD-1) n=7, sgCda (IgG) n=8, sgCda (anti-PD-1) n=9. (d-e) Growth and weight of sgNT and sgCda #1 s.c. Panc02 tumors, treated with anti-PD-1 or IgG. Treatment regimen is indicated in (d) by the black arrowheads. sgNT (IgG) n=7, sgNT (anti-PD-1) n=7, sgCda #1 (IgG) n=7, sgCda #1 (anti-PD-1) n=8. n represents biological replicates. (f-g) (f) Cda expression in sgNT and sgCda KPC FC1245 cells. n=3. n represents independently collected cell seedings. (g) CDA expression in sgNT and sgCda KPC FC1245 cells. Representative out of 3 independent experiments. Arrowhead shows CDA specific band. (h) Representative images of tumors (left) and metastatic mesenteric lymph nodes (right; arrow) of sgNT and sgCda orthotopic KPC FC1245 tumor-bearing mice, treated with anti-PD-1 or IgG. Scale bar, 1 cm. (i-j) (i) Cda expression in sgNT and sgCda KPC FC1199 cells. n=4. n represents independently collected cell seedings. (j) CDA expression in sgNT and sgCda KPC FC1199 cells. Representative out of 3 independent experiments. Arrowhead shows CDA specific band. (k-l) (k) Weight of sgNT and sgCda orthotopic KPC FC1199 tumors, treated with anti-PD-1 or IgG. (l) Quantification of metastatic mesenteric lymph nodes in sgNT and sgCda KPC FC1199 tumor-bearing mice, treated with anti-PD-1 or IgG. (k, l) sgNT (IgG) n=11, sgNT (anti-PD-1) n=17, sgCda (IgG) n=9, sgCda (anti-PD-1) n=14. n represents biological replicates. Data are representative of a pool of two independent experiments. (m-n) Pdcd1 and Cd274 expression in bulk RNAseq from Panc02 sgNT and sgCda tumors. n=5. n represents biological replicates. (o) CD274 expression (MFI in alive cells) in sgNT or sgCda Panc02, KPC FC1245 and KPC FC1199 cells. n=3. n represents independently collected cell seedings. (p) CDA expression in sgNT KPC FC1245, non-transduced (referred to as “-“ in the panel), as well as sgCda KPC FC1245 cells transduced with an empty vector (EV) or with a vector overexpressing Cda (CDA KI) by Western Blot. Representative out of 3 independent experiments. Arrowhead shows CDA specific band. (q) Mutational burden of Panc02 sgNT and sgCda cells. Cas9 transcription was induced (+) or not (-) with doxycycline (GSE196790). n=2. n represents independently collected cell seedings. (r) Body weight of sgNT or sgCda KPC FC1245 tumor bearing-mice, treated with CDZ/control vehicle, in combination with α-PD-1 or IgG. Vehicle-sgNT (IgG) n=4, vehicle-sgNT (anti-PD-1) n=4, CDZ-sgNT (IgG) n=4, CDZ-sgNT (anti-PD-1) n=4, vehicle-sgCda (anti-PD-1) n=7 and CDZ-sgCda (anti-PD-1) n=7. Treatment regimen is indicated by the black arrowheads. n represents independently collected cell seedings. Data are representative of a pool of two independent experiments. (s) Cell proliferation of control and Cda-depleted Panc02, KPC FC1245 and KPC FC1199 cells. n=2-3. n represents independently collected cell seedings. Statistical analysis: p value was assessed by one-way ANOVA with Tukey’s multiple comparison test (a), two-way ANOVA with Tukey’s multiple comparison test (c, e, k, l,), two-way RM ANOVA (d and s), unpaired, two-tailed Student’s t-test (f, i, m, n), multiple unpaired, two-tailed Student’s t-test (o). Graphs show mean ± SEM.
Extended Data Fig. 4
Extended Data Fig. 4. CDA inhibition re-shapes the tumor immune microenvironment.
(a) Flow cytometric quantification of (left) total (F4/80+), (middle) immunostimulatory (CD11c+F4/80+), and (right) immunosuppressive (CD206+F4/80+) tumor-associated macrophages (TAMs) in IgG-treated sgNT and sgCda Panc02 tumors. (right) sgNT (n=9) and sgCda (n=9); (left and middle) sgNT (n=6) and sgCda (n=6). n represents biological replicates. (b-c) (b) Flow cytometric quantification of intratumoral helper (CD4+) and regulatory (CD4+Foxp3+CD25+) T cells or (c) total natural killer cells (NKp46+), neutrophils (Ly6G+), dendritic cells (CD11c+) in IgG-treated sgNT and sgCda Panc02 tumors. (b) CD4+, sgNT (n=7) and sgCda (n=6); Tregs, sgNT (n=6) and sgCda (n=5); (c) DCs, sgNT (n=6) and sgCda (n=6); all the others, sgNT (n=7) and sgCda (n=7). n represents biological replicates. (d-e) (d) Cda expression in sgNT and sgCda YUMM 1.7 cells. n=3. n represents independently collected cell seedings. (e) CDA expression in sgNT and sgCda YUMM 1.7 cells. n represents independently collected cell seedings. Arrowhead shows CDA specific band. (f) Cell proliferation of sgNT and sgCda YUMM 1.7 cells. n=3. n represents independently collected cell seedings. (g) Cda expression in (left) MC38 and Panc02 cells and (right) whole tumors. MC38 cells n=3; MC38 tumor n=2; Panc02 cells n=4; Panc02 tumor n=3. n represents (in vitro) independently collected cell seedings or (tumor) biological replicates. (h-i) (h) Cda expression in MC38 cells transduced with empty vector (EV) or a vector overexpressing Cda (CDA O.E). n=3. n represents independently collected cell seedings. (i) CDA expression in non-transduced (referred to as WT), as wells as EV or CDA O.E MC38 cells. n represents independently collected cell seedings. Arrow shows CDA specific band. (j-k) (j) Growth and (k) weight of sgNT and sgCda s.c. Panc02 tumors in nude (NMRI-Fox1nu) or immunocompetent (C57BL/6) mice. (j) sgNT-C57BL/6 n=9, sgCda-C57BL/6 n=9, sgNT-NMRI-Fox1nu n=7, sgCda-NMRI-Fox1nu n=7; (k) sgNT-C57BL/6 n=9, sgCda-C57BL/6 n=8, sgNT-NMRI-Fox1nu n=7, sgCda-NMRI-Fox1nu n=6. n represents biological replicates. Treatment regimen is indicated in (j) by the black arrowheads. (l) Flow cytometric quantification (at end-stage) of cytotoxic T cells (% of CD8+ out of TCRβ+ cells) in blood of KPC FC1245 tumor-bearing mice, treated with anti-PD-1 and IgG or anti-CD8 depleting antibody (anti-CD8). sgNT (IgG) n=5, sgCda (IgG) n=5, sgNT (anti-CD8) n=4, sgCda (anti-CD8) n=5. n represents biological replicates. (m) OT-I CD8+ T-cell killing capacity of sgNT and sgCda OVA-expressing Panc02 cells. n=3. n represents independently collected cell seedings. (n-o) Flow cytometric quantification of (n) total H-2Kb MHC class I and (o) H-2Kb MHC class I bound to the OVA-derived peptide SIINFEKL in OVA-expressing sgNT and sgCda Panc02 cells, at baseline or after IFN-y stimulation. sgNT (- IFN-y) n=7, sgCda (- IFN-y) n=7, sgNT (+ IFN-y) n=6, sgCda (+ IFN-y) n=6. n represents independently collected cell seedings. Statistical analysis: p value was assessed by multiple unpaired, two-tailed Student’s t-test (a, b, n-o), unpaired, two-tailed Student’s t-test (c, d, h), two-way RM ANOVA (f and j), two-way ANOVA with Tukey’s multiple comparison test (k), two-way ANOVA with Sidak’s multiple comparison test (l, m). Graphs show mean ± SEM.
Extended Data Fig. 5
Extended Data Fig. 5. Production of various nucleotides and carbon tracing in cancer cells upon CDA depletion.
(a-b) Intracellular abundance of total (a) uridine and (b) cytidine in sgNT and sgCda Panc02 cells. sgNT n=4 and sgCda n=4. (c) DNA and RNA synthesis of sgNT and sgCda KPC FC1245 cells. DNA, n=5; RNA n=6. (d-e) (d) Intracellular levels of adenine (AMP, ADP and ATP) and (e) cytosine (CMP, CDP and CTP) nucleotides in sgNT and sgCda KPC FC1245 cells. sgNT n=4 and sgCda n=4. (f) UDP-hexose species (UDP-glucose and UDP-galactose) in sgNT and sgCda KPC FC1245 and Panc02 cells. sgNT n=4 and sgCda n=4. (g) Fractional contribution (percentage of labelled metabolite out of total amount) of supplemented 13C5,15N2 glutamine to the intracellular uracil nucleotide pools (UMP, UDP and UTP) in sgNT and sgCda KPC FC1245 cells. sgNT n=3 and sgCda n=3. (h-j) (h) Intracellular levels of uracil nucleotides, (i) adenine nucleotides and (j) cytosine nucleotides in sgNT and sgCda Panc02. sgNT n=4 and sgCda n=4. (k) Extracellular levels of cytidine in mouse serum (tumor-free), standard or dialyzed fetal bovine serum (FBS and Dial. FBS), culture medium of bone marrow-derived macrophages (BMDMs) and (staurosporine-treated) dying KPC FC1245 cancer cells. Mouse serum n=6 (n represents biological replicates), FBS n=1, Dial. FBS n=1, BMDMs n=3, dying KPC cells n=3. (l) Extracellular levels of (left) glucose and (right) glutamine in the interstitial fluid of orthotopic sgNT and sgCda KPC FC1245 tumors. (left) sgNT n=7 and sgCda n=5; (right) sgNT n=10 and sgCda n=9. (m) Extracellular levels of ATP in the culture medium of sgNT and sgCda KPC FC1245 cells. sgNT n=4 and sgCda n=4. (4a-j, l, m) n represents independently collected cell seedings. (a and b, d-l) cytidine, uridine, UDP-hexose, uracil-, adenine- and cytosine-containing nucleotides, glucose, and glutamine were measured by employing liquid chromatography-mass spectrometry. (m) ATP in the culture medium was measured by employing ELISA assay. Cancer cells were cultured in DMEM medium supplemented with 10% dialyzed FBS (to remove the naturally present cytidine) and (a, b, f, h-j) 0.1 mM unlabeled cytidine or (d-f) 0.1 mM 13C9,15N3 cytidine. (g) KPC FC1245 were cultured in DMEM medium supplemented with 10% dialyzed FBS, 0.1 mM unlabeled cytidine and 2 mM 13C5,15N2 glutamine. Statistical analysis: p value was assessed by unpaired, two-tailed Student’s t-test (a-c, l and m), multiple unpaired Student’s t-test (d-j). Graphs show mean ± SEM.
Extended Data Fig. 6
Extended Data Fig. 6. P2Y receptors in tumor-associated macrophages (TAMs).
(a) Expression of P2Y receptor family members in TAMs of murine (left, E-MTAB-5032) LLC and (right, GSE126722) 4T1 tumors. In box plot, boxes correspond to the 25th and 75th quartiles, horizontal lines to the median, and whiskers extend to 1.5 times the interquartile range, with outliers shown by dots. LLC n= 16, 4T1 n= 10. (b) (left) P2ry2, (middle) P2ry6 and (right) P2ry14 expression in different cell populations in mouse PDAC (KPC GEMM) from a publicly available scRNA-seq dataset (GSE129455). n=4. n represents biological replicates. (c) P2ry6 expression in TAMs and CD90.1+ cancer cells sorted from orthotopic KPC FC1245 tumors. n=4. n represents biological replicates. Statistical analysis: p value was assessed by unpaired, two-tailed Student’s t-test (c). Graphs show mean ± SEM.
Extended Data Fig. 7
Extended Data Fig. 7. Expression of ectonucleotidases and P2Y6 in PDAC patients and mouse model.
(a-d) Uniform manifold approximation and projection (UMAP) representing the different cell clusters of PDAC (a) patients or (b) mice, extracted from publicly available scRNAseq datasets (GSA:CRA001160 and GSE129455). Number of cells analyzed is (a) 83960 and (b) 11236. (c-d) Differential expression gene analysis (DEGs) of different ectonucleotidases across the different cell clusters in both PDAC (c) patients and (d) mice. (e) Time course of the changes in the fluorescence ratio (F340/F380) of the calcium indicator Fura-2 in P2ry6WT bone marrow-derived macrophages (BMDMs) in response to 1000 nM of UDP with or without MRS2578 (10 µM). Responses were normalized to the response to the calcium ionophore ionomycin (2 µM). n=3. n represents independently collected cell seedings. (f) P2ry6 and P2ry14 expression in BMDMs after siRNA-mediated silencing by siP2ry6 or siP2ry14 and scramble controls. n=3. n represents independently collected cell seedings. (g) Flow cytometric quantification of CD80 and CD206 expression (ΔMFI) in human M1-like (IFN-y + LPS) and M2-like (IL-4) in vitro polarized monocyte-derived macrophages (hMDMs). n=3. n represents independently collected cell seedings. (h) P2ry6 expression in TAMs and tumor-associated neutrophils (TANs) sorted from orthotopic KPC FC1245 tumors in P2ry6WT and P2ry6ΔMy mice. n=4. n represents biological replicates. Statistical analysis: p value was assessed by unpaired, two-tailed Student’s t-test (c and f), multiple unpaired, two-tailed Student’s t-test (d), two-way ANOVA with Sidak’s multiple comparison test (g). Graphs show mean ± SEM.

Similar articles

Cited by

References

    1. Smyth, M. J., Ngiow, S. F., Ribas, A. & Teng, M. W. Combination cancer immunotherapies tailored to the tumour microenvironment. Nat. Rev. Clin. Oncol.13, 143–158 (2015). - PubMed
    1. Abaza, A. et al. Programmed cell death protein 1 (PD-1) and programmed cell death ligand 1 (PD-L1) immunotherapy: a promising breakthrough in cancer therapeutics. Cureus15, e44582 (2023). - PMC - PubMed
    1. Van Allen, E. M. et al. Genomic correlates of response to CTLA-4 blockade in metastatic melanoma. Science350, 207–211 (2015). - PMC - PubMed
    1. Herbst, R. S. et al. Pembrolizumab versus docetaxel for previously treated, PD-L1-positive, advanced non-small-cell lung cancer (KEYNOTE-010): a randomised controlled trial. Lancet387, 1540–1550 (2016). - PubMed
    1. Ascierto, M. L. et al. The intratumoral balance between metabolic and immunologic gene expression is associated with anti-PD-1 response in patients with renal cell carcinoma. Cancer Immunol. Res.4, 726–733 (2016). - PMC - PubMed

Publication types

MeSH terms

LinkOut - more resources