. 2024 Jun 6;15(1):4833.
doi: 10.1038/s41467-024-48491-y.

Single-cell transcriptomic atlas reveals increased regeneration in diseased human inner ear balance organs

Affiliations

Single-cell transcriptomic atlas reveals increased regeneration in diseased human inner ear balance organs

Tian Wang et al. Nat Commun. .

Abstract

Mammalian inner ear hair cell loss leads to permanent hearing and balance dysfunction. In contrast to the cochlea, vestibular hair cells of the murine utricle have some regenerative capacity. Whether human utricular hair cells regenerate in vivo remains unknown. Here we procured live, mature utricles from organ donors and vestibular schwannoma patients, and present a validated single-cell transcriptomic atlas at unprecedented resolution. We describe markers of 13 sensory and non-sensory cell types, with partial overlap and correlation between transcriptomes of human and mouse hair cells and supporting cells. We further uncover transcriptomes unique to hair cell precursors, which are unexpectedly 14-fold more abundant in vestibular schwannoma utricles, demonstrating the existence of ongoing regeneration in humans. Lastly, supporting cell-to-hair cell trajectory analysis revealed 5 distinct patterns of dynamic gene expression and associated pathways, including Wnt and IGF-1 signaling. Our dataset constitutes a foundational resource, accessible via a web-based interface, serving to advance knowledge of the normal and diseased human inner ear.


Conflict of interest statement

The authors declare no competing interests.

Figures
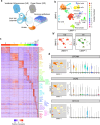
Fig. 1
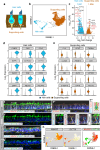
Fig. 1. Sensory and non-sensory cell types in utricles from vestibular schwannoma and organ donor patients.
a Cartoon depicting procurement of human utricles from patients undergoing translabyrinthine resection of vestibular schwannoma (VS) and organ donors (OD). Samples from both sources were used for histological and single-cell RNA sequencing analyses. b UMAP plot of integrated dataset of four VS utricles and two OD utricles showing 27,631 single cells following all quality control steps including exclusion of doublets. Thirteen cell clusters were identified, and marker genes were used to annotate the sensory and non-sensory cell types. b’ The UMAP plot from (b) is decomposed into the cells originating from OD and VS subjects. There were 15,309 and 12,322 cells from the OD and VS samples, respectively. c Heatmap showing the top 50 differentially expressed genes among the 13 cell clusters. The top differentially expressed genes of each cluster are shown on the right side of the heatmap. A full list of these genes is found in the Source Data file. The heatmap is colored by relative expression from -2 (blue), 0 (white), and 2 (red). d Expression of established markers of epithelial cells (EPCAM), non-sensory cells and type II hair cells (SOX2), and sensory cells (MYO7A) within the cell clusters. UMAP plots colored by log2 expression (values of 0 in white to maximum in red as indicated) and violin plots colored by cell cluster are shown. EPCAM was highly expressed in clusters 1, 2, 5, 6, 7, and 9; SOX2 in clusters 1, 4, 5, 6, 7, and 12; and MYO7A in clusters 7, which represents hair cells. SOX2 labels a subgroup of the MYO7A+ cells indicating type II hair cells. Source data are provided as a Source Data file.
Fig. 2
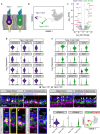
Fig. 2. Differential gene expression in human vestibular hair cells and supporting cells.
a Schematic of utricle sensory epithelium highlighting hair cells (blue) and supporting cells (brown). b SWNE plot colored by hair cell and supporting cell groups with the hair cell precursor group (gray) excluded. c Volcano plot with enriched hair cell versus supporting cell genes using pseudobulk DESeq2 analysis. The top 5 differentially expressed genes are labeled as well as validated markers (red triangles). Using a log2 threshold of 2 and FDR < 0.01, 1259 genes were enriched in the supporting cells and 1251 in the hair cells (listed in the Source Data file). d, e Violin plots depicting 12 highly enriched hair cell (d) and supporting cell genes (e) using the Wilcoxon rank sum test. f–g’ Validation of the hair cell marker SYT14 (cyan) and supporting cell marker ANXA2 (red) in utricles from organ donor and vestibular schwannoma patients. Cryosections were processed for fluorescent in situ hybridization and immunostaining for MYO7A (green), GFAP (gray), and DAPI (blue). Yellow dashed lines mark the basement membrane of the sensory epithelium. SYT14 is expressed in MYO7A+ hair cells in (f’) and ANXA2 is expressed in the cytoplasm of GFAP+ supporting cells in (f”) in OD. f”’ Cartoon depicting the expression pattern of SYT14 (perinuclear cytoplasm) and ANXA2 (apical cytoplasm) in hair cells and supporting cells, respectively. Boxed area is magnified in individual panels in (f””). Maroon dashed lines outline the MYO7A+/GFAP hair cells expressing SYT14. Yellow dashed lines outline the MYO7A/GFAP+ supporting cells expressing ANXA2. g, g’ SYT14 marks hair cells and ANXA2 supporting cells in vestibular schwannoma utricle, which is notably disorganized with loss of hair cells. h SWNE plots displaying enrichment of ANXA2 in supporting cells and SYT14 in hair cells. Log2 expression is shown with 0 in white and maximum in red at the indicated thresholds. Merged color SWNE plot demonstrates minimal overlap between these marker genes. Scale bar = 25 µm in (ff”, g, g’) 10 µm in (f””). Source data are provided as a Source Data file.
Fig. 3
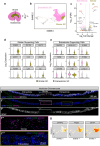
Fig. 3. Hair cell subtypes in vestibular schwannoma and organ donor utricles.
a Schematic showing amphora-shaped type I hair cells (purple) with apical neck and calyceal innervation. Type II hair cells (green) are goblet-shaped and display bouton-type innervation. b SWNE plot with distinct clusters of type I and II hair cells highlighted. c Volcano plots of enriched genes in type I and II hair cells. Top 5 differentially expressed genes are labeled with validated genes marked (red triangles). Also see the Source Data file. d, e Violin plots of enriched markers of type I and II hair cells. fi Fluorescent in situ hybridization and immunostaining validating expression of ADAM11 (yellow) in type I hair cells (asterisks) and KCNH6 (yellow) in type II hair cells (arrowheads) in sections of organ donor and vestibular schwannoma utricles counterstained with MYO7A (blue), SOX2 (green), and TUJ1 (magenta). f’ High magnification image of a type I hair cell, which is SOX2 (green), amphora-shaped, displaying TUJ1+ calyx (magenta), and expressing ADAM11 (yellow). f” High magnification image of a type II hair cell from F (yellow box). This SOX2+ (green) type II hair cell is goblet-shaped, displays basolateral process, and lacks ADAM11 expression. g’ Examples of SOX2 (green), ADAM11+ (yellow) type I hair cells with TUJ1+ calyx (magenta), and SOX2+ (green) type II hair cells without ADAM11 (yellow) expression in vestibular schwannoma utricle, respectively, from g (red box). h’ High magnification image of SOX2+ (green) type II hair cells with KCNH6 (yellow) expression, and SOX2 (green) type I hair cells without KCNH6 (yellow) expression and with TUJ1+ calyx (magenta) in organ donor utricle, respectively, from h (green box). i’ Additional examples of SOX2+ (green) type II hair cells with KCNH6 (yellow) expression, and SOX2-negative, TUJ1+ calyx (magenta) type I hair cells without KCNH6 (yellow) expression in organ donor utricle, respectively, from h (green box). j Violin and merged SWNE plots showing enrichment of ADAM11 and KCNH6 in type I and II hair cells, respectively. Scale bar = 25 µm in (fi), 5 µm in (f’, f”, g’, h’, i’). Source data are provided as a Source Data file.
Fig. 4
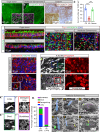
Fig. 4. Human vestibular supporting cell subtypes in vestibular schwannoma and organ donor utricles.
a Diagram showing the crescent shaped striolar central region and the peripheral extrastriolar region of the utricle (A: Anterior, P: posterior, L: lateral, M: medial). b SWNE plot colored by putative striolar and extrastriolar supporting cells. c Differential gene expression using DESeq2 pseudobulk analysis shows 26 and 31 genes significantly enriched in striolar and extrastriolar supporting cells, respectively. See the Source Data file for complete list of genes. d, e Violin plots showing the expression of select marker genes of striolar versus extrastriolar supporting cell genes using Wilcoxon rank sum test. ff” Combined fluorescent in situ hybridization and immunostaining validating expression of FRZB (green) in extrastriolar supporting cells and SFRP2 (magenta) in striolar supporting cells in sections of vestibular schwannoma utricles counterstained with MYO7A (gray), and GFAP (blue). GFAP (gray) expressed at a high level in extrastriola, but lower in striola (bracket) in (f”). f”’, f”” shows high magnification images of striola (pink box) and extrastriola (brown box) in (f’). SFRP2 (magenta) is highly expressed in striola, FRZB (green), and GFAP (blue) are highly expressed in extrastriola. g SWNE plots displaying enrichment of SFRP2 in striolar supporting cells and FRZB in extrastriolar supporting cells. Log2 expression is shown with 0 in white and maximum in red at the indicated thresholds. Scale bar = 100 µm in (ff””). Source data are provided as a Source Data file.
Fig. 5
Fig. 5. Hair cell degeneration in vestibular schwannoma utricles.
a, b Representative low magnification images of MYO7A+ hair cells (HC, green) in organ donor (OD) and vestibular schwannoma (VS) utricles, illustrating fewer HCs in the latter. c MYO7A-DAB (brown) staining showing many HCs in cadaveric utricles. d Quantification showing significantly fewer HCs in VS than OD and cadaveric utricles. e, f Compared to OD utricles, the VS sensory epithelium appeared thinner, contained fewer HCs (MYO7A, green), with many supporting cells (GFAP, red) remaining. VS HCs appeared dysmorphic and lacked bundles. g, h Relative to OD utricles, VS utricles displayed fewer type I HCs (asterisks, SOX2 (blue), TUJ1+ calyces (red)) and type II HCs (arrow, SOX2+(blue)). i, j F-actin-labeled (green) degenerating HCs (arrowhead and inset, cytocauds with actin-rich cables) in VS but not OD tissues. kl’ MYO7A+ HCs (red, asterisks) with damaged bundles (F-actin, gray) in VS but not OD tissues. k”l”’ Four types of bundle morphology observed in (k, l): long (blue), damaged, long (red), short (green), and bundle-less (purple). m Percentage of HCs displaying distinct bundle morphology. Most HCs are bundle-less in VS tissues, whereas many OD HCs have long bundles. n–s Scanning electron microscopy of VS HCs. n HC with intact bundle (blue). o Two HCs with remnants of bundles (purple); the left HC has intact bundle. p Remnants of stereocilia and kinocilium (yellow). q HC with short (green) and tall bundles located at the opposite poles. r HC with few intact stereocilia and remnants of a bundle at the opposite pole. s HC with a few thin, short stereocilia and remnants of a bundle. Data shown as mean ± S.D. and compared using one-way ANOVA. ***p < 0.0001 in (d). n = 13 for VS, n = 5 for OD, n = 4 for cadaveric tissues in (d), n = 1473 cells from 3 VS, 236 cells from 1 OD tissues in (m). Scale bar = 200 and 20 µm in (a, b), 100 and 20 µm in (c), 20 µm in (eh), 20 and 10 µm in (i, j), 20 and 10 µm (kl””), 3 µm in (ns). Source data are provided as a Source Data file.
Fig. 6
Fig. 6. Trajectory analysis predicts supporting cell to hair cell transition.
a CellRank cell-cell transition matrix trajectory plot showing hair cell precursors differentiating towards mature hair cells (most arrows pointing to the left). b SWNE plot with projected type I and type II hair cell lineages and predicted hair cell precursors (cluster 7, pink). c Diagram showing supporting cells transition to hair cell-like cells through hair cell precursors. d, e Heatmap depicting dynamically expressed genes along the type I and II hair cell lineages (9731 and 4315 genes, respectively, FDR ≤ 0.01). There are five patterns of dynamic expression with some genes upregulated, some downregulated, and others transiently expressed in both type I and II lineages. (d: 1, 3 = up, 2 = down, 4, 5 = transient, e: 1, 5 = up, 2, 4 = transient, 3-down/transient) (colors correspond to the Source Data file). The density of cells, number of cell clusters, and corresponding location along the lineage is depicted below the heatmap. f, f’ Plots showing the dynamic expressions of genes from (d, e) that increase (left column) or decrease (middle column) along pseudotime. The individual dots in each plot represent single cells (cyan represents supporting cells, magenta represents hair cell precursors, purple and green showing type I and type II hair cells, respectively) with the x-axis representing pseudotime and the y-axis showing log2 expressions. The solid line represents the generalized additive model fit to the expression pattern for each gene. f” Comparison of type I versus type II hair cell dynamic gene expressions. Using the different end test, we detected statistically significant genes that begin at similar expression levels and end at different levels. SOX2, CXCL14, and CSRP2 expression increase in type II hair cells, while ADAM11, VSIG10L2, and ESPN increase in type I hair cells. g Graph showing eight top scoring canonical pathways associated with the type I and/or type II lineages along with the corresponding percentage of significantly expressed genes relative to the total number of genes in each pathway. h Graph of top biological function GO terms associated with type I and type II lineages. Source data are provided as a Source Data file.
Fig. 7
Fig. 7. Regeneration in human utricles.
a An elongated hair cell precursor cell (HCPC, arrowhead) expressing a low level of GPX2 (magenta), MYO7A (blue), and DAPI (gray). Dashed line marks the basement membrane (BM). Magnified image showing a GPX2/MYO7A+cell, whose nucleus is lower than other HCs. b, c Five patterns of dynamic expression of transcription factors along the type I and II hair cell lineages: some upregulated, some downregulated, and others transiently expressed in both type I and II lineages. (b: 1, 3 = up, 2, 5 = down, 4 = transient, c: 1, 3 = transient, 2-down/transient, 4, 5 = up) (validated markers highlighted in red. Also see the Source Data file). The location of cells along pseudotime for each lineage is depicted as cell density below the heatmaps. d shows elongated HCPCs (arrowhead) expressing GPX2 (magenta), ATOH1 (yellow), MYO7A (blue), and DAPI (gray) with a nucleus close to the BM. e Nuclei of HCPCs are significantly closer to the BM that those of HCs and supporting cells. f Dynamic expression and SWNE plots predicting upregulation of both POU4F3 and GFI1 as supporting cells transition to both type I and II HCs, with HCPCs colored in magenta. gh” VS tissues contained many more POU4F3+/SOX2+/MYO7A (red/blue/green) HCPCs (arrowheads) than OD tissues. Orthogonal views show POU4F3+/SOX2+/MYO7A cells (arrowhead) with nuclei near the BM. Occasional elongated POU4F3+/SOX2+/MYO7A cells (asterisks) were found in VS utricle (h”), with nuclei near the BM and below that of other HCs. i The percentage of POU4F3+/MYO7A supporting cells was significantly higher in VS than OD tissues. j Percentages of GFI1+/MYO7A supporting cells are significantly higher in VS compared to OD tissues. Data shown as mean ± S.D. and compared using two-way Student’s t-tests or compared using Kruskal–Wallis with Dunn’s multiple comparisons. **p = 0.0016 between HCs and HCPCs, ***p < 0.0001 between HCs and SCs in (e), **p = 0.0091 in (i), *p = 0.0384 in (j). n = 19 HCs, 69 SCs, and 7 HCPCs from 3 VS tissues in (e). n = 12 for VS, 3 for OD tissues in (i), n = 9 for VS, 2 for OD tissues in (j). Scale bar = 25 and 5 µm in (a, d), 20 µm in (gh”). Source data are provided as a Source Data file.

Similar articles

Cited by

References

    1. WHO. https://www.who.int/news-room/fact-sheets/detail/deafness-and-hearing-loss (2021).
    1. Maudoux A, Vitry S, El-Amraoui A. Vestibular deficits in deafness: clinical presentation, animal modeling, and treatment solutions. Front. Neurol. 2022;13:816534. doi: 10.3389/fneur.2022.816534. - DOI - PMC - PubMed
    1. Morton CC, Nance WE. Newborn hearing screening-a silent revolution. N. Engl. J. Med. 2006;354:2151–2164. doi: 10.1056/NEJMra050700. - DOI - PubMed
    1. Iyer AA, Groves AK. Transcription factor reprogramming in the inner ear: turning on cell fate switches to regenerate sensory hair cells. Front. Cell Neurosci. 2021;15:660748. doi: 10.3389/fncel.2021.660748. - DOI - PMC - PubMed
    1. Bucks, S. A. et al. Supporting cells remove and replace sensory receptor hair cells in a balance organ of adult mice. Elife10.7554/eLife.18128 (2017). - PMC - PubMed

Substances