. 2024 Jun 6;14(1):13063.
doi: 10.1038/s41598-024-63993-x.

Microbial metabolite sodium butyrate enhances the anti-tumor efficacy of 5-fluorouracil against colorectal cancer by modulating PINK1/Parkin signaling and intestinal flora

Affiliations

Microbial metabolite sodium butyrate enhances the anti-tumor efficacy of 5-fluorouracil against colorectal cancer by modulating PINK1/Parkin signaling and intestinal flora

Yangbo Li et al. Sci Rep. .

Abstract

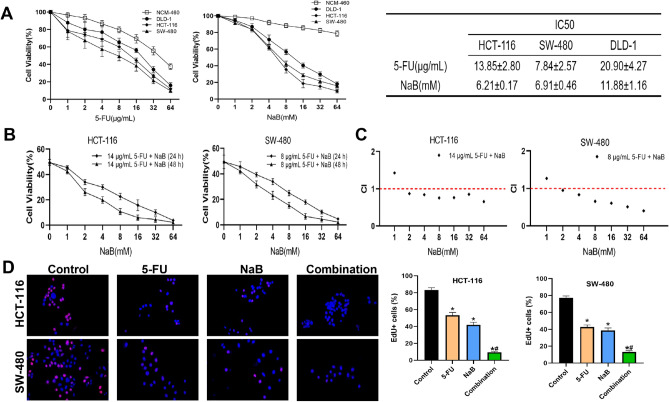
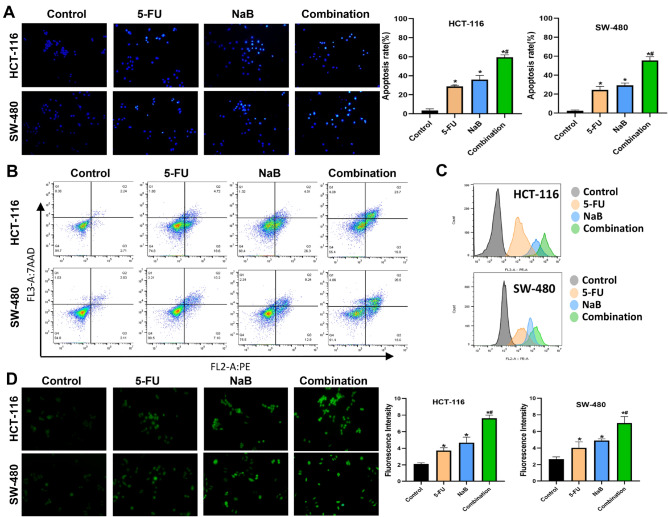
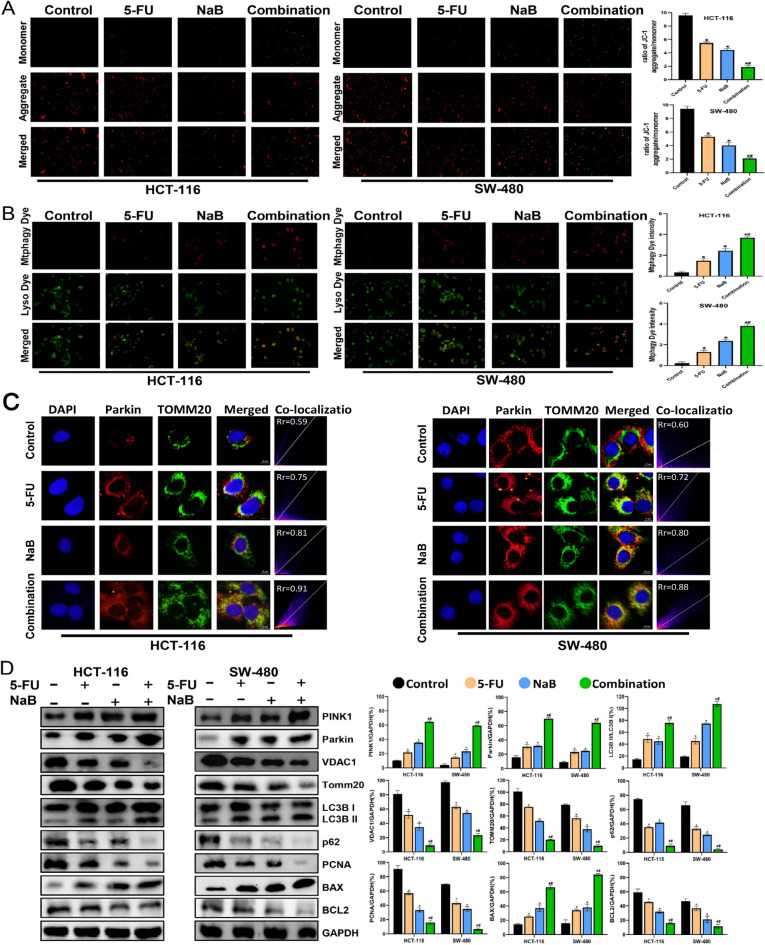
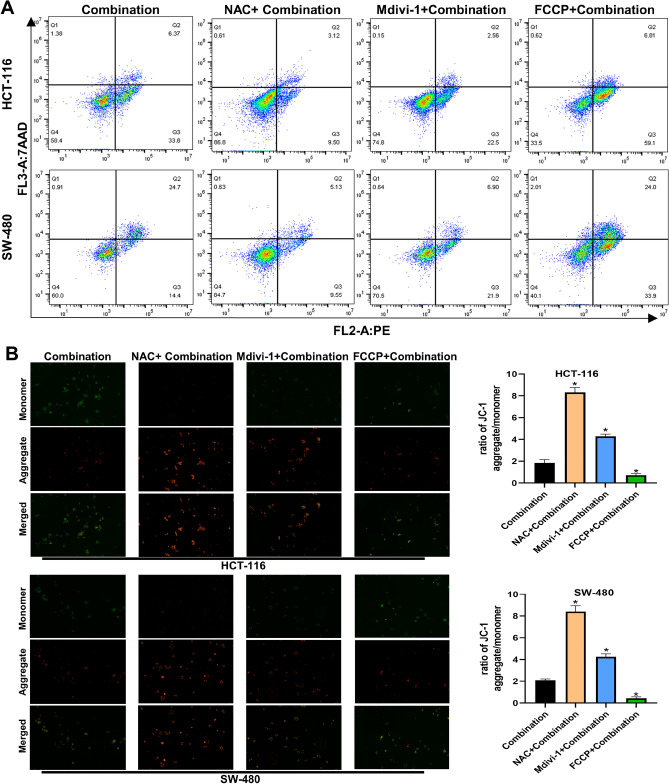
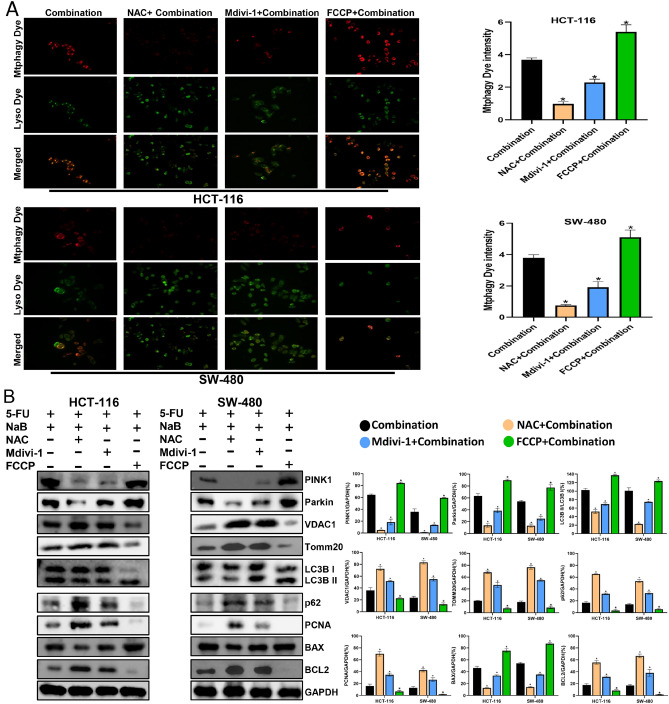
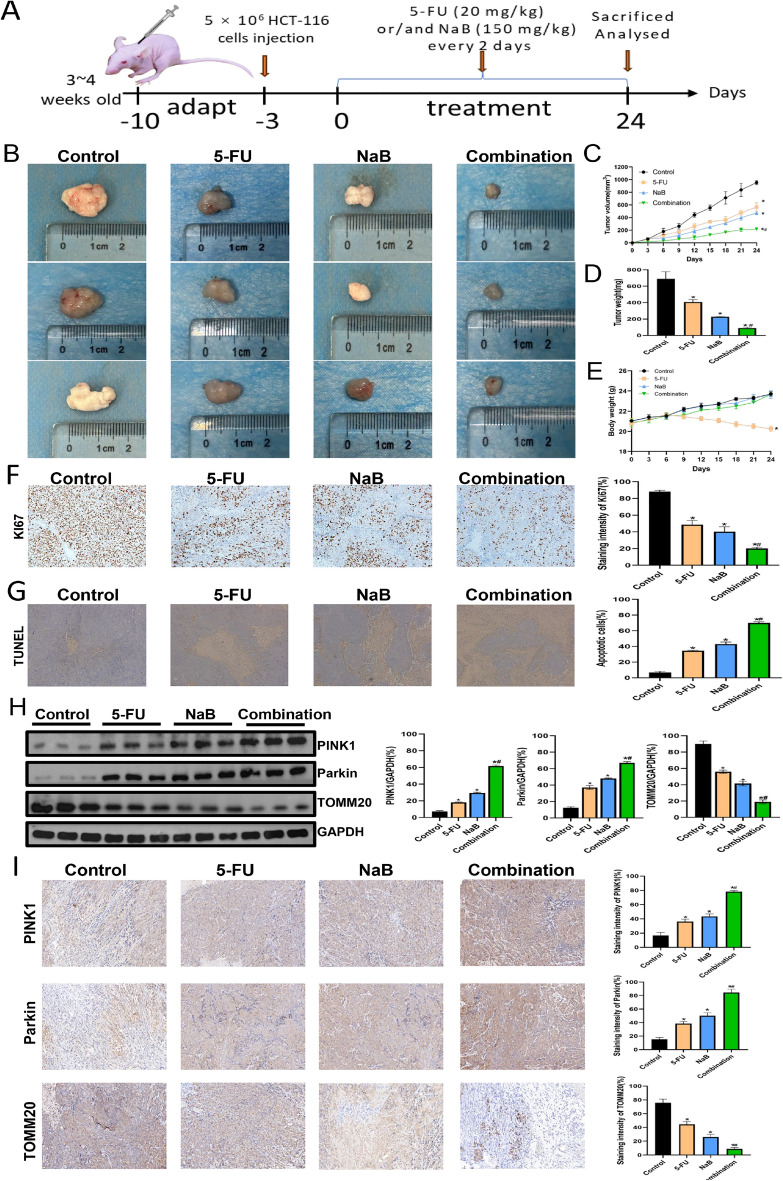
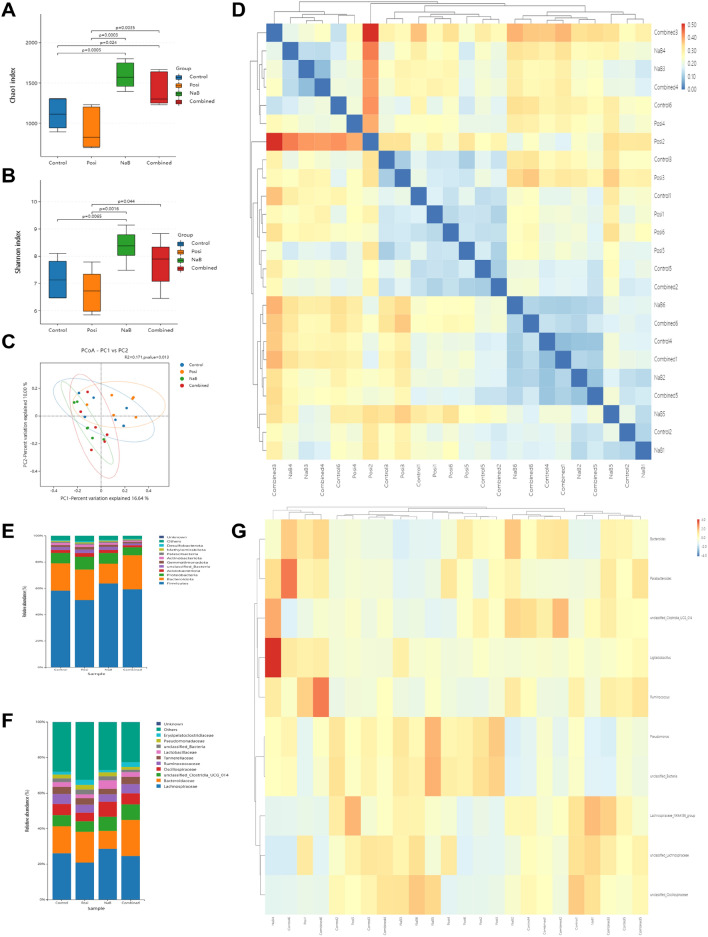
Colorectal cancer (CRC) is a prevalent global health issue, with 5-fluorouracil (5-FU) being a commonly used chemotherapeutic agent for its treatment. However, the efficacy of 5-FU is often hindered by drug tolerance. Sodium butyrate (NaB), a derivative of intestinal flora, has demonstrated anti-cancer properties both in vitro and in vivo through pro-apoptotic effects and has shown promise in improving outcomes when used in conjunction with traditional chemotherapy agents. This study seeks to evaluate the impact and potential mechanisms of NaB in combination with 5-FU on CRC. We employed a comprehensive set of assays, including CCK-8, EdU staining, Hoechst 33258 staining, flow cytometry, ROS assay, MMP assay, immunofluorescence, and mitophagy assay, to detect the effect of NaB on the biological function of CRC cells in vitro. Western blotting and immunohistochemistry were used to verify the above experimental results. The xenograft tumor model was established to evaluate the in vivo anti-CRC activity of NaB. Subsequently, 16S rRNA gene sequencing was used to analyze the intestinal flora. The findings of our study demonstrate that sodium butyrate (NaB) exerts inhibitory effects on tumor cell proliferation and promotes tumor cell apoptosis in vitro, while also impeding tumor progression in vivo through the enhancement of the mitophagy pathway. Furthermore, the combined treatment of NaB and 5-fluorouracil (5-FU) yielded superior therapeutic outcomes compared to monotherapy with either agent. Moreover, this combination therapy resulted in the specific enrichment of Bacteroides, LigiLactobacillus, butyric acid-producing bacteria, and acetic acid-producing bacteria in the intestinal microbiota. The improvement in the intestinal microbiota contributed to enhanced therapeutic outcomes and reduced the adverse effects of 5-FU. Taken together, these findings indicate that NaB, a histone acetylation inhibitor synthesized through intestinal flora fermentation, has the potential to significantly enhance the therapeutic efficacy of 5-FU in CRC treatment and improve the prognosis of CRC patients.

Keywords: Apoptosis; Colorectal cancer; PINK1/Parkin; Reactive oxygen species; Sodium butyrate.


Conflict of interest statement

The authors declare no competing interests.

Figures

Figure 1
Figure 1
Evaluation of CRC cells’ growth inhibition induced by 5-FU and/or NaB. (A) Cells (HCT-116, SW-480, DLD-1, and NCM-460) were treated with 5-FU (0, 1, 2, 4, 8, 16, 32, and 64 µg/mL) or NaB (0, 1, 2, 4, 8, 16, 32, and 64 mM) for 24 h, and cell viability was detected by CCK-8 assay. (B) HCT-116 and SW-480 cells were treated with 5-FU and NaB for 24 h or 48 h. (C) CompuSyn software was used to define the type of drug-combination effect. (D) The proliferation ability of HCT-116 and SW-480 cells was detected by EdU assay; HCT-116 cells were treated with control, 14 µg/mL 5-FU, 6 mM NaB, or 14 µg/mL 5-FU + 6 mM NaB; SW-480 cells were treated with control, 8 µg/mL 5-FU, 7 mM NaB, or 8 µg/mL 5-FU + 7 mM NaB; quantitative analysis of EdU-positive cells (original magnification: ×200). *p < 0.05 vs the control. #p < 0.05 vs the 5-FU. All data are shown as the mean ± SD from three independent experiments.
Figure 2
Figure 2
NaB combined with 5-FU promoted ROS-mediated apoptosis in CRC cells. (A) The characteristics of apoptotic nuclei in cells treated with specific concentrations (HCT-116 cells were treated with control, 14 µg/mL 5-FU, 6 mM NaB, or 14 µg/mL 5-FU + 6 mM NaB; SW-480 cells were treated with control, 8 µg/mL 5-FU, 7 mM NaB, or 8 µg/mL 5-FU + 7 mM NaB) were observed by Hoechst 33258 staining (original magnification: ×200); quantitative analysis of the apoptosis rate in each group. (B) Quantitative flow cytometry measurements of apoptosis in CRC cells. (C) Quantitative flow cytometry measurements of ROS in CRC cells. (D) ROS was observed via DCFH-DA staining(original magnification: ×200); quantitative analysis of the average fluorescence intensity of ROS in each group. *p < 0.05 vs the control. #p < 0.05 vs the 5-FU. All the above data are the mean ± SD from an average of three experiments.
Figure 3
Figure 3
NaB combined with 5-FU promoted mitophagy in CRC Cells. (A) MMP was observed via JC-1 staining(original magnification: ×200); quantitative analysis of the MMP in each group. (B) Fluorescence intensity of mitochondrial Mtphagy dye and Lyso dye in CRC cells (original magnification: ×400); quantitative analysis of the average fluorescence intensity of mitochondrial Mtphagy dye in each group. (C) Co-localization of Parkin with TOMM20 assessed via fluorescence microscopy (original magnification: ×400); co-located scatter plots for quantitative analysis. (D) Western blot analysis of PINK1, Parkin, VDAC1, TOMM20, LC3B I, LC3B II, p62, PCNA, BCL2, and BAX was performed in cells; quantitative analysis of the proteins is shown. *p < 0.05 vs the control. #p < 0.05 vs the 5-FU. All data are shown as the mean ± SD from three independent experiments.
Figure 4
Figure 4
Pretreatment with NAC (10 µm), Mdivi-1 (10 µm), or FCCP (2 µm) respectively influences the apoptosis and MMP of CRC cells induced by NaB combined with 5-FU (A) Quantitative flow cytometry measurements of apoptosis in each group(original magnification: ×200). (B) MMP was observed via JC-1 staining(original magnification: ×200); quantitative analysis of the MMP in each group. *p < 0.05 vs the Combination. All data are shown as the mean ± SD from three independent experiments.
Figure 5
Figure 5
Pretreatment with NAC (10 µm), Mdivi-1 (10 µm), or FCCP (2 µm) respectively influences the mitophagy of CRC cells induced by NaB combined with 5-FU (A) Fluorescence intensity of mitochondrial Mtphagy dye and Lyso dye in CRC cells (original magnification: ×400); quantitative analysis of the average fluorescence intensity of mitochondrial Mtphagy Dye in each group. (B) Western blot analysis of PINK1, Parkin, VDAC1, TOMM20, LC3B I, LC3B II, p62, PCNA, BCL2, and BAX was performed in cells; quantitative analysis of the proteins is shown. *p < 0.05 vs the combination. All data are shown as the mean ± SD from three independent experiments.
Figure 6
Figure 6
Anti-tumor effects of NaB (150 mg/kg) and 5-FU (20 mg/kg) on HCT-116 cells in vivo. (A) Schematic view of the experimental procedures of the xenograft tumor model in nude mice. (B) Morphology of the subcutaneous implanted tumor. (C) Mean tumor volume at each time point. (D) The tumor weight was obtained at the end of the experiment. (E) Mean body weight at each time point. (F) Immunohistochemical detection of Ki67 expression (original magnification: ×200) and quantitative analysis of Ki67 staining intensity. (G) Apoptotic cells were detected in tumor tissue by TUNEL assay (original magnification: ×100); quantitative analysis of apoptotic cells. (H) Western blot analysis of PINK1, Parkin, and TOMM20 was performed; quantitative analysis of the proteins is shown. (I) Immunohistochemical detection of PINK1, Parkin, and TOMM20 expression (original magnification: ×200) and quantitative analysis of PINK1, Parkin and TOMM20 staining intensity. *p < 0.05 vs the control. #p < 0.05 vs the 5-FU. All data are shown as the mean ± SD from three independent experiments.
Figure 7
Figure 7
Effects of the combination of NaB (150 mg/kg) and 5-FU (20 mg/kg) on the intestinal flora change in faeces. (A) Chao1 index of alpha diversity analysis. (B) Shannon index of alpha diversity analysis. (C) Principal coordination analysis (PCoA) of beta diversity analysis. (D) Sample clustering heat map of beta diversity analysis. (E,F) Bar plots of bacterial taxa present in the feces at the phylum and family levels based on relative abundance. (G) Heatmap of bacterial taxa present in the feces at the genus level based on relative abundance (n = 6 mice per group). All data are shown as the mean ± SD.

Similar articles

Cited by

References

    1. Sung H, Ferlay J, Siegel RL, Laversanne M, Soerjomataram I, Jemal A, Bray F. Global cancer statistics 2020: GLOBOCAN estimates of incidence and mortality worldwide for 36 cancers in 185 countries. CA Cancer J. Clin. 2021;71:209–249. doi: 10.3322/caac.21660. - DOI - PubMed
    1. Vodenkova S, Buchler T, Cervena K, Veskrnova V, Vodicka P, Vymetalkova V. 5-fluorouracil and other fluoropyrimidines in colorectal cancer: Past, present and future. Pharmacol. Ther. 2020;206:107447. doi: 10.1016/j.pharmthera.2019.107447. - DOI - PubMed
    1. Cai B, Pan J, Chen H, Chen X, Ye Z, Yuan H, Sun H, Wan P. Oyster polysaccharides ameliorate intestinal mucositis and improve metabolism in 5-fluorouracil-treated S180 tumour-bearing mice. Carbohydr. Polym. 2021;256:117545. doi: 10.1016/j.carbpol.2020.117545. - DOI - PubMed
    1. Hamouda N, Sano T, Oikawa Y, Ozaki T, Shimakawa M, Matsumoto K, Amagase K, Higuchi K, Kato S. Apoptosis, dysbiosis and expression of inflammatory cytokines are sequential events in the development of 5-fluorouracil-induced intestinal mucositis in mice. Basic Clin. Pharmacol. Toxicol. 2017;121:159–168. doi: 10.1111/bcpt.12793. - DOI - PubMed
    1. Wardill HR, Bowen JM, Gibson RJ. New pharmacotherapy options for chemotherapy-induced alimentary mucositis. Expert Opin. Biol. Ther. 2014;14:347–354. doi: 10.1517/14712598.2014.874412. - DOI - PubMed

MeSH terms