

Using expression data to fine map QTL associated with fertility in dairy cattle
- PMID: 38844868
- PMCID: PMC11154999
- DOI: 10.1186/s12711-024-00912-8
Using expression data to fine map QTL associated with fertility in dairy cattle
Abstract
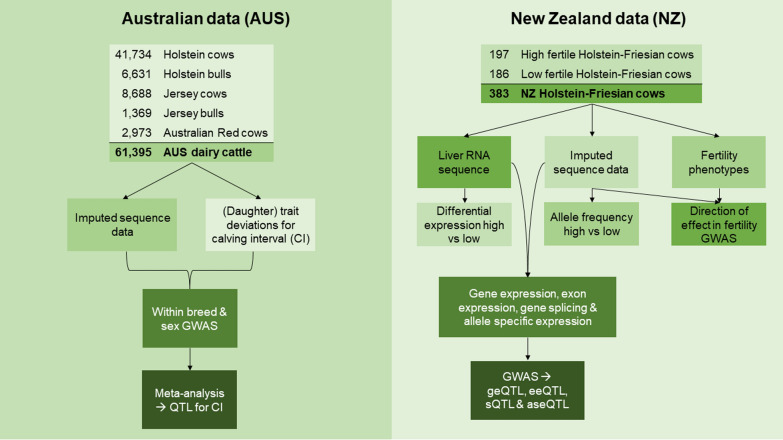
Background: Female fertility is an important trait in dairy cattle. Identifying putative causal variants associated with fertility may help to improve the accuracy of genomic prediction of fertility. Combining expression data (eQTL) of genes, exons, gene splicing and allele specific expression is a promising approach to fine map QTL to get closer to the causal mutations. Another approach is to identify genomic differences between cows selected for high and low fertility and a selection experiment in New Zealand has created exactly this resource. Our objective was to combine multiple types of expression data, fertility traits and allele frequency in high- (POS) and low-fertility (NEG) cows with a genome-wide association study (GWAS) on calving interval in Australian cows to fine-map QTL associated with fertility in both Australia and New Zealand dairy cattle populations.
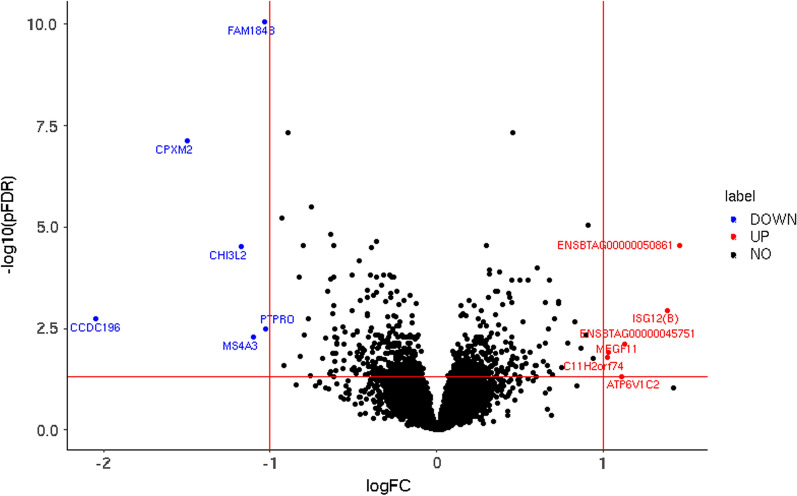
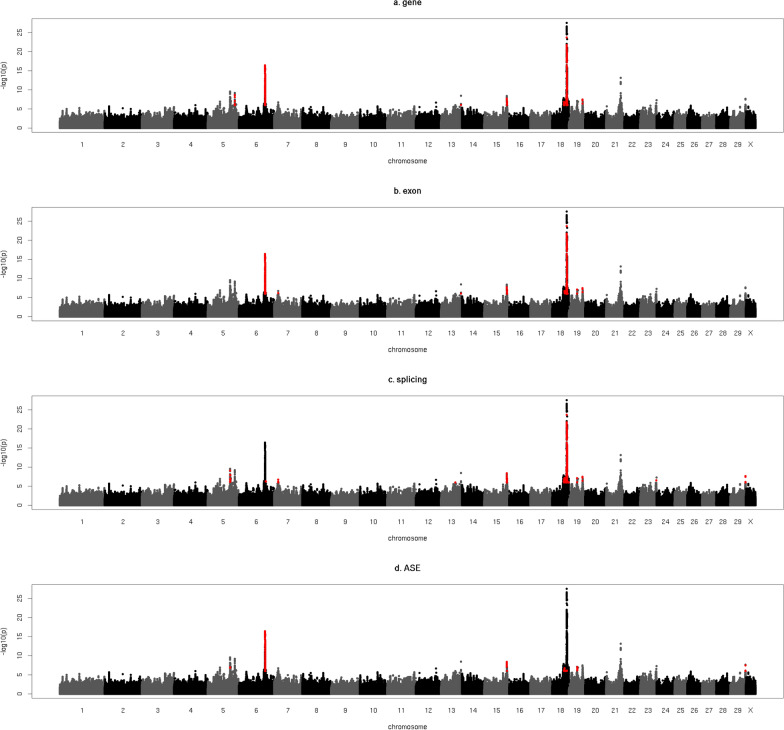
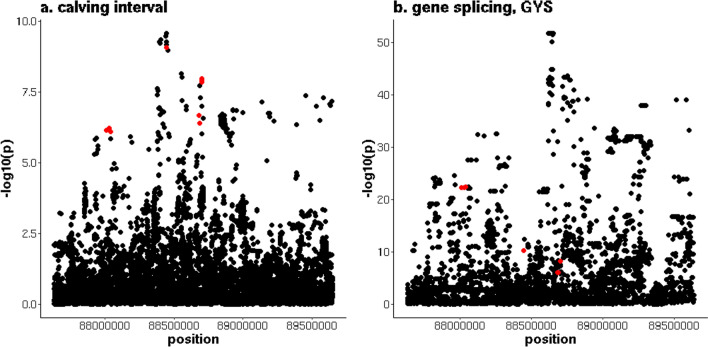
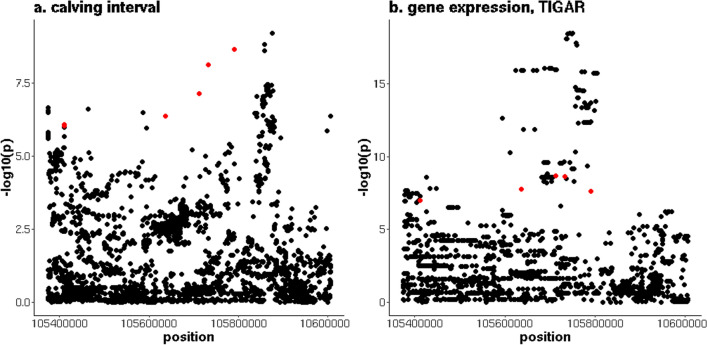
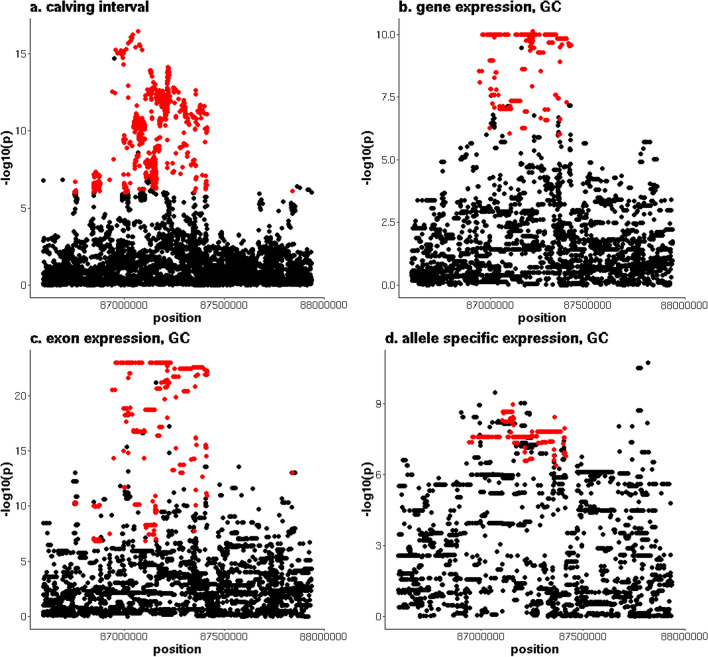
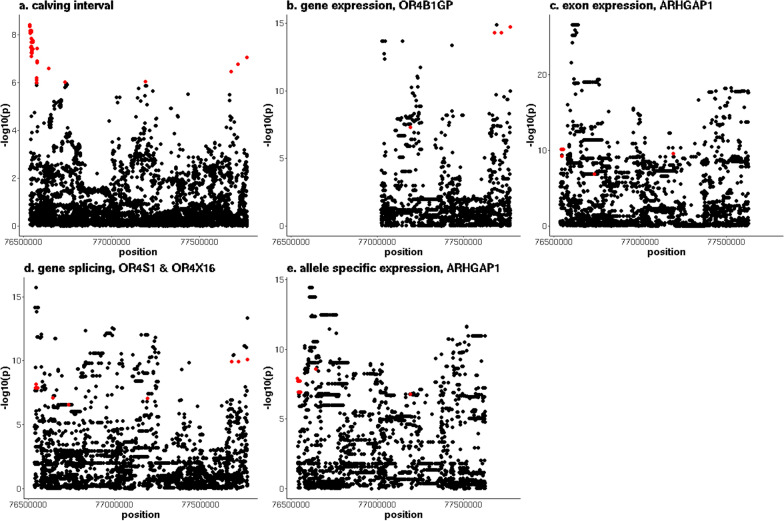
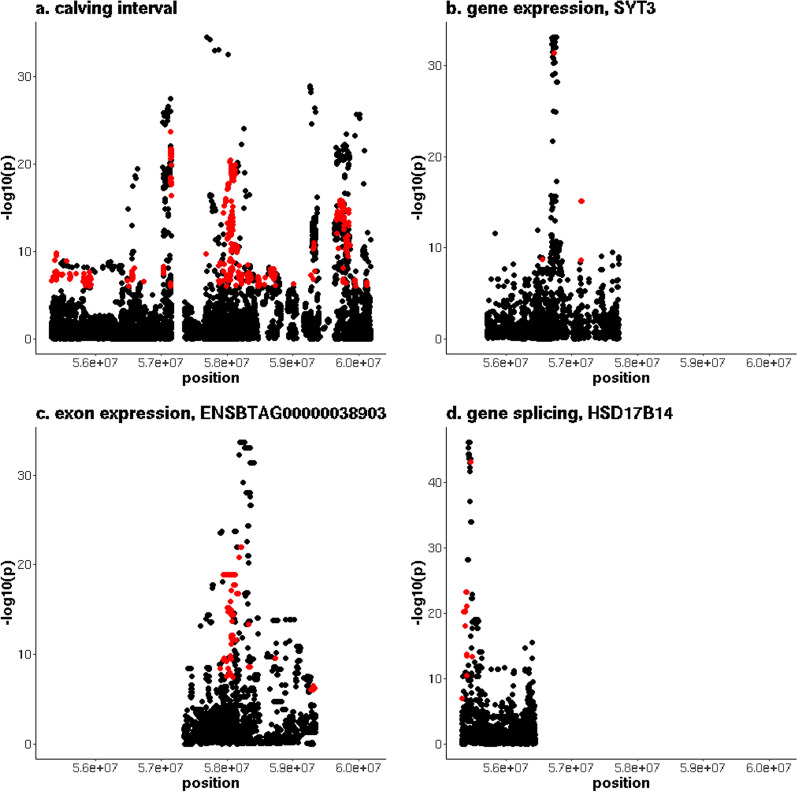
Results: Variants that were significantly associated with calving interval (CI) were strongly enriched for variants associated with gene, exon, gene splicing and allele-specific expression, indicating that there is substantial overlap between QTL associated with CI and eQTL. We identified 671 genes with significant differential expression between POS and NEG cows, with the largest fold change detected for the CCDC196 gene on chromosome 10. Our results provide numerous candidate genes associated with female fertility in dairy cattle, including GYS2 and TIGAR on chromosome 5 and SYT3 and HSD17B14 on chromosome 18. Multiple QTL regions were located in regions with large numbers of copy number variants (CNV). To identify the causal mutations for these variants, long read sequencing may be useful.
Conclusions: Variants that were significantly associated with CI were highly enriched for eQTL. We detected 671 genes that were differentially expressed between POS and NEG cows. Several QTL detected for CI overlapped with eQTL, providing candidate genes for fertility in dairy cattle.
© 2024. Crown.
Conflict of interest statement
The authors declare that they have no competing interests.
Figures
Similar articles
-
Genome-wide association study for endocrine fertility traits using single nucleotide polymorphism arrays and sequence variants in dairy cattle.J Dairy Sci. 2016 Jul;99(7):5470-5485. doi: 10.3168/jds.2015-10533. Epub 2016 May 4. J Dairy Sci. 2016. PMID: 27157577
-
Overlap between eQTL and QTL associated with production traits and fertility in dairy cattle.BMC Genomics. 2019 Apr 15;20(1):291. doi: 10.1186/s12864-019-5656-7. BMC Genomics. 2019. PMID: 30987590 Free PMC article.
-
Genome-wide association studies of fertility and calving traits in Brown Swiss cattle using imputed whole-genome sequences.BMC Genomics. 2017 Nov 25;18(1):910. doi: 10.1186/s12864-017-4308-z. BMC Genomics. 2017. PMID: 29178833 Free PMC article.
-
Symposium review: Genetics, genome-wide association study, and genetic improvement of dairy fertility traits.J Dairy Sci. 2019 Apr;102(4):3735-3743. doi: 10.3168/jds.2018-15269. Epub 2018 Sep 27. J Dairy Sci. 2019. PMID: 30268602 Review.
-
Underlying genetic architecture of resistance to mastitis in dairy cattle: A systematic review and gene prioritization analysis of genome-wide association studies.J Dairy Sci. 2023 Jan;106(1):323-351. doi: 10.3168/jds.2022-21923. Epub 2022 Nov 1. J Dairy Sci. 2023. PMID: 36333139
References
-
- Workie ZW, Gibson JP, van der Werf JHJ. Age at culling and reasons of culling in Australian dairy cows. Proc Assoc Advmt Anim Breed Genet. 2019;23:143–146.
MeSH terms
Grants and funding
LinkOut - more resources
Full Text Sources
