

A comparison of hemodynamic measurement methods during orthotopic liver transplantation: evaluating agreement and trending ability of PiCCO versus pulmonary artery catheter techniques
- PMID: 38844869
- PMCID: PMC11155023
- DOI: 10.1186/s12871-024-02582-x
A comparison of hemodynamic measurement methods during orthotopic liver transplantation: evaluating agreement and trending ability of PiCCO versus pulmonary artery catheter techniques
Abstract
Background: Significant hemodynamic changes occur during liver transplantation, emphasizing the importance of precious and continuous monitoring of cardiac output, cardiac index, and other parameters. Although the monitoring of cardiac output by pulse indicator continuous cardiac output (PiCCO) was statistically homogeneous compared to the clinical gold standard pulmonary artery catheterization (PAC) in previous studies of liver transplantation, there are fewer statistical methods for the assessment of its conclusions, and a lack of comparisons of other hemodynamic parameters (e.g., SVRI, systemic vascular resistance index). Some studies have also concluded that the agreement between PiCCO and PAC is not good enough. Overall, there are no uniform conclusions regarding the agreement between PiCCO and PAC in previous studies. This study evaluates the agreement and trending ability of relevant hemodynamic parameters obtained with PiCCO compared to the clinical gold standard PAC from multiple perspectives, employing various statistical methods.
Methods: Fifty-two liver transplantation patients were included. Cardiac output (CO), cardiac index (CI), SVRI and stroke volume index (SVI) values were monitored at eight time points using both PiCCO and PAC. The results were analyzed by Bland-Altman analysis, Passing-bablok regression, intra-class correlation coefficient (ICC), 4-quadrant plot, polar plot, and trend interchangeability method (TIM).
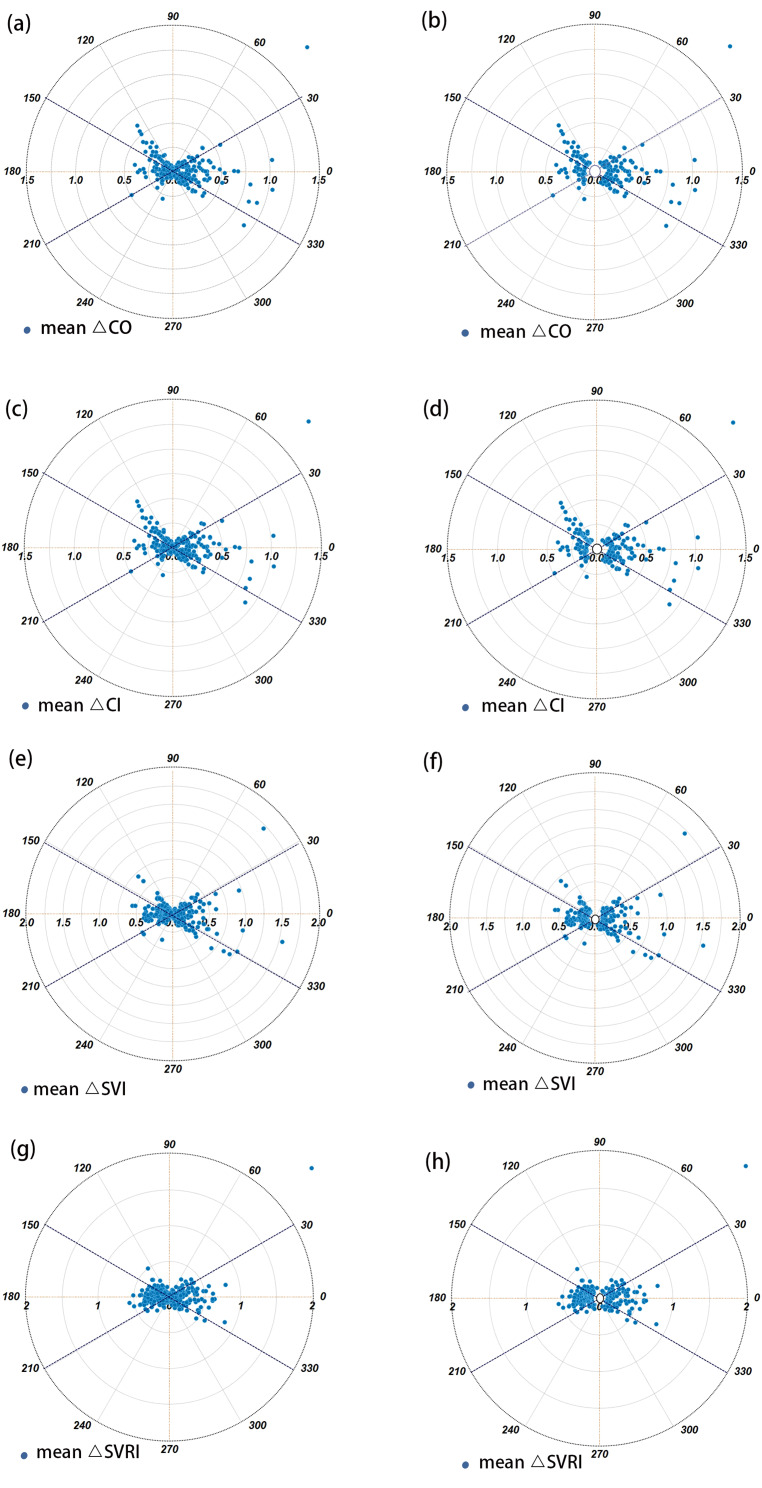
Results: The Bland-Altman analysis revealed high percentage errors for PiCCO: 54.06% for CO, 52.70% for CI, 62.18% for SVRI, and 51.97% for SVI, indicating poor accuracy. While Passing-Bablok plots showed favorable agreement for SVRI overall and during various phases, the agreement for other parameters was less satisfactory. The ICC results confirmed good overall agreement between the two devices across most parameters, except for SVRI during the new liver phase, which showed poor agreement. Additionally, four-quadrant and polar plot analyses indicated that all agreement rate values fell below the clinically acceptable threshold of over 90%, and all angular deviation values exceeded ± 5°, demonstrating that PiCCO is unable to meet the acceptable trends. Using the TIM, the interchangeability rates were found to be quite low: 20% for CO and CI, 16% for SVRI, and 13% for SVI.
Conclusions: Our study revealed notable disparities in absolute values of CO, CI, SVRI and SVI between PiCCO and PAC in intraoperative liver transplant settings, notably during the neohepatic phase where errors were particularly pronounced. Consequently, these findings highlight the need for careful consideration of PiCCO's advantages and disadvantages in liver transplantation scenarios, including its multiple parameters (such as the encompassing extravascular lung water index), against its limited correlation with PAC.
Keywords: Agreement analysis; Hemodynamic monitoring; Liver transplantation; PiCCO; Pulmonary artery catheterization; Trending ability..
© 2024. The Author(s).
Conflict of interest statement
The authors declare no competing interests.
Figures


Similar articles
-
Application of intraoperative arterial pressure-based cardiac output monitoring for patients undergoing coronary artery bypass grafting surgery.Chin Med J (Engl). 2012 Jun;125(12):2099-103. Chin Med J (Engl). 2012. PMID: 22884136 Clinical Trial.
-
Cross-comparison of cardiac output trending accuracy of LiDCO, PiCCO, FloTrac and pulmonary artery catheters.Crit Care. 2010;14(6):R212. doi: 10.1186/cc9335. Epub 2010 Nov 23. Crit Care. 2010. PMID: 21092290 Free PMC article.
-
Noninvasive assessment of Cardiac Index using impedance cardiography during liver transplantation surgery: a comparison with pulmonary artery thermodilution.Minerva Anestesiol. 2019 Jan;85(1):28-33. doi: 10.23736/S0375-9393.18.12391-1. Epub 2018 May 9. Minerva Anestesiol. 2019. PMID: 29745622
-
[Hemodynamic monitoring in the intensive care unit: pulmonary artery catheter versus PiCCO].Dtsch Med Wochenschr. 2011 Feb;136(8):376-80. doi: 10.1055/s-0031-1272539. Epub 2011 Feb 17. Dtsch Med Wochenschr. 2011. PMID: 21332037 Review. German.
-
Invasive hemodynamic monitoring.Crit Care Clin. 2015 Jan;31(1):67-87. doi: 10.1016/j.ccc.2014.08.004. Crit Care Clin. 2015. PMID: 25435479 Review.
Cited by
-
Hemodynamic management in liver transplantation: toward an evidence-based perioperative strategy.Braz J Anesthesiol. 2025 May-Jun;75(3):844621. doi: 10.1016/j.bjane.2025.844621. Epub 2025 Apr 1. Braz J Anesthesiol. 2025. PMID: 40180150 Free PMC article. No abstract available.
References
Publication types
MeSH terms
LinkOut - more resources
Full Text Sources
Medical
