. 2024 Jun 6;22(1):536.
doi: 10.1186/s12967-024-05322-4.

Current perspectives in obesity management: unraveling the impact of different therapy approach in real life obesity care

Affiliations

Current perspectives in obesity management: unraveling the impact of different therapy approach in real life obesity care

Keyvan Khorrami Chokami et al. J Transl Med. .

Abstract

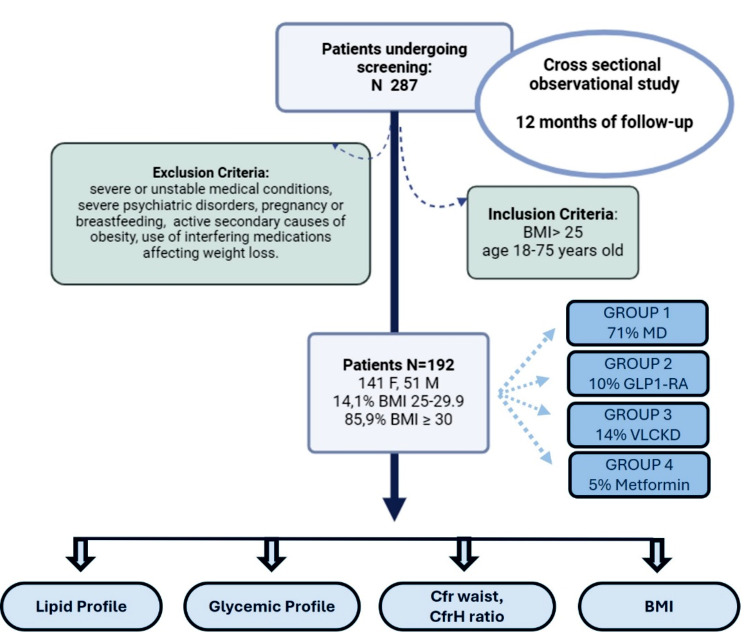
Background: The challenge of addressing obesity persists in healthcare, necessitating nuanced approaches and personalized strategies. This study aims to evaluate the effects of diverse therapeutic interventions on anthropometric and biochemical parameters in individuals with overweight and obesity within a real-world clinical context.

Methods: A retrospective analysis was conducted on 192 patients (141 females, 51 males) aged 18 to 75, with a BMI ranging from 25 to 30 (14.1%) and BMI ≥ 30 (85.9%), observed over a 12-month period at our Endocrinology Unit. Treatment cohorts comprised individuals following different regimens: Mediterranean Diet (MD), with an approximate daily intake of 1500 kcal for women and 1800 kcal for men (71% patients); Ketogenic Diet (KD), utilizing the VLCKD protocol characterized by a highly hypocaloric dietary regimen < 800 kcal/day (14% patients); metformin, administered using the oral formulation (5% patients); pharmacological intervention with GLP1-RA administered via subcutaneous injection with incremental dosage (10% patients). Supply constraints limited the efficacy of Liraglutide, whereas Semaglutide was excluded from comparisons due to its unavailability for obesity without diabetes. Blood tests were conducted to assess lipid profile, glycemic profile, and anthropometric parameters, including BMI, waist circumference, and waist-to-height ratio.

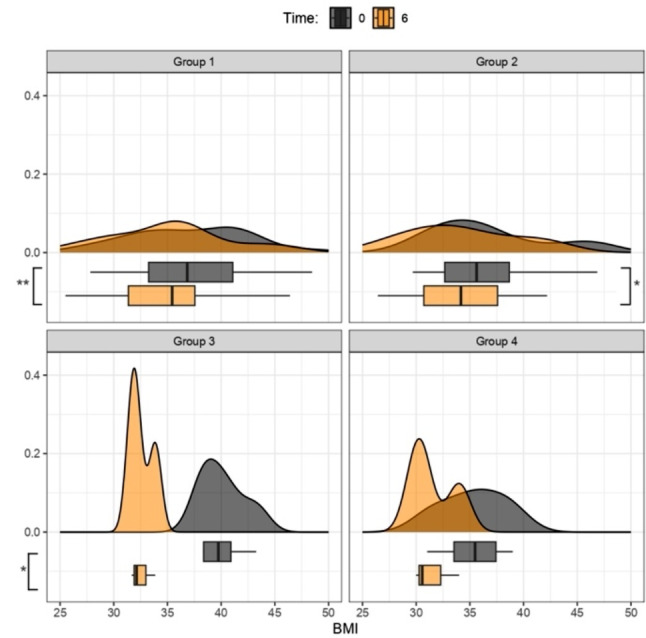
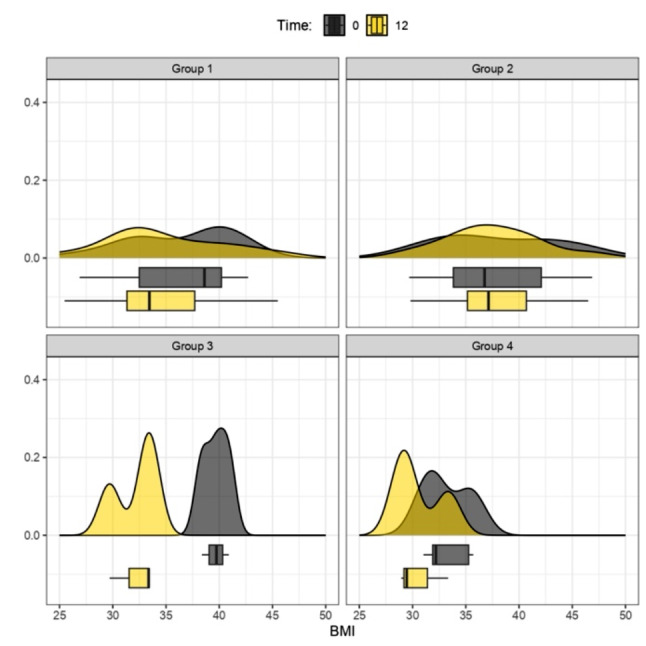
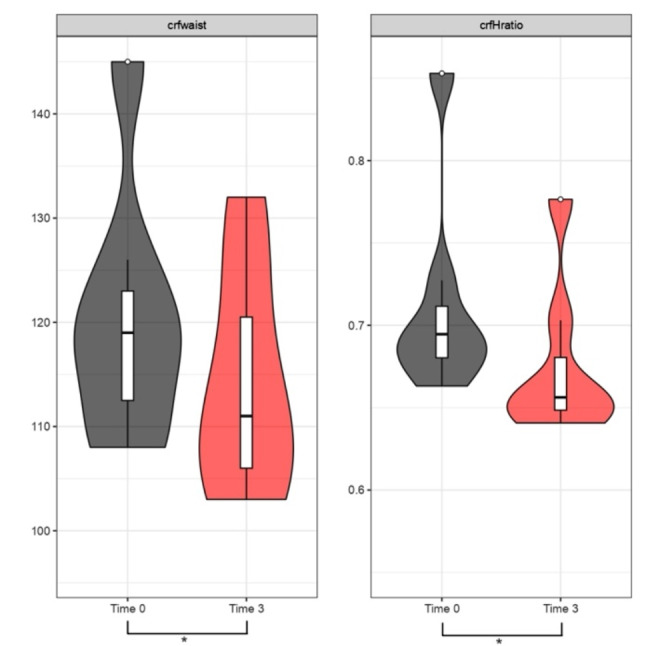
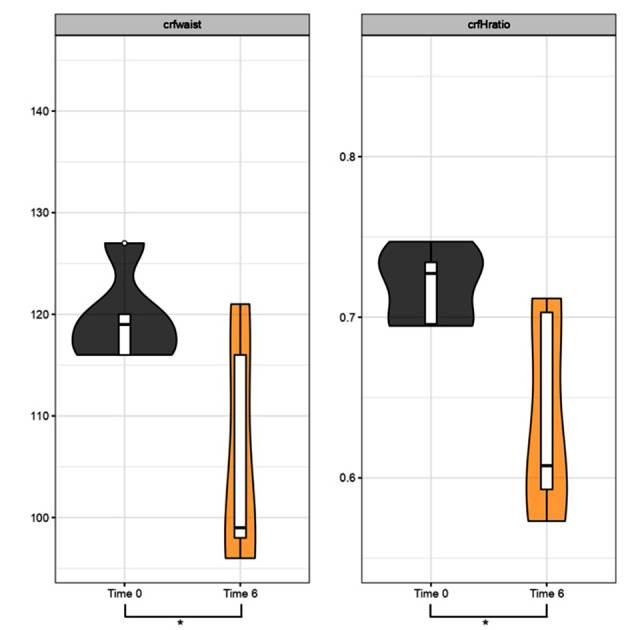
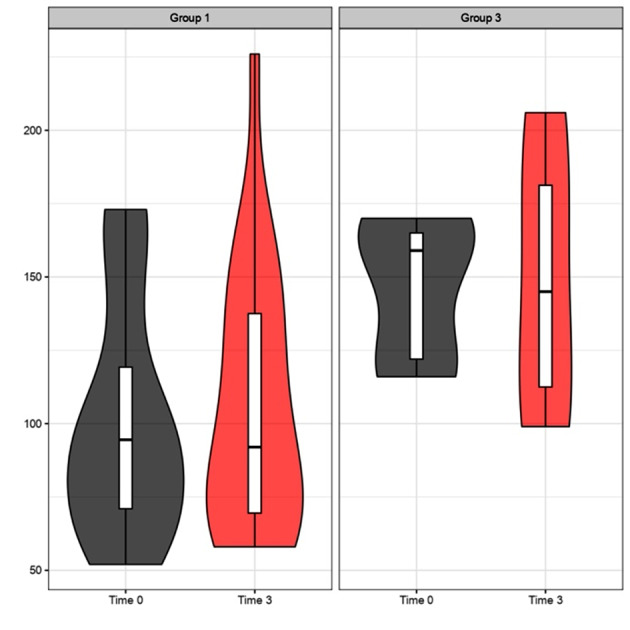
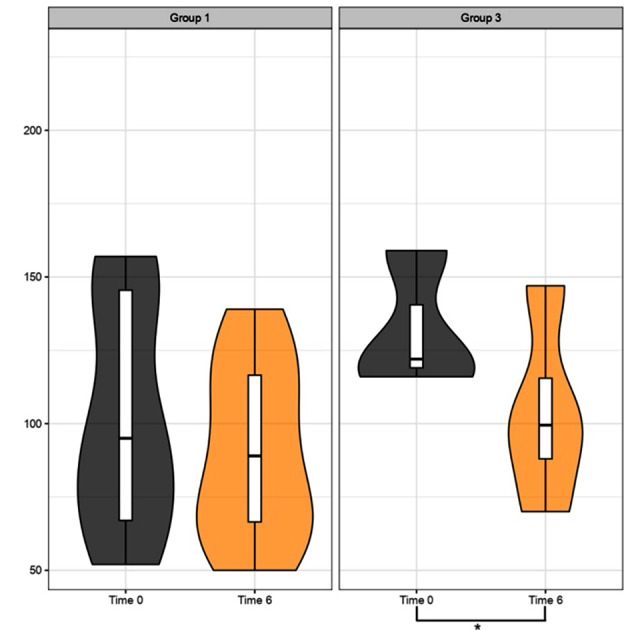
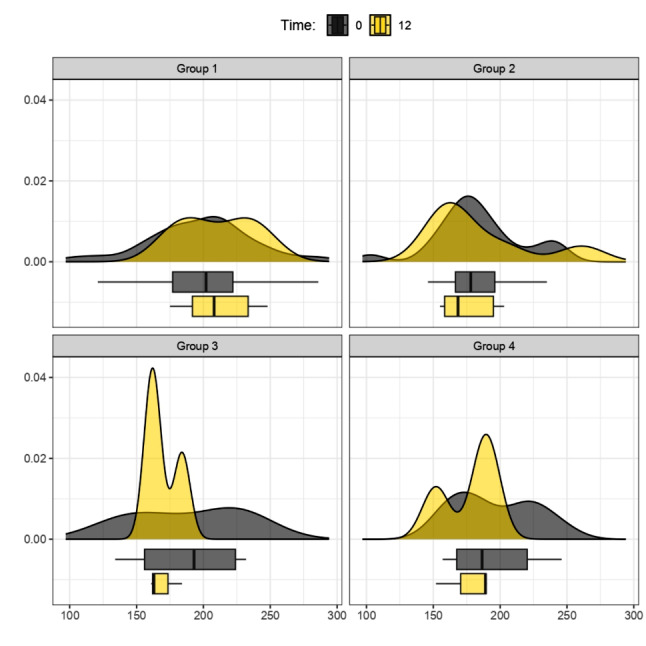
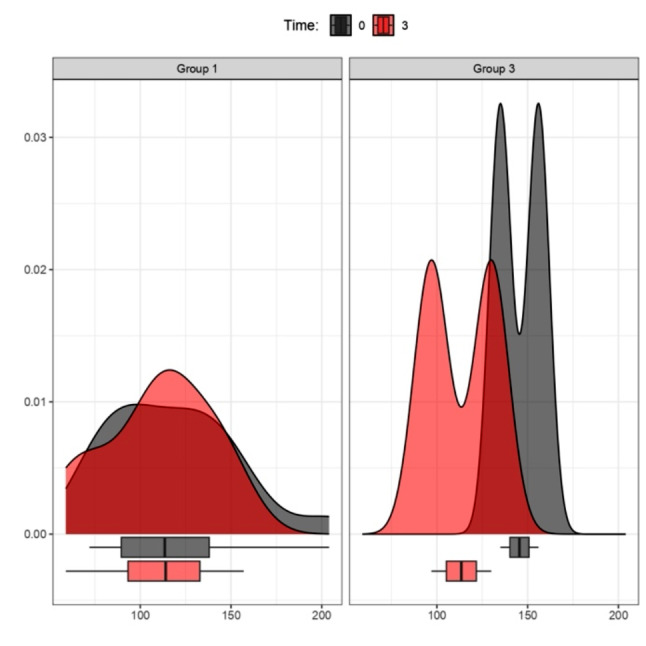
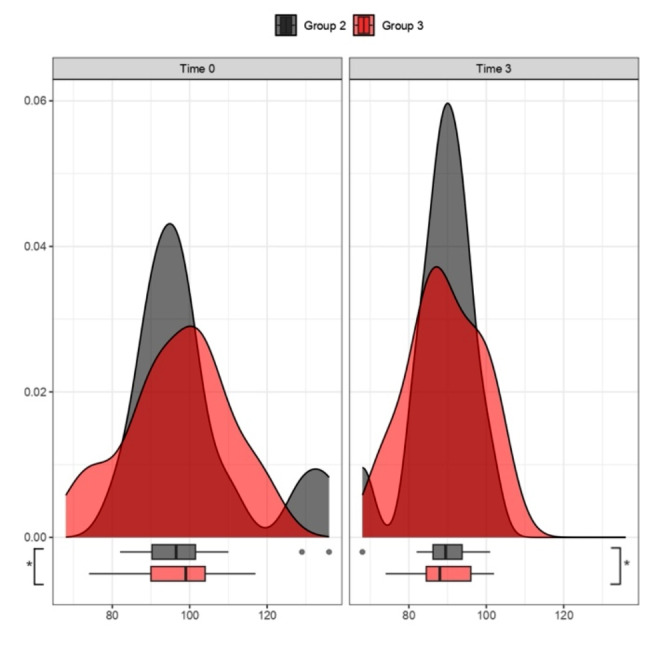
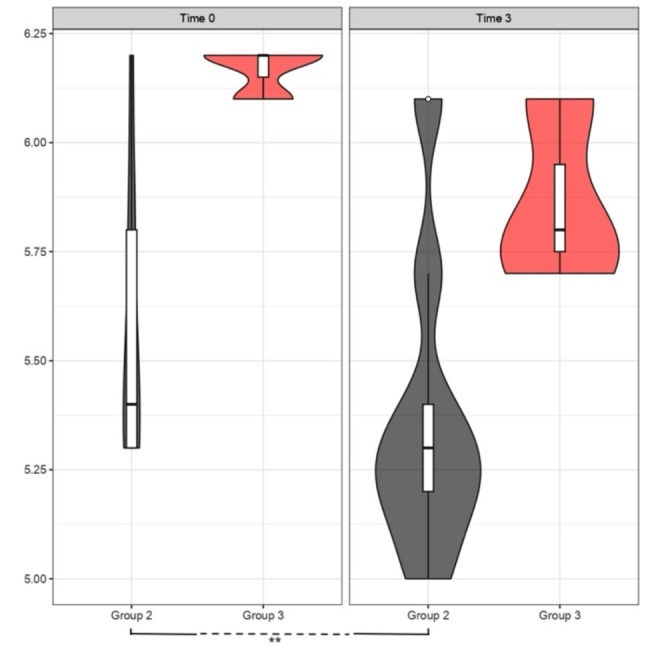
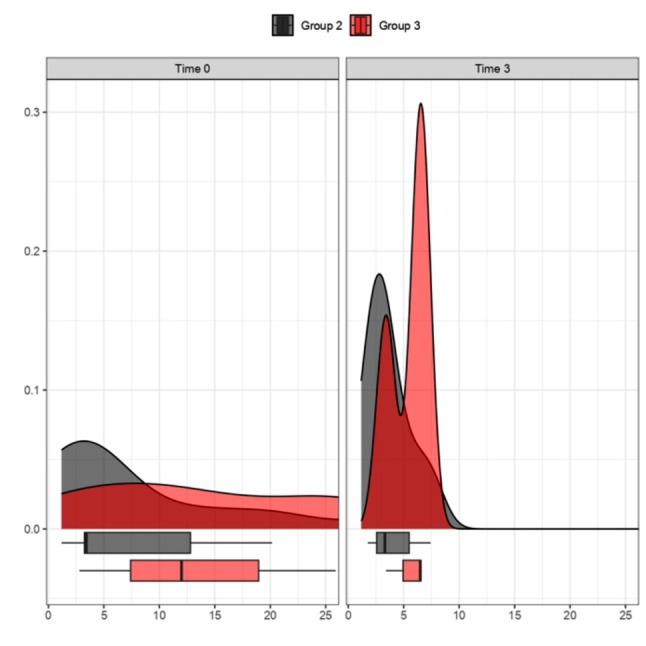
Results: Significant BMI changes were observed from baseline to 6 months across MD, KD, and Liraglutide groups (p < 0.05). KD exhibited notable reductions in waist circumference and waist-to-height ratio within the initial quarter (p < 0.05), with a significant triglyceride decrease after 6 months (p < 0.05), indicating its efficacy over MD. Liraglutide demonstrated a substantial reduction in HbA1c levels in the first quarter (p < 0.05). During the first three months, the ANOVA test on fasting blood glucose showed a statistically significant impact of the time variable (p < 0.05) rather than the specific treatments themselves (Liraglutide and KD), suggesting that adherence during the early stages of therapy may be more critical than treatment choice.

Conclusions: Positive outcomes from targeted interventions, whether pharmacological or dietary should encourage the exploration of innovative, long-term strategies that include personalized treatment alternation. The absence of standardized protocols underscores the importance of careful and tailored planning in managing obesity as a chronic condition.

Keywords: Anti-obesity medications; Glycemic profile; Ketogenic diet; Lipid profile; Metabolic parameters; Weight loss interventions.


Conflict of interest statement

The authors declare that they have no competing interests.

Figures

Map. 1
Map. 1
Map illustrating the clinical design of the study
Fig. 1
Fig. 1
BMI (kg/m2) Variation between Time 0 and 6 months. Group 1: Mediterranean Diet; Group 2: Liraglutide; Group 3: Ketogenic Diet; Group 4: Metformin. The density curves above, accompanied by the box plots below, show a leftward shift, indicating a decrease in BMI scores across all treatment groups from 0 (grey graphs) to 6 months (orange graphs); p values < 0.05 (t-test for paired data) for Groups 1**, 2*, 3*, and p > 0.05 for Group 4
Fig. 2
Fig. 2
BMI (kg/m2) Variation between Time 0 and 12 months. Group 1: Mediterranean Diet; Group 2: Liraglutide; Group 3: Ketogenic Diet; Group 4: Metformin. The density curves above, accompanied by the box plots below, show a leftward shift for groups 1, 3, 4, indicating a decrease in BMI scores within their respective treatment groups from 0 (grey graphs) to 12 months (yellow graphs). Group 2 exhibits a steady trend between baseline (grey graphs) and 12 months (yellow graphs); p values > 0.05 (t-test for paired data) for Groups 1, 2, 3, 4
Fig. 3
Fig. 3
Waist Circumference (cm) and Waist-to-Height Ratio between Time 0 and 3 months. Specific analysis for Group 3 undergoing KD treatment. The violin plots in the first figure illustrate the trend of crfwaist between time 0 (grey plot) and after 3 months of treatment (red plot), showing a tendency towards downward movement, indicating a decrease in length in cm. A similar trend is observed for the cfrHratio value, with the red plot after 3 months of treatment indicating improvement, reflecting a downward shift; p-value (t-test for paired data) for crfwaist in Group 3 p < 0.05 (*) and for crfHratio Group 3 p < 0.05 (*)
Fig. 4
Fig. 4
Waist Circumference (cm) and Waist-to-Height Ratio between Time 0 and 6 months. Specific analysis for Group 3 undergoing KD treatment. The violin plots in the first figure show the trend of crfwaist between time 0 (grey plot) and after 6 months of treatment (orange plot), with a tendency towards downward movement, indicating a decrease in length in cm. A similar trend is observed for the cfrHratio value, with the orange plot after 6 months of treatment showing improvement, indicating a downward shift; p value (t-test for paired data) for crfwaist Group 3 p < 0.05 (*) and for crfHratio Group 3 p < 0.05 (*)
Fig. 5
Fig. 5
Triglyceride levels (mg/dL) after 3 months of treatment. Comparative analysis between Group 1 (MD) and Group 3 (KD). The violin plots at time 0 (grey plots) compared to 3 months (red plots) do not reveal a significant improvement trend for Group 1. Instead, for Group 3, a trend of improvement is noticeable in the right red plot, represented by the downward shift (decrease in triglycerides) of the ketogenic diet treatment group (on the right side); p values > 0.05 (t-test for paired data) for Groups 1, 3
Fig. 6
Fig. 6
Triglyceride levels (mg/dL) after 6 months of treatment. Comparative analysis between Group 1 (MD) and Group 3 (KD). The violin plots at time 0 (grey plots) compared to 6 months (orange plots) do not reveal a significant improvement trend for Group 1. However, for Group 3, an improvement trend is observed in the right orange plot, represented by the downward shift of the treatment group’s median value; p values > 0.05 (t-test for paired data) for Groups 1 and p < 0.05 (*) for Group 3
Fig. 7
Fig. 7
Total Cholesterol levels (mg/dL), comparison between Time 0 and 12 months. Group 1: Mediterranean Diet; Group 2: Liraglutide; Group 3: Ketogenic Diet; Group 4: Metformin. The graphs depicted by the density curves above and the box plots below aim to describe the trend of total cholesterol levels between time 0 (grey graphs) and 12 months (yellow graphs). There is no significant change in values overall, but especially the yellow graphs for Group 2 and Group 3 still show a tendency towards leftward movement (decrease in total cholesterol values); p values > 0.05 (t-test for paired data) for Groups 1, 2, 3, 4
Fig. 8
Fig. 8
Comparison of LDL levels (mg/dL). Effect of MD (Group 1) and KD (Group 3) at Time 0 and after 3 months The graphs represented by the density curves above and the box plots below aim to describe the trend of LDL levels between time 0 (grey graphs) and 3 months (red graphs); no variation is shown for Group 1. For Group 3 on the right, the red curve at 3 months shows a tendency towards leftward movement (decrease in LDL values); p values > 0.05 (t-test for paired data) for Groups 1, 3
Fig. 9
Fig. 9
Analysis of fasting blood glucose levels (mg/dL). Effect of Liraglutide (Group 2) and KD (Group 3) at Time 0 and after 3 months. The graphs represented by the density curves above and the box plots below aim to describe the trend of FG levels between Group 2 (grey graphs) and Group 3 (red graphs). For both treatment groups in the right image (after 3 months), there is a trend of improvement in fasting glucose values, with a leftward shift (decrease in fasting glucose values); p values < 0.05 (t-test for paired data) for Groups 2 (*), 3 (*)
Fig. 10
Fig. 10
Comparison of HbA1clevels (%). Effect of Liraglutide (Group 2) and KD (Group 3) at Time 0 and after 3 months. The violin plots aim to describe the trend of HbA1c levels between Group 2 (grey plots) and Group 3 (red plots). For both treatment groups, there is a trend of improvement in HbA1c values, with a significant downward shift of both violin plots on the right (after 3 months of treatment) compared to the baseline on the left, highlighting a decrease in values; p value < 0.05 (t-test for paired data) for Group 2 (**), Group 3 p > 0.05
Fig. 11
Fig. 11
Comparison of HOMA-IR. Effect of Liraglutide (Group 2) and KD (Group 3) at Time 0 and after 3 months. The graphs represented by the density curves above and the box plots below aim to describe the trend of HOMA-IR levels between Group 2 (grey plots) and Group 3 (red plots). It is observed for both treatment groups in the right image a trend of improvement in HOMA-IR values, with a leftward shift, highlighting a decrease in values; p values > 0.05 (t-test for paired data) for Groups 2, 3

References

    1. Bray GA, Kim KK, Wilding JPH, Federation WO. ‘Obesity: a chronic relapsing progressive disease process. A position statement of the World Obesity Federation’, Obes Rev, vol. 18, no. 7, pp. 715–723, Jul. 2017, 10.1111/obr.12551. - PubMed
    1. Dancause KN, Olszowy KM. Identifying actionable lifestyle risk factors for obesity research and intervention: challenges and opportunities for Pacific Island health researchers. Lancet Reg Health – Western Pac. Nov. 2020;4. 10.1016/j.lanwpc.2020.100040. - PMC - PubMed
    1. Durrer Schutz D et al. Jan., ‘European Practical and Patient-Centred Guidelines for Adult Obesity Management in Primary Care’, Obesity Facts, vol. 12, no. 1, pp. 40–66, 2019, 10.1159/000496183. - PMC - PubMed
    1. Alberti KGMM, Zimmet P, Shaw J. Metabolic syndrome—a new world-wide definition. A Consensus Statement from the International Diabetes Federation. Diabet Med. 2006;23(5):469–80. doi: 10.1111/j.1464-5491.2006.01858.x. - DOI - PubMed
    1. Després J-P, Lemieux I. ‘Abdominal obesity and metabolic syndrome’, Nature, vol. 444, no. 7121, Art. no. 7121, Dec. 2006, 10.1038/nature05488. - PubMed