. 2024 Jun 6;25(1):146.
doi: 10.1186/s13059-024-03218-6.

DNA methylation patterns of transcription factor binding regions characterize their functional and evolutionary contexts

Affiliations

DNA methylation patterns of transcription factor binding regions characterize their functional and evolutionary contexts

Martina Rimoldi et al. Genome Biol. .

Abstract

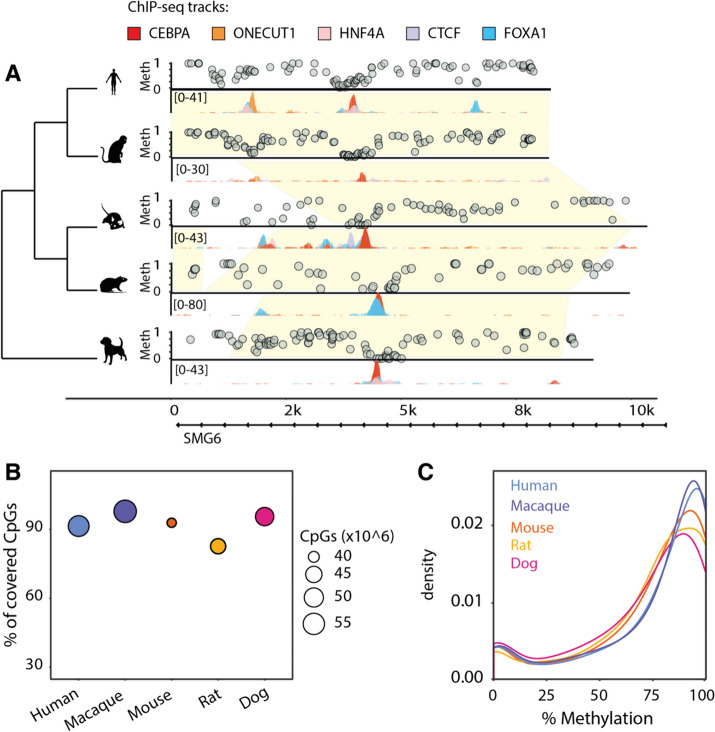
Background: DNA methylation is an important epigenetic modification which has numerous roles in modulating genome function. Its levels are spatially correlated across the genome, typically high in repressed regions but low in transcription factor (TF) binding sites and active regulatory regions. However, the mechanisms establishing genome-wide and TF binding site methylation patterns are still unclear.

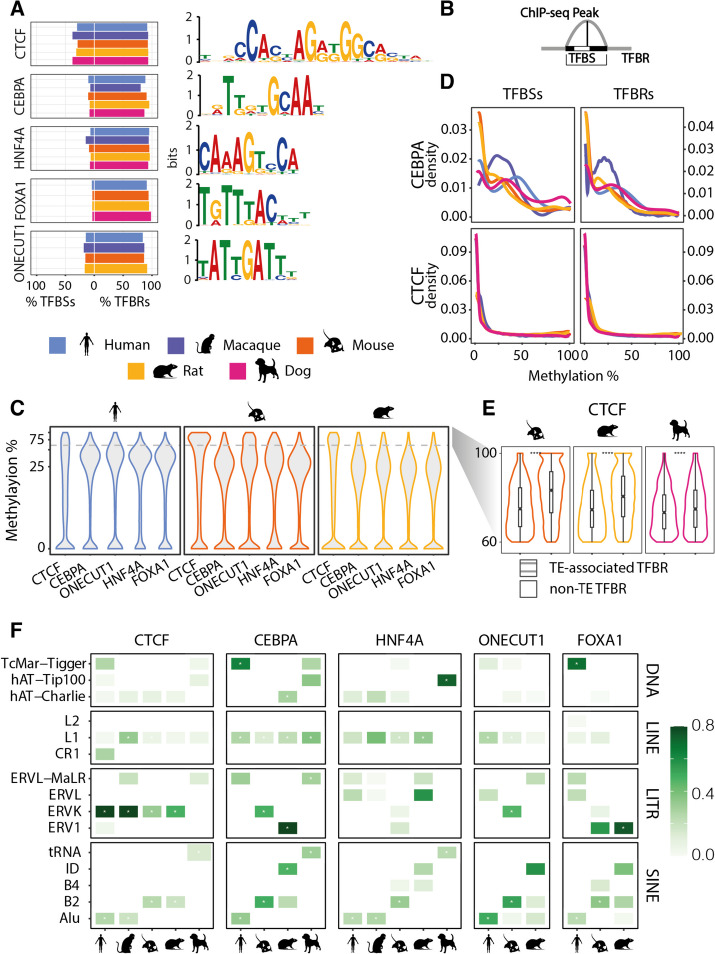
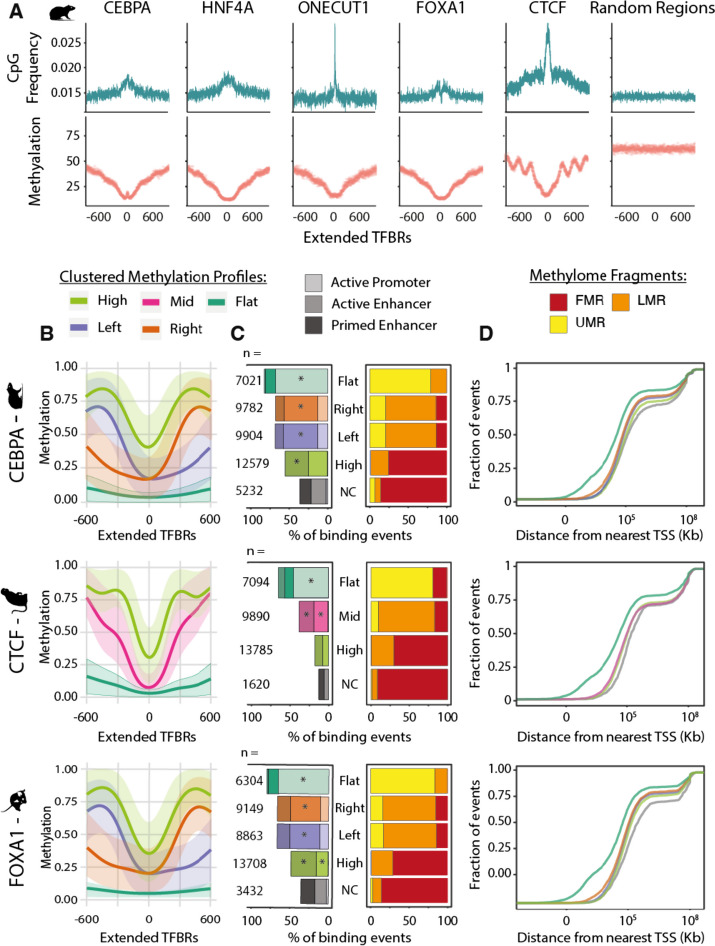
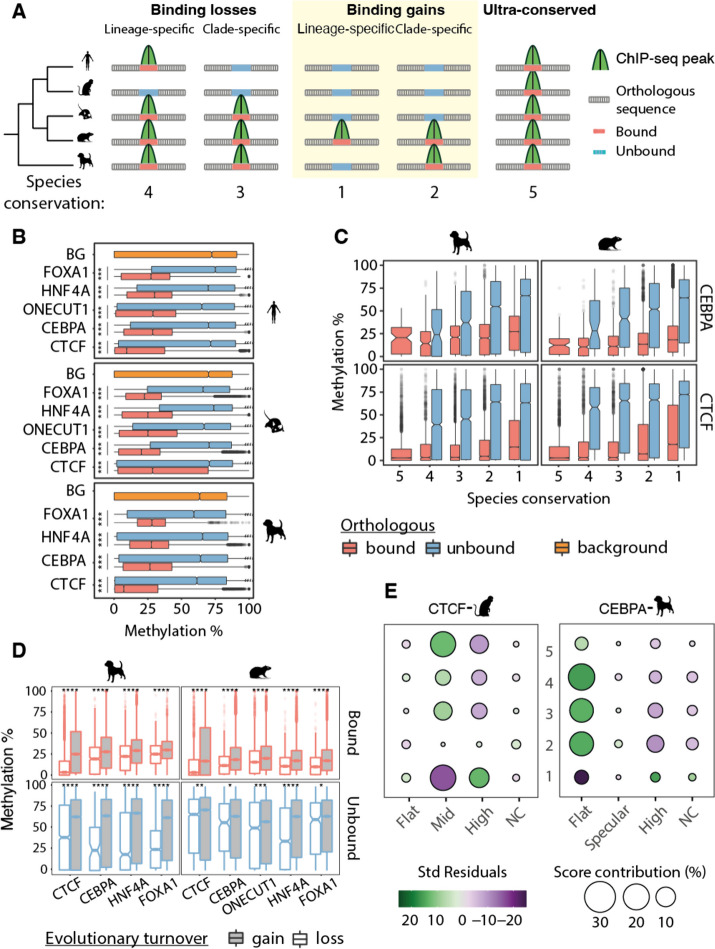
Results: Here we use a comparative approach to investigate the association of DNA methylation to TF binding evolution in mammals. Specifically, we experimentally profile DNA methylation and combine this with published occupancy profiles of five distinct TFs (CTCF, CEBPA, HNF4A, ONECUT1, FOXA1) in the liver of five mammalian species (human, macaque, mouse, rat, dog). TF binding sites are lowly methylated, but they often also have intermediate methylation levels. Furthermore, biding sites are influenced by the methylation status of CpGs in their wider binding regions even when CpGs are absent from the core binding motif. Employing a classification and clustering approach, we extract distinct and species-conserved patterns of DNA methylation levels at TF binding regions. CEBPA, HNF4A, ONECUT1, and FOXA1 share the same methylation patterns, while CTCF's differ. These patterns characterize alternative functions and chromatin landscapes of TF-bound regions. Leveraging our phylogenetic framework, we find DNA methylation gain upon evolutionary loss of TF occupancy, indicating coordinated evolution. Furthermore, each methylation pattern has its own evolutionary trajectory reflecting its genomic contexts.

Conclusions: Our epigenomic analyses indicate a role for DNA methylation in TF binding changes across species including that specific DNA methylation profiles characterize TF binding and are associated with their regulatory activity, chromatin contexts, and evolutionary trajectories.

Keywords: DNA methylation; Evolution; Mammals; Transcription factor binding.


Conflict of interest statement

P.F. is a member of the Scientific Advisory Boards of Fabric Genomics, Inc., and Eagle Genomics, Ltd. All other authors declare that they have no competing interests.

Figures

Fig. 1
Fig. 1
Experimentally mapping methylomes across mammals. A Example region: in vivo 5mC methylation and transcription factor binding around the SMG6 locus in livers isolated from five mammalian species. Yellow shades indicate EPO eutherian mammal alignment blocks (Ensembl version 98). For each species, levels of CpG methylation assayed with bisulfite sequencing are shown above the region, and binding of five transcription factors tracks (CEBPA, CTCF, FOXA1, HNF4A, ONECUT1) assayed through ChIP-sequencing are shown below. B Genomic coverage of WGBS data in each species. The y-axis shows the percentage, while the radius of each point denotes the total number of CpGs covered on the forward and reverse strands. C Genome-wide CpG methylation density distributions for each species. All distributions are bimodal, with the vast majority of CpGs hypermethylated
Fig. 2
Fig. 2
Methylation signatures at TFBRs. A Percentage of TFBRs and TFBSs harboring at least one CpG for each TF and species and their binding motifs. Most TFBRs contain CpGs, but rarely at the TF binding site. PWMs calculated from human samples are shown for each TF. B Definitions of transcription factor binding regions (TFBRs) and transcription factor binding sites (TFBSs). TFBRs are ChIP-seq peaks, normalized for length within species and TF. TFBSs span the binding motif closest to the ChIP-seq peak summit. C Average methylation levels of TFBRs. In all species and TFs, the distributions are bimodal. All TFs have a hypomethylated mode, while CTCF has a higher hypermethylation mode and the remaining TFs have a lower mode. D CpG methylation density distributions at TFBRs and TFBSs. All distributions are bimodal, except for CTCF which has unimodal distributions in all species. The hypermethylated regions’ cutoff is marked with a gray dashed (i.e. 60% average methylation). E Methylation levels within hypermethylated TFBRs overlapping transposable elements and those that are not repeat-associated. TFBRs have higher 5mC levels when they overlap with transposable elements. F Relative positive enrichment of hypermethylated TFBRs versus control hypomethylated TFBRs for selected groups of transposable elements
Fig. 3
Fig. 3
Distinct methylation profiles characterize transcription factor binding regions. A Average 5mC and CpG frequency profiles of rat transcription factor binding regions, centered on ChIP-seq peak summits and extended 600 bp on both sides. The number of regions classified in each profile is shown in panel B. B Clustered 5mC profiles for rat CEBPA, mouse FOXA1, and macaque CTCF binding regions centered on ChIP-seq peak summits and normalized to 1200 bp length. The regions have four types of methylation profiles: “flat” in dark green, “left” and “right” in purple and orange, respectively (both referred to as “specular” in the text), “high” in light green and “mid”, which is unique to CTCF, in pink. C Annotations of TF binding regions associated with each clustered methylation profiles defined in panel B. On the right, a bar plot showing the percentage of TF binding events belonging to each methylation profile located within Unmethylated (UMRs), Lowly Methylated (LMRs), or Fully Methylated Regions (FMR) of the genome (yellow, orange, and red, respectively). On the left, the percentage of TF binding events in each 5mC profile that are annotated as active promoters, active enhancers, or primed enhancers. The bars are colored according to the methylation profile assignment of the TFBRs and shaded by regulatory element annotation—lightest for active promoters, darker for active enhancers, and darkest for primed enhancers. Asterisks indicate that the annotation category is significantly enriched (z-test with Bonferroni correction, *p-values <  < 0.05). D Cumulative distributions of the distance of each TF binding region from the nearest transcription start site, grouped by methylation profiles defined in panel B. The x axis is in log10 scale
Fig. 4
Fig. 4
Coevolution of methylation and TF binding in mammals. A Schematic representation of the phylogenetic parsimony approach (adapted from [10]) to define species conservation categories and number of species with binding conservation. Briefly, TF binding events were first aligned and compared across species, then divided using parsimony in lineage- and clade-specific binding losses, and lineage- and clade-specific binding gains. Regions with experimentally determined binding in the species were called orthologous bound, and those without binding unbound. Ultra-conserved binding events were defined as those bound across all species. Below, examples of corresponding degrees of species conservation defined by the total number of species that share a TF binding event. B Average 5mC level distribution of orthologous bound regions, orthologous unbound regions, and genomic background (BG), with significant differences marked with asterixis (Wilcoxon test with Bonferroni correction, ***p-value ≤ 0.001). C Average 5mC distributions within CEBPA and CTCF orthologous bound and orthologous unbound regions divided by species conservation categories defined in panel A (Jonckheere-Terpstra trend test, p-values < 2.2e106), shown for dog and macaque. D Average 5mC distributions at orthologous bound and unbound regions of dog’s and rat’s TFBRs, further divided into evolutionary binding loss and gain events according to our parsimony approach. Orthologous sequences that concur in the definition of clade- or lineage-specific losses or gains are compared based on the presence (bound) or absence (unbound) of a binding event. Orthologous sequences defining a binding gain consistently have higher methylation levels than binding losses, both when unbound and bound by TFs (Wilcoxon test with Bonferroni correction, ***p-value ≤ 0.001). E Relationships between species conservation and 5mC profiles. Balloon plots show standardized residuals from an association analysis (chi-square test of independence) between 5mC profiles and TF binding conservation categories for dog’s CEBPA and macaque’s CTCF TF binding events. Positive residuals indicate a positive association between the degree of species conservation and methylation profile, while negative residuals indicate negative associations. For example, dog’s CEBPA binding events with a flat profile are positively associated with higher levels of species conservation, while they are negatively associated with lineage-specific binding events. The size of the balloons is proportional to the percentage of contribution to the total Chi-square score, therefore highlighting the most influencing combination of species conservation and methylation profile to the overall statistics

Similar articles

Cited by

References

    1. Marinov GK, Kundaje A. ChIP-ping the branches of the tree: functional genomics and the evolution of eukaryotic gene regulation. Brief Funct Genomics Oxford Academic. 2018;17:116–137. doi: 10.1093/bfgp/ely004. - DOI - PMC - PubMed
    1. Villar D, Flicek P, Odom DT. Evolution of transcription factor binding in metazoans — mechanisms and functional implications. Nat Rev Genet. 2014;15:221–233. doi: 10.1038/nrg3481. - DOI - PMC - PubMed
    1. Yue F, Cheng Y, Breschi A, Vierstra J, Wu W, Ryba T, et al. A comparative encyclopedia of DNA elements in the mouse genome. Nature. 2014;515:355–364. doi: 10.1038/nature13992. - DOI - PMC - PubMed
    1. Ballester B, MedinaRivera A, Schmidt D, Gonzàlez-Porta M, Carlucci M, Chen X. Multi-species, multi-transcription factor binding highlights conserved control of tissue-specific biological pathways. eLife Sci. 2014;3:e02626. doi: 10.7554/eLife.02626. - DOI - PMC - PubMed
    1. Odom DT, Dowell RD, Jacobsen ES, Gordon W, Danford TW, MacIsaac KD, et al. Tissue-specific transcriptional regulation has diverged significantly between human and mouse. Nat Genet. 2007;39:730–732. doi: 10.1038/ng2047. - DOI - PMC - PubMed

Publication types

Substances

LinkOut - more resources