Multicenter Study
. 2024 Jun 6;13(1):58.
doi: 10.1186/s13756-024-01421-5.

Investigation of multiple nosocomial infections using a semi-Markov multi-state model

Affiliations
Multicenter Study

Investigation of multiple nosocomial infections using a semi-Markov multi-state model

Xiao Zhong et al. Antimicrob Resist Infect Control. .

Abstract

Background: The prevalence of multiple nosocomial infections (MNIs) is on the rise, however, there remains a limited comprehension regarding the associated risk factors, cumulative risk, probability of occurrence, and impact on length of stay (LOS).

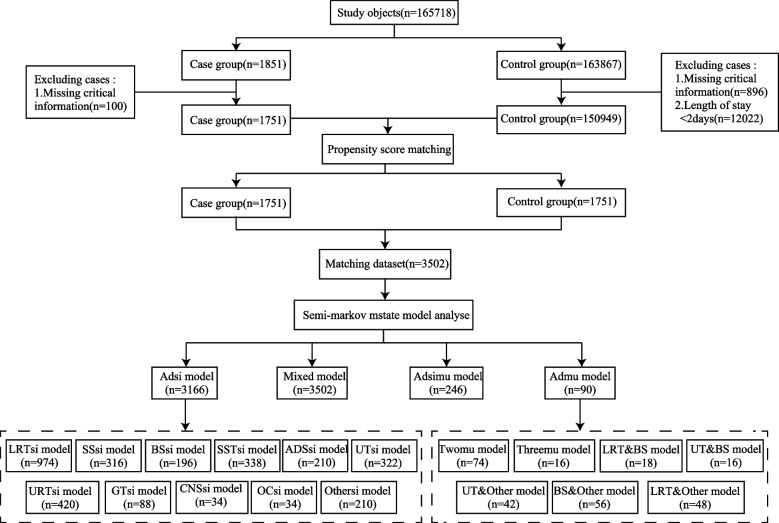
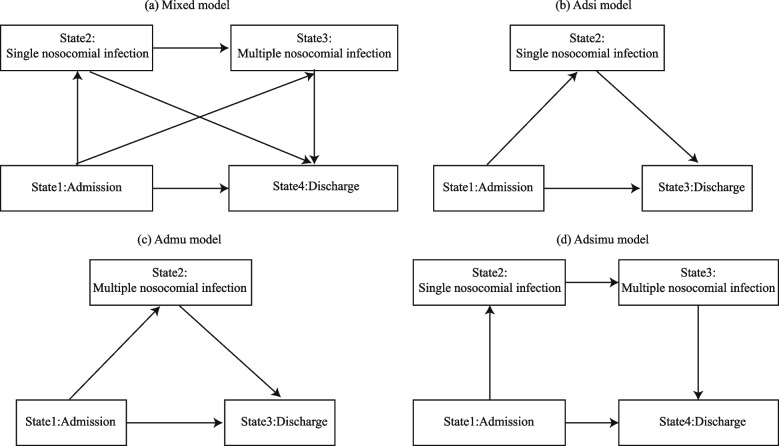
Method: This multicenter study includes all hospitalized patients from 2020 to July 2023 in two sub-hospitals of a tertiary hospital in Guangming District, Shenzhen. The semi-Markov multi-state model (MSM) was utilized to analyze risk factors and cumulative risk of MNI, predict its occurrence probability, and calculate the extra LOS of nosocomial infection (NI).

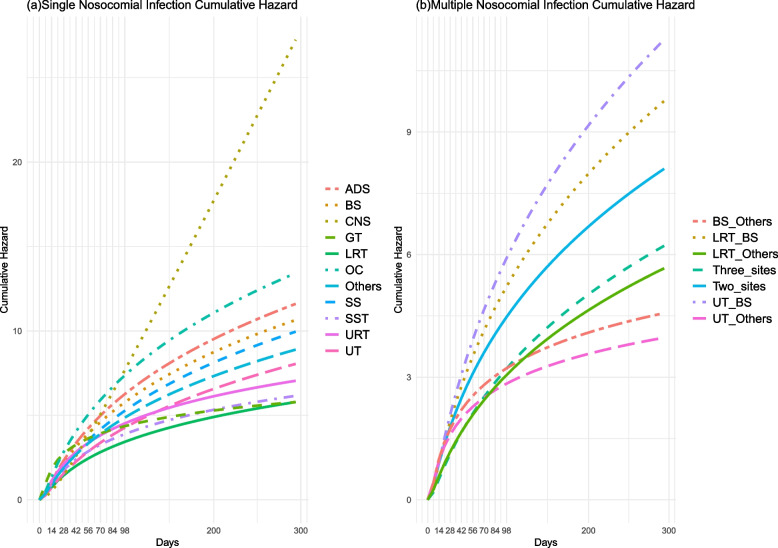
Results: The risk factors for MNI include age, community infection at admission, surgery, and combined use of antibiotics. However, the cumulative risk of MNI is lower than that of single nosocomial infection (SNI). MNI is most likely to occur within 14 days after admission. Additionally, SNI prolongs LOS by an average of 7.48 days (95% Confidence Interval, CI: 6.06-8.68 days), while MNI prolongs LOS by an average of 15.94 days (95% CI: 14.03-18.17 days). Furthermore, the more sites of infection there are, the longer the extra LOS will be.

Conclusion: The longer LOS and increased treatment difficulty of MNI result in a heavier disease burden for patients, necessitating targeted prevention and control measures.

Keywords: Cumulative risk; Length of stay; Multiple nosocomial infection; Nosocomial infection; Risk factors; Semi-Markov multi-state model.


Conflict of interest statement

The authors declare no competing interests.

Figures

Fig. 1
Fig. 1
The study flow chart. Note. Single Nosocomial Infection, Si, Multiple Nosocomial Infection, Mu, Lower Respiratory Tract, LRT, Surgical Site, SS, Blood System, BS, Skin and Soft Tissue, SST, Abdomen and Digestive System, ADS, Urinary Tract, UT, Upper Respiratory Tract, URT, Genital Tract, GT, Central Nervous System, CNS, Oral Cavity, OC
Fig. 2
Fig. 2
The multi-state models employed in this study. The diagram (a) is divided into four states, representing the natural history of nosocomial infection occurrence. Due to insufficient deaths, death and discharge statuses were combined, and the transfer routes were ignored due to few cases of multiple nosocomial infection transferring to single nosocomial infection. The diagrams (b) and (c) have only three states each for research purposes, with state 2 representing single or multiple nosocomial infections. The diagram (d) omits the paths of single nosocomial infection transfer to discharge and admission transfer to multiple nosocomial infection
Fig. 3
Fig. 3
Transfer cumulative risk without stratification. The diagram (a) illustrates the cumulative risk curve of the mixed model, with state 1 indicating admission, state 2 representing single nosocomial infection, state 3 denoting multiple nosocomial infection, and state 4 signifying discharge. The diagram (b) illustrates the cumulative risk curve of the Adsi model, with state 1 indicating admission, state 2 representing single nosocomial infection, and state 3 denoting discharge. The Admu model's transfer-specific cumulative risk curve (c) depicts admission as state 1, multiple nosocomial infection as state 2, and discharge as state 3. The diagram (d) displays the cumulative risk curve of the Adsimu model, with state 1 representing admission, state 2 indicating single nosocomial infection, state 3 representing multiple nosocomial infection generations, and state 4 denoting discharge
Fig. 4
Fig. 4
The cumulative risk curves stratified by infection sites of nosocomial infection. The diagram (a) represents cumulative risk of nosocomial infection at a single site, while the diagram (b) represents it at multiple sites. CNS; Lower Respiratory Tract, LRT; Surgical Site, SS; Blood System, BS; Urinary Tract, UT; Skin and Soft Tissue, SST; Abdomen and Digestive System, ADS; Upper Respiratory Tract, URT; Genital Tract, GT; Oral Cavity, OC
Fig. 5
Fig. 5
Predict nosocomial infection probability. The diagram(a) shows the probability of single nosocomial infection occurring at 7, 14, 21, 28, 60, and 90 days based on the infection site. The diagram(b) illustrates the probability of multiple nosocomial infection occurring at 7, 14, 21, 28, 60, and 90 days based on the infection site. Abdomen and Digestive System, ADS; Adsi model, Adsi; Adsimu model, Adsimu; Blood System, BS; Central Nervous System, CNS; Genital Tract, GT; Lower Respiratory Tract, LRT; Mixed model, Mixed; Oral Cavity, OC; Surgical Site, SS; Skin and Soft Tissue, SST; Upper Respiratory Tract, URT; Urinary Tract, UT; Admu model, Admu; Three sites of nosocomial infections, Threemu; Two sites of nosocomial infections, Twomu
Fig. 6
Fig. 6
Extra − LOS and its 95% CI for various types of NIs. The figure showcases the varying distributions and patterns of extra-LOS among diverse NIs hospitalizations. The figure is composed of columns representing the extra-LOS for each hospitalization type. Of note, each column is accompanied by a line segment, representing the 95% CI for the corresponding extra-LOS value. Specifically, the upper endpoint of the line segment signifies the upper limit of the 95% CI (up95%CI), while the lower endpoint marks the lower limit (low95%CI). Note. Length of Stay, LOS; Confidence Interval, CI; Nosocomial Infection, NI; Adsi model, Adsi; Central Nervous System, CNS; Lower Respiratory Tract, LRT; Surgical Site, SS; Blood System, BS; Urinary Tract, UT; Skin and Soft Tissue, SST; Abdomen and Digestive System, ADS; Upper Respiratory Tract, URT; Genital Tract, GT; Oral Cavity, OC; Admu model, Admu; Three sites of nosocomial infections, Threemu; Two sites of nosocomial infections, Twomu; Adsimu model, Adsimu

Similar articles

References

    1. Liu JY, Dickter JK. Nosocomial Infections: A History of Hospital-Acquired Infections. Gastrointest Endosc Clin N Am. 2020;30:637–652. doi: 10.1016/j.giec.2020.06.001. - DOI - PubMed
    1. Arefian H, Hagel S, Heublein S, Rissner F, Scherag A, Brunkhorst FM, et al. Extra length of stay and costs because of health care-associated infections at a German university hospital. Am J Infect Control. 2016;44:160–166. doi: 10.1016/j.ajic.2015.09.005. - DOI - PubMed
    1. Zhou Q, Fan L, Lai X, Tan L, Zhang X. Estimating extra length of stay and risk factors of mortality attributable to healthcare-associated infection at a Chinese university hospital: a multi-state model. BMC Infect Dis. 2019;19:975. doi: 10.1186/s12879-019-4474-5. - DOI - PMC - PubMed
    1. Sikora A, Zahra F. Nosocomial Infections. StatPearls. Treasure Island (FL) ineligible companies. Disclosure: Farah Zahra declares no relevant financial relationships with ineligible companies.: StatPearls Publishing Copyright © 2023. Treasure Island: StatPearls Publishing LLC.; 2023.
    1. Hazard D, von Cube M, Kaier K, Wolkewitz M. Predicting Potential Prevention Effects on Hospital Burden of Nosocomial Infections: A Multistate Modeling Approach. Value Health. 2021;24:830–838. doi: 10.1016/j.jval.2021.02.002. - DOI - PubMed

Publication types

Substances

LinkOut - more resources