. 2024 Aug 12;5(8):100984.
doi: 10.1016/j.xplc.2024.100984. Epub 2024 Jun 6.

Single-cell transcriptome atlases of soybean root and mature nodule reveal new regulatory programs that control the nodulation process

Affiliations

Single-cell transcriptome atlases of soybean root and mature nodule reveal new regulatory programs that control the nodulation process

Sergio Alan Cervantes-Pérez et al. Plant Commun. .

Abstract

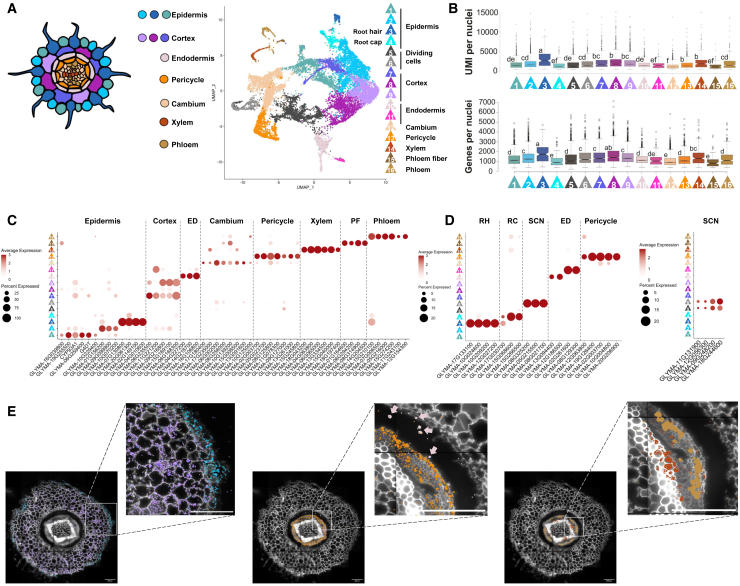
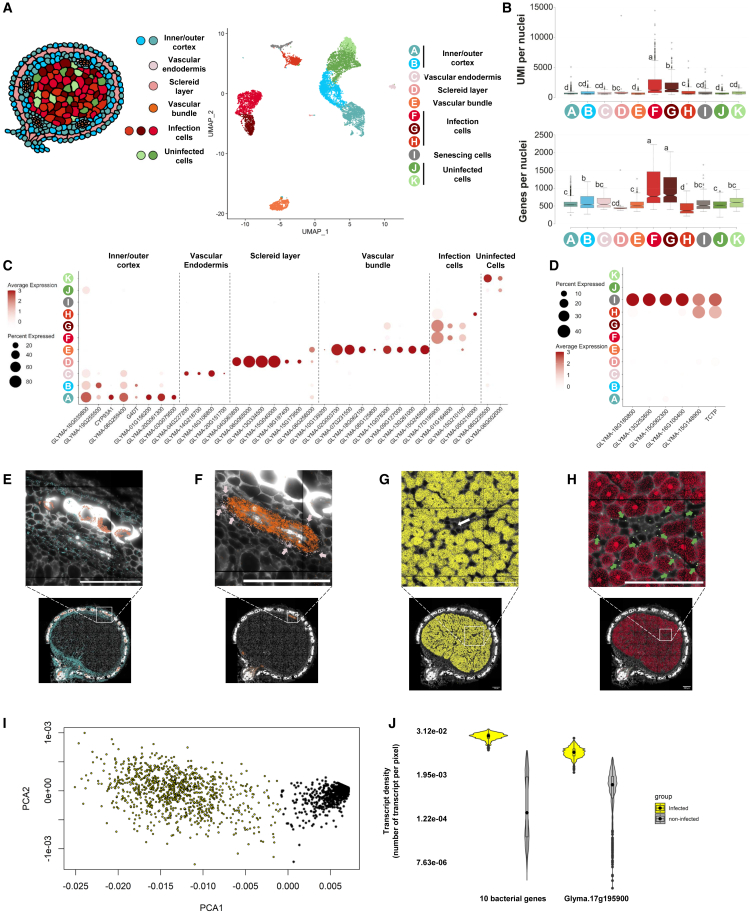
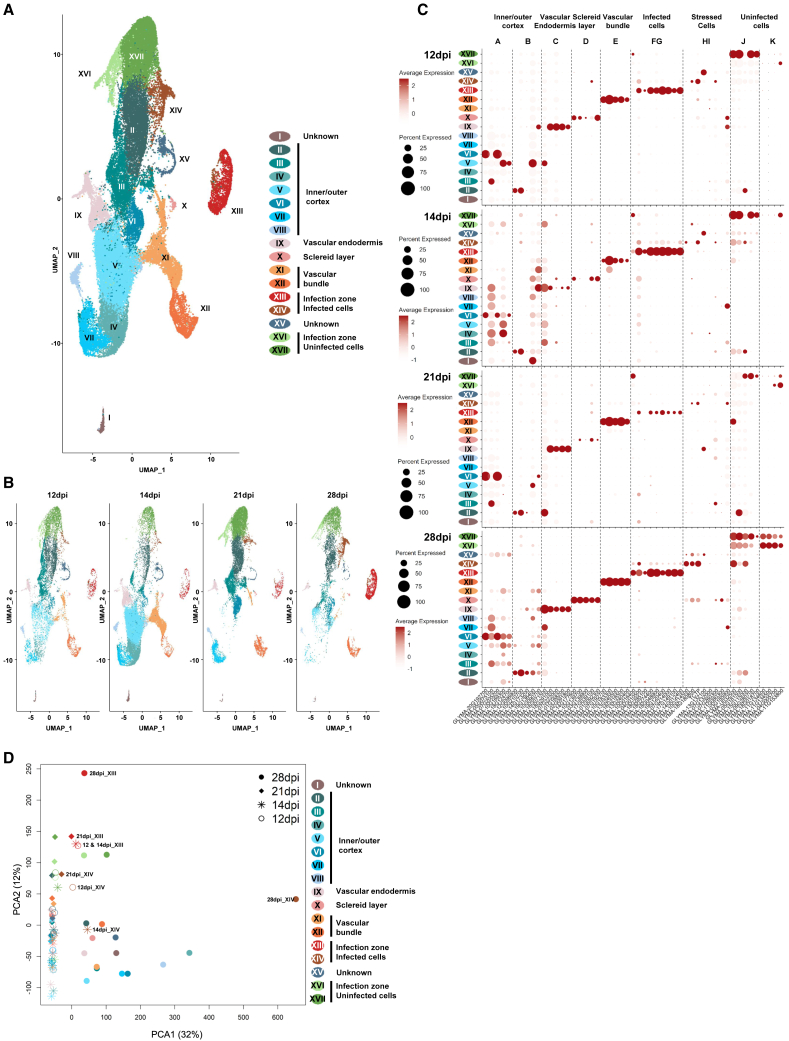
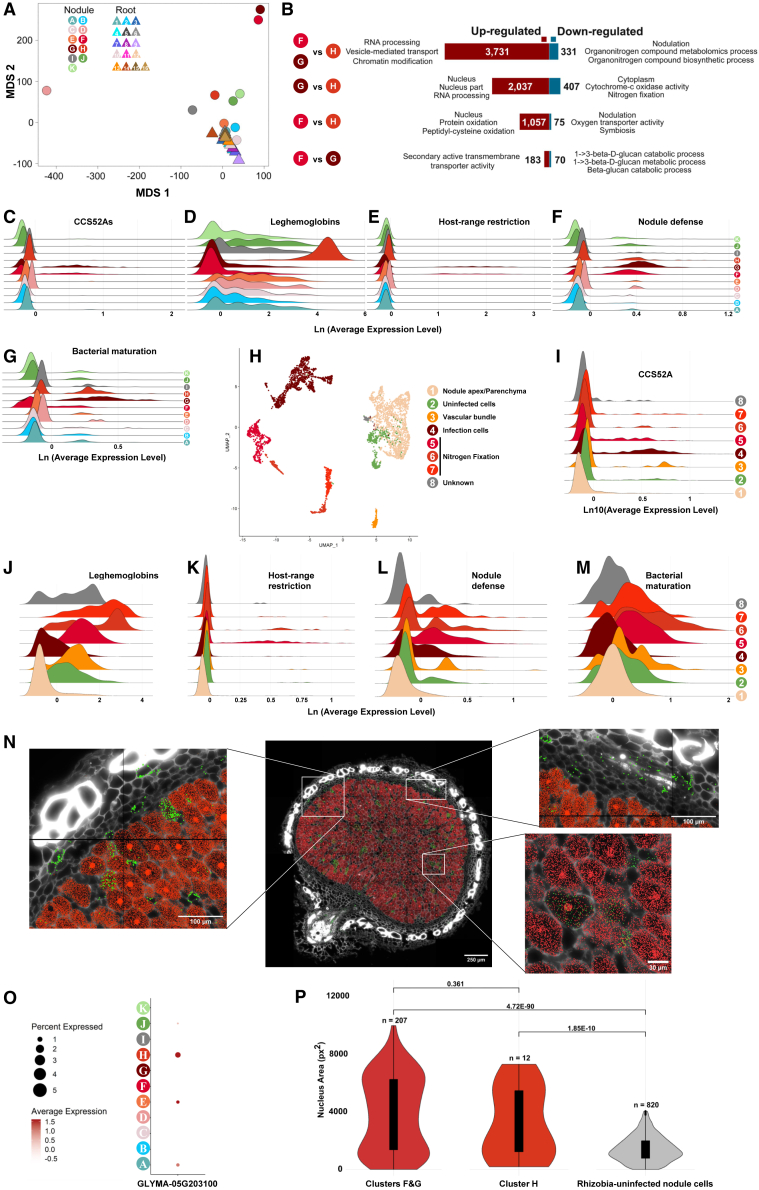
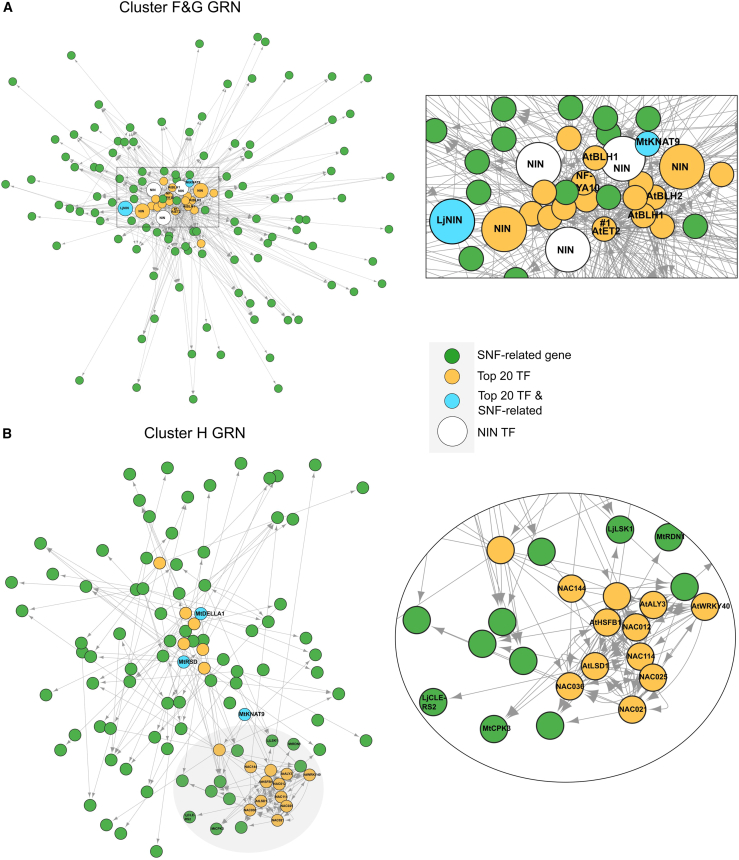
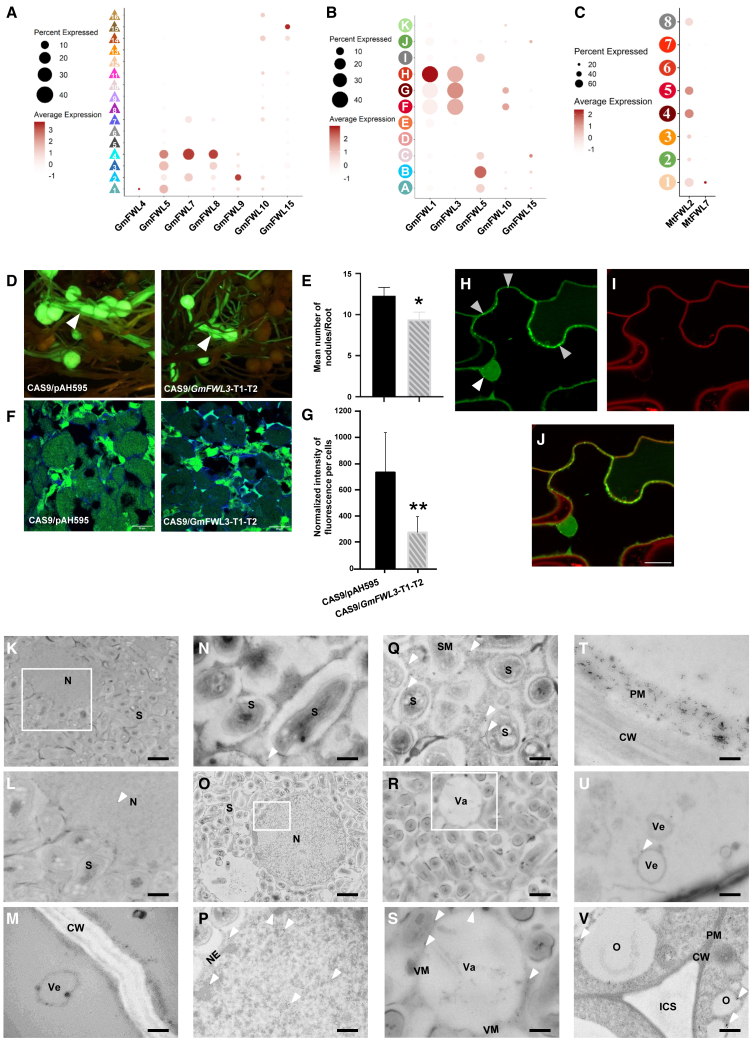
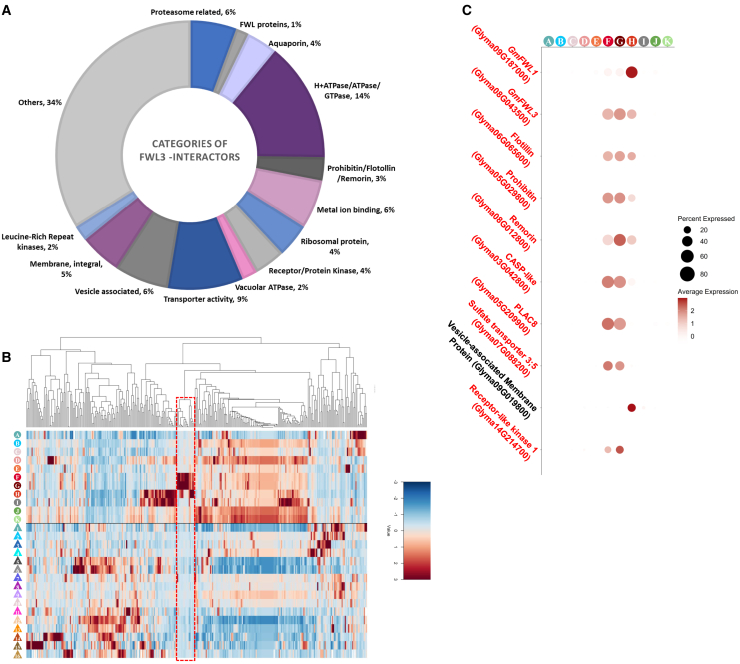
The soybean root system is complex. In addition to being composed of various cell types, the soybean root system includes the primary root, the lateral roots, and the nodule, an organ in which mutualistic symbiosis with N-fixing rhizobia occurs. A mature soybean root nodule is characterized by a central infection zone where atmospheric nitrogen is fixed and assimilated by the symbiont, resulting from the close cooperation between the plant cell and the bacteria. To date, the transcriptome of individual cells isolated from developing soybean nodules has been established, but the transcriptomic signatures of cells from the mature soybean nodule have not yet been characterized. Using single-nucleus RNA-seq and Molecular Cartography technologies, we precisely characterized the transcriptomic signature of soybean root and mature nodule cell types and revealed the co-existence of different sub-populations of B. diazoefficiens-infected cells in the mature soybean nodule, including those actively involved in nitrogen fixation and those engaged in senescence. Mining of the single-cell-resolution nodule transcriptome atlas and the associated gene co-expression network confirmed the role of known nodulation-related genes and identified new genes that control the nodulation process. For instance, we functionally characterized the role of GmFWL3, a plasma membrane microdomain-associated protein that controls rhizobial infection. Our study reveals the unique cellular complexity of the mature soybean nodule and helps redefine the concept of cell types when considering the infection zone of the soybean nodule.

Keywords: nanodomains; nodule; root; single-cell RNA-seq; soybean.


Figures

Figure 1
Figure 1
Establishment of a single-nucleus transcriptome atlas of the soybean root. (A) Uniform Manifold Approximation and Projection (UMAP) plot of 14 369 soybean root nuclei based on their transcriptomic profiles. The nuclei were clustered into 16 different groups. (B) Distribution of the number of unique molecular identifiers (UMIs) and expressed genes per root cluster (Tukey’s test with p < 0.05 reported to highlight differences between clusters). (C) Dotplot representation of the expression of 52 soybean root cell-type-specific marker genes validated using M.C. technology (Supplemental Figure 3). (D) Dotplot representations of the expression of root cell-type-specific marker genes identified on the basis of previous functional genomics studies and their orthologous relationships with root cell-type-specific marker genes from Arabidopsis thaliana and Medicago truncatula (Supplemental Figure 4). For these two dotplot figures, the percentage of nuclei expressing the gene of interest (circle size) and the mean expression of the gene (circle color) are shown. (E) Integrated analysis of the expression of several soybean root marker genes using M.C. technology on a soybean root cross-section. Left panel: detection of transcripts from epidermal (blue) and cortical (purple) marker genes. Central panel: detection of transcripts from endodermal (light pink color; see arrows in the magnified picture) and pericycle (orange) marker genes. Right panel: detection of transcripts from xylem (red) and phloem (brown) marker genes. ED, endodermis; PF, phloem fiber; RH, root hair cells; RC, root cap cells; SCN, stem cell niche (see methods for details).
Figure 2
Figure 2
Establishment of a single-nucleus transcriptome atlas of the soybean nodule. (A) UMAP plot of 7830 soybean nodule nuclei based on their transcriptomic profiles. The nuclei were clustered into 11 different groups (clusters A to K). (B) Distribution of the number of UMIs and expressed genes per nodule cluster (Tukey’s test with p < 0.05 reported to highlight differences between clusters). (C) Dotplot representation of the expression of 34 cell-type-specific marker genes of the soybean nodule validated using M.C. technology (Supplemental Figures 6 and 7). (D) Dotplot representation of the expression of six nodule cluster I-specific marker genes. The dot sizes in (C) and (D) represent the percentage of cells in which each gene is expressed. For these two dotplot figures, the percentage of nuclei expressing the gene of interest (circle size) and the mean expression (circle color) of the gene are shown. (E–H) Integrated analysis of the expression of several soybean nodule marker genes using M.C. technology on a soybean nodule cross-section. (E) Detection of transcripts from the inner/outer cortical cells (blue) and the sclereid layer (pink). (F) Detection of transcripts from the vascular endodermis (light pink) and vascular bundle (orange). (G) Detection of B. diazoefficiens transcripts from nine different genes in infected nodule cells (yellow). (H) Detection of plant transcripts in B. diazoefficiens-infected (red) and uninfected cells (green; green arrows) (see methods for details). (I) Identification of the population of 968 rhizobia-infected (yellow circles) and 1769 uninfected cells (black stars) of the nodule through a principal-component analysis (PCA) plot of nodule cells analyzed by M.C. technology. To generate these plots, the transcript numbers of the 10 B. diazoefficiens genes were taken into consideration. (J) Violin plots of the density of the number of 10 different bacterial (left) and Glyma.17G195900 (right) transcripts in the population of 968 infected (yellow) and 1769 uninfected (gray) cells of the soybean nodule. A two-tailed Student’s t-test of 0 supports the significant difference in expression of 10 bacterial genes and Glyma.17G195900 between B. diazoefficiens–infected and uninfected cells.
Figure 3
Figure 3
Integrated analysis of single-cell gene expression datasets during development of the soybean nodule. (A) UMAP projection and integration of soybean nodule transcriptomes at single-cell resolution for nodules at 12 dpi (Liu et al., 2023), 14 dpi (Sun et al., 2023), 21 dpi (Liu et al., 2023), and 28 dpi (this study). The 17 clusters of this integrated UMAP (I to XVII) were functionally annotated on the basis of the expression of 51 cell-type marker genes identified from the 28-dpi sNucRNA-seq datasets (i.e., p ≤ 0.01; expression in ≥25% of the nuclei in the cluster under consideration; Supplemental Figure 12). (B) Split UMAPs and distribution of the number of nuclei per cluster in percentages for each developmental stage of the nodule (i.e., 12, 14, 21, and 28 dpi). (C) Dotplot representation of the expression of the 51 nodule cell-type marker genes (Supplemental Figure 12) at 4 developmental stages of the soybean nodule. The percentage of nuclei in the cluster expressing the gene of interest (circle diameter) and the mean of gene expression (circle color) are both displayed. (D) Principal-component analysis of the transcriptomes of the 17 clusters of the integrated soybean nodule UMAP and for each nodule developmental stage (12-, 14-, 21-, and 28-dpi). The transcriptomes of the cells infected by rhizobia (clusters XIII and XIV) are specifically labeled.
Figure 4
Figure 4
Identification of distinct populations of B. diazoefficiens–infected cells based on their transcriptional profiles. (A) Comparative cell multi-dimensional scaling (MDS) plot of the 16 root and 11 nodule clusters. (B) Identification of differentially expressed genes (DEGs) between the B. diazoefficiens–infected cell clusters of the soybean nodule (i.e., clusters F, G, and H). For each population of DEGs, we have highlighted the top enriched gene ontology categories. (C–G) Ridge plot distributions of the expression of soybean CCS52A(C) and leghemoglobin genes (D), as well as genes that control host-range restriction (E), nodule defense (F), and bacterial maturation (G) (x axis) as defined by Roy et al. (2020) (Supplemental Table 4). The number of cells expressing the gene(s) in each cluster is represented on the y axis. (H) UMAP plot of 4368 Medicago nodule nuclei based on their transcriptomic profiles. The raw single-cell RNA-seq datasets were obtained from Ye et al. (2022) and reprocessed before generating the UMAP (see methods). These nuclei were clustered into 8 different groups. (I–M) Ridge plot distributions of the expression of Medicago CCS52A(I) and leghemoglobin genes (J), as well as genes that control host-range restriction (K), nodule defense (L), and bacterial maturation (M) (x axis) as defined by Roy et al. (2020) (Supplemental Table 4). The number of cells expressing the gene(s) in each cluster is represented on the y axis. (N) M.C. images of the expression of Glyma.05G203100 (green) and Glyma.17G195900 (red) genes used as markers of rhizobia-infected nodule cells. Glyma.05G203100 transcripts were specifically detected in a subset of infected nodule cells (right panel), in the cells of the vascular bundle (top-left panel), and in a sub-population of cortical cells (bottom-left panel). (O) Dotplot representations of the expression of Glyma.05G203100. The percentage of nuclei in the cluster expressing the gene of interest (circle diameter) and the mean of gene expression (circle color) are both displayed. (P) Distribution of the nuclear area of rhizobia-infected cells of clusters F and G and cluster H and uninfected nodule cells. A two-tailed Student’s t-test was used to estimate the significance of differences in nuclear area among these clusters.
Figure 5
Figure 5
Gene regulatory networks of 28-dpi rhizobia-infected cells. (A) Simplified visualization of the inferred gene regulatory network for nodule cell clusters F and G. This network shows only interactions that involve the top 20 regulators (orange nodes, or blue if they are also SNF related) of this network and/or known SNF-related genes (green nodes, or blue if they are also among the top 20 regulators). In this network, to underscore the enrichment of NIN TFs, we also visualized three NINs (large white nodes) that are neither among the top 20 hubs nor the SNF-related genes but are among the top 100 regulators in the network. Genes referenced in the main text have been labeled by gene names and the remaining nodes by their soybean gene IDs. (B) Simplified visualization of the inferred gene regulatory network for nodule cell cluster H. This network shows only interactions that involve the top 21 regulators (orange nodes, or blue if they are also SNF related) of this network and/or known SNF-related genes (green nodes, or blue if they are also among the top 21 regulators). In this network, a cluster of 12 regulators at the bottom of the network, including the top eight hubs of the list (see Supplemental Table 9), is highlighted in gray. Genes referenced in the main text and blue nodes are labeled by gene names and the remaining nodes by their soybean gene IDs.
Figure 6
Figure 6
Functional characterization of GmFWL3, a new microdomain-associated protein-coding gene. (A–C) Dotplot representations of the expression of GmFWL genes expressed in at least 1 of the 16 root (A) and 11 nodule clusters (B), and the expression of MtFWL2 and 7, orthologs of GmFWL3 and 1, respectively, in the M. truncatula nodule clusters (Figure 4H) (C). The percentage of nuclei in the cluster expressing the gene of interest (circle diameter) and the mean of gene expression (circle color) are both displayed. (D) Stereoscope images of representative transgenic soybean roots upon mutagenesis of GmFWL3 using CRISPR-Cas9 technology (CAS9/GmFWL3-T1-T2 transgene) and of control roots (CAS9/pAH595 transgene). The GFP signal was used as a reporter to identify the transgenic roots (white arrow). (E) Average number of nodules on 150 pUB-CAS9-pAH595 and 201 pUB-CAS9/GmFWL3-T1-T2 GFP-positive transgenic roots (Student’s t-test: p = 0.009). (F) Representative SYTO13 staining of transgenic soybean roots transformed with CAS9/pAH595 control (pUB-CAS9-pAH595) and CAS9/GmFWL3-T1-T2 transgenes. Staining reveals the density of rhizobial bacteria in infected cells of the soybean nodules. (G) Quantification of the infection rate of CAS9/pAH595 control and CAS9/GmFWL3-T1-T2 transgenic nodule cells upon SYTO13 staining of bacterial and nuclear DNA (ANOVA single factor test a = 0.05, ∗p < 1e−100, n ≈ 350). (H–J) Subcellular localization of GmFWL3 in tobacco leaves using confocal microscopy and in soybean nodules using transmission electron microscopy after immunogold labeling. Cross-sections of tobacco leaf cells transiently expressing p35S::GmFWL3-GFP (H, gray and white arrows highlight the punctate localization of GmFWL3 on the plasma and nuclear membranes) and counterstained with the membrane dye SynaptoRed (FM-64, I) reveal the punctate plasma membrane localization of GFP-GmFWL3 fusion proteins. Co-localization of the GFP-GmFWL3 signal with the membrane dye FM64 confirms its membrane localization (J). Scale bar, 20 μm. (K–V) Subcellular localization of GmFWL3 in soybean nodules observed by transmission electron microscopy after immunogold labeling. Representative images of gold particle distribution in the plasma membrane (PM), symbiosome (S), vacuole (Va), vesicles (Ve), membrane-bound organelles (O), nuclear envelope (NE), and nucleus (N) after immunogold labeling against a c-myc epitope tag alone (control, K–N) and myc-tagged GmFWL3 chimeric protein (O–V). Compared with c-myc alone, which had no or a few randomly distributed gold particles (K–N), the myc-GmFWL3 protein was strongly detected in the nucleus (O and P), nuclear envelope (P), symbiosome membranes (Q), vacuolar membrane (R and S), plasma membrane (T), and vesicular and other membrane-bound organelles (U and V). White arrowheads point to the gold particles. CW, cell wall; PM, plasma membrane; S, symbiosome; SM, symbiosome membrane; Va, vacuole; VM, vacuolar membrane; Ve, vesicle; N, nucleus; NE, nuclear envelope; ICS, intercellular space. Scale bars correspond to 400 nm (A–K), 1 μm (L, zoom in from K, see white box; and S, zoom in from R, see white box), and 2 μm (P, zoom in from O, see white box).
Figure 7
Figure 7
Co-expression of genes encoding proteins co-immunoprecipitated with GmFWL3 at the single-cell level. (A) Donut chart of the distribution of putative GmFWL3 interaction partners according to their biological functions. (B) Heatmap representation of the expression of genes encoding the 321 proteins proposed to interact with GmFWL3. Gene expression is displayed for each of the 16 soybean root clusters (1–16; Figure 1A) and 11 28-dpi soybean nodules (A–K; Figure 2A). The set of genes highlighted in the red dashed square are preferentially expressed in clusters F, G, and H. (C) Dotplot representation of the expression of 10 soybean genes that interact with GmFWL3, including GmFWL3 itself. Nine are preferentially expressed in clusters F, G, and H (Supplemental Figure 20). The percentage of nuclei expressing the gene of interest (circle size) and the mean expression (circle color) of the genes are shown.

Similar articles

Cited by

References

    1. Adachi S., Minamisawa K., Okushima Y., Inagaki S., Yoshiyama K., Kondou Y., Kaminuma E., Kawashima M., Toyoda T., Matsui M., et al. Programmed induction of endoreduplication by DNA double-strand breaks in Arabidopsis. Proc. Natl. Acad. Sci. USA. 2011;108:10004–10009. - PMC - PubMed
    1. Agtuca B.J., Stopka S.A., Evans S., Samarah L., Liu Y., Xu D., Stacey M.G., Koppenaal D.W., Paša-Tolić L., Anderton C.R., et al. Metabolomic profiling of wild-type and mutant soybean root nodules using laser-ablation electrospray ionization mass spectrometry reveals altered metabolism. Plant J. 2020;103:1937–1958. - PubMed
    1. Benedito V.A., Torres-Jerez I., Murray J.D., Andriankaja A., Allen S., Kakar K., Wandrey M., Verdier J., Zuber H., Ott T., et al. A gene expression atlas of the model legume Medicago truncatula. Plant J. 2008;55:504–513. - PubMed
    1. Bergersen F. Ammonia? An Early Stable Product of Nitrogen Fixation by Soybean Root Nodules FJ Bergersen. Aust. J. Biol. Sci. 1965;18:1–9.
    1. Bhagwat A.A., Mithö A., Pfeffer P.E., Kraus C., Spickers N., Hotchkiss A., Rgen Ebel J., Keister D.L. Further Studies of the Role of Cyclic-Glucans in Symbiosis. An ndvC Mutant of Bradyrhizobium japonicum Synthesizes Cyclodecakis-(133)-Glucosyl 1. 1999 - PMC - PubMed

MeSH terms