Review
. 2024 Jun 27;16(25):11879-11913.
doi: 10.1039/d4nr01413h.

Unveiling brain disorders using liquid biopsy and Raman spectroscopy

Affiliations
Review

Unveiling brain disorders using liquid biopsy and Raman spectroscopy

Jeewan C Ranasinghe et al. Nanoscale. .

Abstract

Brain disorders, including neurodegenerative diseases (NDs) and traumatic brain injury (TBI), present significant challenges in early diagnosis and intervention. Conventional imaging modalities, while valuable, lack the molecular specificity necessary for precise disease characterization. Compared to the study of conventional brain tissues, liquid biopsy, which focuses on blood, tear, saliva, and cerebrospinal fluid (CSF), also unveils a myriad of underlying molecular processes, providing abundant predictive clinical information. In addition, liquid biopsy is minimally- to non-invasive, and highly repeatable, offering the potential for continuous monitoring. Raman spectroscopy (RS), with its ability to provide rich molecular information and cost-effectiveness, holds great potential for transformative advancements in early detection and understanding the biochemical changes associated with NDs and TBI. Recent developments in Raman enhancement technologies and advanced data analysis methods have enhanced the applicability of RS in probing the intricate molecular signatures within biological fluids, offering new insights into disease pathology. This review explores the growing role of RS as a promising and emerging tool for disease diagnosis in brain disorders, particularly through the analysis of liquid biopsy. It discusses the current landscape and future prospects of RS in the diagnosis of brain disorders, highlighting its potential as a non-invasive and molecularly specific diagnostic tool.


Conflict of interest statement

Conflict of Interest

The authors declare no conflict of interest.

Figures
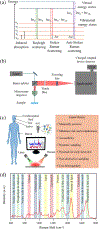
Fig. 1
Fig. 1
(a) Schematic representation of the energy level diagram of Raman scattering process. (b) Generic setup for a Raman microspectroscopy system (c) Illustrative diagram depicting the use of RS in analyzing liquid biopsy for the detection and diagnosis of brain disorders. (d) Raman spectra of human serum from a healthy donor highlighting the peak assignment for various metabolic groups and biomolecules.
Fig. 2
Fig. 2
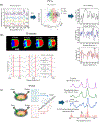
Energy level diagram showing (a) Raman scattering, SERS, and RRS and (b) SRS and CARS. Illustration of (c) TERS and (d) SERS. Illustration of working principle of (e) point scanning and (f) line scanning of Raman spectral imaging
Fig. 3
Fig. 3
(a) Using PCA to analyze SERS spectra measured from AD mice serum at different stages. PCA score plot for SERS measured spectra of AD mice serum at different stages. PCA loading plot of first three principal components. Adapted with permission from reference 121 Copyright 2023 Elsevier. (b) K-means cluster-based Raman mapping of lymphocyte cells with different numbers of clusters. Mean spectra of clusters with the number of clusters equal to 5. Adapted with permission from reference 122 Copyright 2013 SAGE Publications. (c) Using SVM to classify Raman spectra measured from mice brain samples with and without AD. Linear SVM trained, which classifies the brain samples with and without AD using a hyperplane decision boundary. The spectral feature importance obtained from SVM and Raman spectra of potential biomarkers of AD. Adapted with permission from reference 23 Copyright 2022 American Chemical Society.
Fig. 4
Fig. 4
(a) Raman spectra of platelets at different stages of AD from different 3xTg-AD transgenic rats. (b) The discriminant scores plot result of partial least square discriminant analysis (PLS-DA) algorithm related to 3xTg-AD transgenic rats. Adapted with permission from reference 65 Copyright 2022 Elsevier. (c,e) The visual display of first step and (d,f) second step of gaussian process (GP) classification of spectral data from 4 month AD and 12 month AD platelets, and the control data based on two features. Adapted with permission from reference 66 Copyright 2014 IOP Science.
Fig. 5
Fig. 5
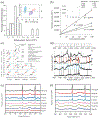
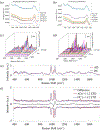
(a) Histogram of the measured electromagnetic enhancement factors of the SERS substrate. Inset: principal component score plots of PC1 and PC2 show the relationship between the multiplex spectra of the three single biomarkers. The blue cluster is N-acetylasparate (NAA) spectra (n = 23), the purple cluster represents S100B (n = 18) and the red is glial–fibrillary acidic protein (n = 13). (b) Calibration curves of SERS spectra acquired with an excitation laser of 785 nm. Inset: representative NAA levels as a function of SERS intensity for the dilution series and the calculated LOD values for each biomarker (inset table). (c) Classification matrices of the feature selection of subset of relevant features, used to establish the important peaks and their correlations reveals decision boundaries of multilayer perception with distribution of the selected peaks with clear separation at each subset between the STBI and the healthy volunteer patients. Inset: the NAA molecular structure and the major assignments of major SERS peaks of NAA on RED substrate. σ, stretching vibration; δ, bending vibration; δs, symmetric bending vibration; ρ, rocking, in-plane bending; γ, wagging; ν, breathing; τ, twisting. Raman intensity: s, strong; m, medium; w, weak. (d) Average SERS spectrum (n = 5) of healthy volunteers (i; bottom panel) excited at 785 nm are compared to the SERS spectrum of STBI only (ii), STBI + EC (iii) and to the fingerprint spectrum of NAA (iv; top panel) with the representative significant peaks highlighted with vertical grey (i), blue (ii), red (iii) and dotted (iv) lines, accordingly, highlighting the correspondence or the absence of the NAA peaks with some vibrational frequencies of the bands being unchanged in SERS spectra whereas several are red-shifted or not evident in the healthy volunteer spectrum. Inset: barcode derived from SERS spectra shown in e for severe traumatic brain injury (STBI) diagnostics. Adapted with permission from reference 71 Copyright 2020 Nature Publishing Group. (e) SERS spectra of PLFS acquired from the buffer solution containing various concentrations of S-100β (f) SERS spectra of PLFS taken at various concentrations of S-100β. Adapted with permission from reference 73 Copyright 2021 Elsevier.
Fig. 6
Fig. 6
(a) Average Raman spectra of the blood plasma of patients with AD (red; n = 35) and non-demented elderly controls (black; n = 29). (b) Average Raman optical activity spectra of the blood plasma of patients with AD (red; n = 35) and non-demented elderly controls (black; n = 29). Adapted with permission from reference 77 Copyright 2019 Elsevier. (c) Illustration of a simplified RS system and its potential application in clinical environments. Adapted with permission from reference 79 Copyright 2022 MDPI. (d) FDTD simulations at different settings showing the electromagnetic field distributions of the energized nanoarray on glass (i) and Au substrate (ii-iv). The distance between the two nanorod cylinders was 150 nm (i-iii) and 50 nm (iv). (e) SERS spectra of AD plasma samples before and after isolation treatment. (f) Difference spectra obtained from subtracting the AD sample spectra from the healthy control sample spectra. Adapted with permission from reference 80 Copyright 2021 Elsevier.
Fig. 7
Fig. 7
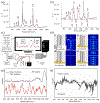
(a) Average Raman spectrum and (b) SERS spectra of serum from healthy control subjects (blue lines) and HD patients (red line) and standard deviations (c) and (d), respectively (e) The different spectra of the averages for Raman spectrum (black line) (f) The different spectra of the averages for SERS (black line). LD loadings are shown by colored lines and yellow marked regions indicate important peaks. Adapted with permission from reference 89 Copyright 2020 The Royal Society of Chemistry. (g) Concentration dependent SERS spectra from tau protein conjugated nanoplatform after magnetic separation of the nanocomposite. (h) SERS enhancement of Raman signal from 50 ng tau protein in the presence of CSNPs and from 500 ng tau protein in the presence of CSNPs attached graphene oxide hybrid. Adapted with permission from reference 91 Copyright 2015 American Chemical Society.
Fig. 8
Fig. 8
(a) Schematic representation of saliva preparation RS measurements, and machine learning data analysis. Adapted with permission from reference 97 Copyright 2021 Frontiers. (b) PD average signal, (c) AD average signal and (d) CTRL average signal. (e) Overlapped average spectra of the experimental groups. Adapted with permission from reference 104 Copyright 2020 Springer Nature
Fig. 9
Fig. 9
(a) Schematic representation of tear sample collection from ALS patients for Raman data acquisition and analysis (b) Overall performances of PLS-DA and xgbTree methods in the 900–1800 cm–1 spectral range (c) Comparison of the mean Raman spectra obtained by considering all the measured tears from ALS patients and healthy controls. The shadowed area refers to the standard deviation of the data. (d) Spectrally resolved differential average Raman spectra of the two investigated groups. Adapted with permission from reference 121. Copyright 2021 American Chemical Society. (e) SERS spectrum of tears from a healthy subject. (f) Spectrum of tear obtained by conventional RS in similar acquisition conditions. (g) Averaged SERS spectra of tear samples from healthy subjects (Ctr-green line), mild cognitive disease-affected subjects (MCI-blue line), and AD-affected subjects (AD-red line). The gray areas represent the standard deviation of the signal intensities within the considered data. (h) Signal differences concerning the control data of AD (red area) and MCI (blue area) spectrum. The green lines indicate the signal dispersion range (0.68 of the standard deviation). The statistically significant signal differences (p-value <0.05 in the one-way ANOVA statistics) are indicated by blue (MCI) and red (AD) marks, respectively. Adapted with permission from reference 122 Copyright 2020 SPIE.
Fig. 10
Fig. 10
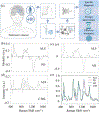
(a) Raman signature for samples of pure CSF and CSF with different volumes of Aβ scheme. (b) Raman signature for samples of pure CSF and CSF with different volumes of tau scheme. Adapted with permission from reference 125 Copyright 2023 Optica Publishing Group. (c) SERS signals in responses to tau protein of varying concentrations. (d) SERS signals in response to Aβ1−42 oligomers of varying concentrations. Adapted with permission from reference 124 Copyright 2019 American Chemical Society. (e) Mean Raman spectra of CSF from AD (red line) and healthy control (blue line) cohorts. (f) Difference spectrum (black line) and spectral variations around the mean (±2 standard deviations). Adapted with permission from reference 127 Copyright 2020 Elsevier.

References

    1. Payne TD, Moody AS, Wood AL, Pimiento PA, Elliott JC and Sharma B, Analyst, 2020, 145, 3461–3480. - PubMed
    1. Hrubešová K, Fousková M, Habartová L, Fišar Z, Jirák R, Raboch J. and SETNIčKA V, Clinical Biochemistry, 2019, 72, 39–51. - PubMed
    1. Paraskevaidi M, Martin-Hirsch PL and Martin FL, ACS chemical neuroscience, 2018, 9, 446–461. - PubMed
    1. Klamminger GG, Frauenknecht KB, Mittelbronn M. and Borgmann FBK, Free Neuropathology, 2022, 3. - PMC - PubMed
    1. Alzheimer’s Disease Facts and Figures, https://www.alz.org/media/Documents/alzheimers-facts-and-figures.pdf, (accessed 03/20/2024).

MeSH terms

LinkOut - more resources