. 2024 Apr 1;24(6):2300234.
doi: 10.1002/elsc.202300234. eCollection 2024 Jun.

Stable overexpression of native and artificial miRNAs for the production of differentially fucosylated antibodies in CHO cells

Affiliations

Stable overexpression of native and artificial miRNAs for the production of differentially fucosylated antibodies in CHO cells

Patrick Schlossbauer et al. Eng Life Sci. .

Abstract

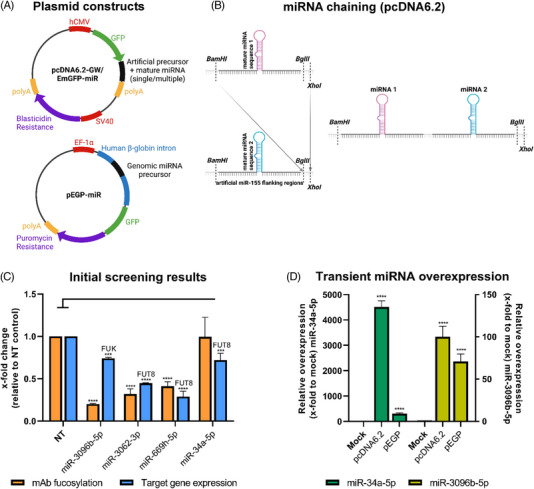
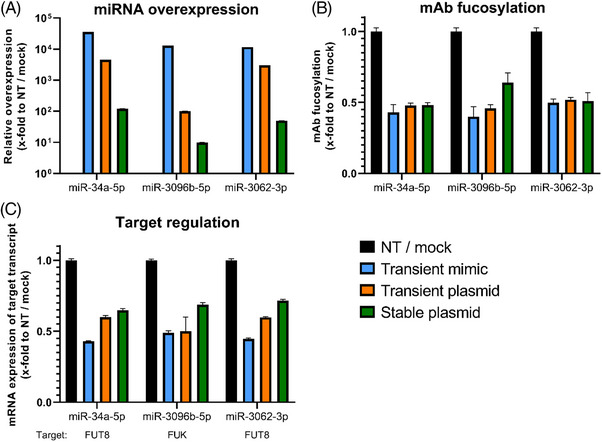
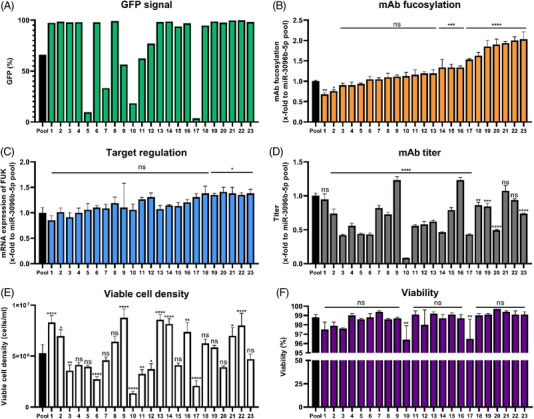
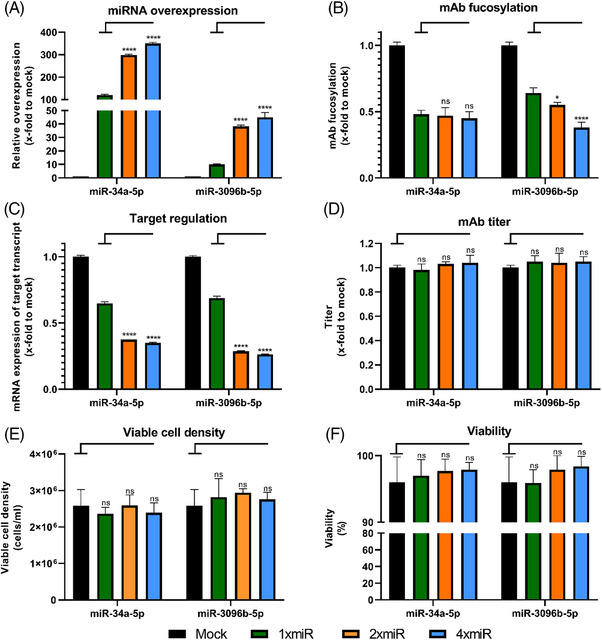
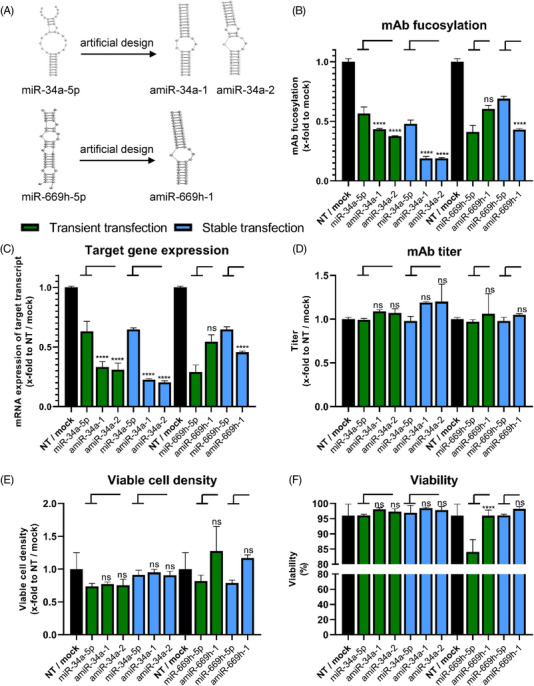
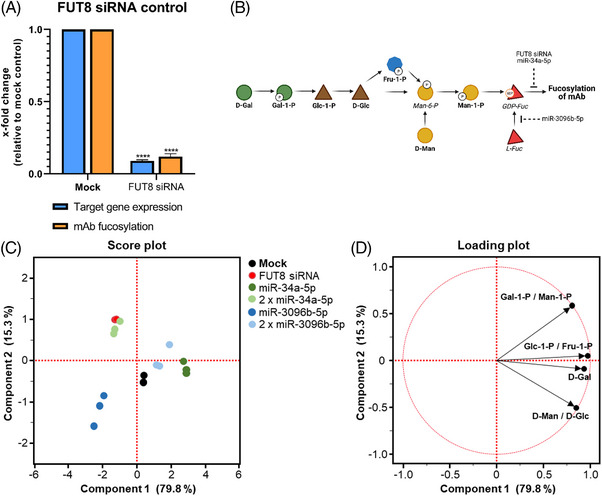
Cell engineering strategies typically rely on energy-consuming overexpression of genes or radical gene-knock out. Both strategies are not particularly convenient for the generation of slightly modulated phenotypes, as needed in biosimilar development of for example differentially fucosylated monoclonal antibodies (mAbs). Recently, transiently transfected small noncoding microRNAs (miRNAs), known to be regulators of entire gene networks, have emerged as potent fucosylation modulators in Chinese hamster ovary (CHO) production cells. Here, we demonstrate the applicability of stable miRNA overexpression in CHO production cells to adjust the fucosylation pattern of mAbs as a model phenotype. For this purpose, we applied a miRNA chaining strategy to achieve adjustability of fucosylation in stable cell pools. In addition, we were able to implement recently developed artificial miRNAs (amiRNAs) based on native miRNA sequences into a stable CHO expression system to even further fine-tune fucosylation regulation. Our results demonstrate the potential of miRNAs as a versatile tool to control mAb fucosylation in CHO production cells without adverse side effects on important process parameters.

Keywords: CHO; biopharmaceuticals; biosimilar; fucosylation engineering; microRNA.


Conflict of interest statement

The authors declare no conflicts of interest.

Figures

FIGURE 1
FIGURE 1
Plasmid system comparison for stable microRNA (miRNA) overexpression in Chinese hamster ovary (CHO) cells. (A) Schematic representation of the tested plasmid systems. The pcDNA6.2‐GW/EmGFP‐miR plasmid harbors a mature miRNA sequence of choice in miR‐155 flanking regions, which are located in the 3′untranslated region (3′UTR) of the green fluorescence protein (GFP). The pEGP‐miR plasmid incorporates a miRNA amplified with its genomic context from a reference genome into a human β‐globin intron in front of a GFP reporter. Created with BioRender.com. (B) Simplified schematic overview of the pcDNA6.2‐GW/EmGFP‐miR cloning system allowing chaining of multiple miRNAs of the same or different origin. A combination of BglII/XhoI restriction sites is used to obtain the backbone and BamHI/XhoI to obtain the insert sequence. Created with BioRender.com. (C) Previous results from our work [37] were used as a starting point for stable miRNA expression. Relative quantification of target mRNA expression (blue) 48 h after transient miRNA mimic transfection in comparison to nontargeting control siRNA (NT) transfection by quantitative reverse transcription polymerase chain reaction (qPCR) analysis. Analysis of mAb fucosylation in the supernatant (orange) 72 h after the same transfection compared to NT. Target genes are fucosyltransferase 8 (FUT8) for miR‐3062‐3p, miR‐669h‐5p and miR‐34a‐5p as well as fucokinase (FUK) for miR‐3096b‐5p. QPCR data are presented as calculated x‐fold change normalized to glyceraldehyde‐3‐phosphate dehydrogenase (GAPDH) housekeeping control and relative to NT (n = 3 biological replicates, mean ± SD). Data for mAb fucosylation is presented as calculated normalized relative shares for every glycoform (n = 3 biological replicates, mean + SD). (D) Comparison of mature miRNA overexpression after transient plasmid transfection of pcDNA6.2‐GW/EmGFP‐miR‐3096b‐5p, pcDNA6.2‐GW/EmGFP‐miR‐34a‐5p, pEGP‐miR‐3096b‐5p and pEGP‐miR‐34a‐5p into mAb producing CHO cells. MiRNA overexpression was assayed 48 h after transfection via qPCR. QPCR data are presented as calculated x‐fold change normalized to mmu‐U6‐snRNA housekeeping control and relative to mock (n = 3 biological replicates, mean ± SD). Significance was tested by ordinary one‐way ANOVA with Tukey's multiple comparisons test (**** = p ≤ 0.0001; ***: p ≤ 0.001; **: p ≤ 0.01; *: p ≤ 0.05; ns: p > 0.05).
FIGURE 2
FIGURE 2
Comparison of transient miRNA mimic transfection, transient plasmid transfection, and stable plasmid transfection in Chinese hamster ovary (CHO) cells for the three example miRNAs miR‐34a‐5p, miR‐3096b‐5p and miR‐3062‐3p. For all plasmid‐based transfections, the pcDNA6.2‐GW/EmGFP‐miR system was used. (A) Overexpression of mature miRNA. Transient miRNA mimic and plasmid transfection were assayed 48 h after transfection, stable plasmid transfection after cells completed antibiotic selection. Quantitative reverse transcription polymerase chain reaction (qPCR) data are presented as calculated x‐fold change normalized to mmu‐U6‐snRNA housekeeping control and relative to nontargeting control siRNA (NT) for miRNA mimics or mock for plasmid transfections (n = 3 biological replicates, mean ± SD). (B) Analysis of monoclonal antibody (mAb) fucosylation in the supernatant compared to NT or mock. Data for mAb fucosylation is presented as calculated normalized relative shares for every glycoform (n = 3 biological replicates, mean + SD). (C) Target regulation after transient transfection of miRNA mimics and plasmids or stable plasmid transfection assayed 48 h after transfection, or as soon as cells got stable. Target genes were fucosyltransferase 8 (FUT8) for miR‐34a‐5p and miR‐3062‐3p or fucokinase (FUK) for miR‐3096b‐5p. QPCR data are presented as calculated x‐fold change normalized to glyceraldehyde‐3‐phosphate dehydrogenase (GAPDH) housekeeping control and relative to NT or mock (n = 3 biological replicates, mean + SD). Significance was tested by ordinary one‐way ANOVA with Tukey's multiple comparisons test (**** = p ≤ 0.0001; ***: p ≤ 0.001; **: p ≤ 0.01; *: p ≤ 0.05; ns: p > 0.05).
FIGURE 3
FIGURE 3
Single cell cloning of stable miR‐3096b‐5p pool cloned in the pcDNA6.2‐GW/EmGFP‐miR. (A) Comparison of percentage of cells exhibiting green fluorescence protein (GFP) signal of 23 clonal cell lines to the cell pool assayed via flow cytometry. (B) Fucosylation of secreted monoclonal antibody (mAb). Data for mAb fucosylation are presented as calculated normalized relative shares for every glycoform and relative to the miR‐3096b‐5p expressing cell pool (n = 3 biological replicates, mean + SD). (C) Gene regulation of fucokinase (FUK) by miR‐3096b‐5p in all 23 clonal cell lines. Quantitative reverse transcription polymerase chain reaction (qPCR) data are presented as calculated x‐fold change normalized to glyceraldehyde‐3‐phosphate dehydrogenase (GAPDH) housekeeping control and relative to the miR‐3096b‐5p expressing cell pool (n = 3 biological replicates, mean + SD). (D) Titer analysis of single cell clones assayed via protein A chromatography in a 6‐day batch experiment relative to the miR‐3096b‐5p expressing cell pool (n = 3 biological replicates, mean + SD). (E) Viable cell density measured via trypan blue exclusion in a 6‐day batch experiment relative to the miR‐3096b‐5p expressing cell pool (n = 3 biological replicates, mean + SD). (F) Measurement of viability via trypan blue exclusion in a 6‐day batch experiment relative to the miR‐3096b‐5p expressing cell pool (n = 3 biological replicates, mean + SD). Significance was tested by ordinary one‐way ANOVA with Tukey's multiple comparisons test (**** = p ≤ 0.0001; ***: p ≤ 0.001; **: p ≤ 0.01; *: p ≤ 0.05; ns: p > 0.05).
FIGURE 4
FIGURE 4
Chaining of multiple miRNA copies using the pcDNA6.2‐GW/EmGFP‐miR‐34a‐5p or pcDNA6.2‐GW/EmGFP‐miR‐3096b‐5p plasmid to increase stably induced effects. Plasmids harboring 1, 2, or 4 copies of the respective miRNA were tested. (A) Level of mature miRNA in stably overexpressing Chinese hamster ovary (CHO) cell pools. QPCR data are presented as calculated x‐fold change normalized to mmu‐U6‐snRNA housekeeping control and relative to mock (n = 3 biological replicates, mean + SD). (B) Analysis of fucosylation on the secreted monoclonal antibody (mAb) via mass spectrometry. Data are presented as calculated normalized relative shares for every glycoform and relative to mock (n = 3 biological replicates, mean + SD). (C) Regulation of target genes fucosyltransferase 8 (FUT8) for miR‐34a‐5p or fucokinase (FUK) for miR‐3096b‐5p expressing cell pools assayed via qPCR. Data are presented as calculated x‐fold change normalized to glyceraldehyde‐3‐phosphate dehydrogenase (GAPDH) housekeeping control and relative to mock (n = 3 biological replicates, mean + SD). (D) Titer analysis of single and chained copy plasmids assayed via protein A chromatography in a 6‐day batch experiment relative to mock (n = 3 biological replicates, mean + SD). (E) Viable cell density was assayed via trypan blue exclusion in a 6‐day batch experiment and calculated relative to mock (n = 3 biological replicates, mean + SD). (F) Viability measurement via trypan blue exclusion in a 6‐day batch experiment relative to mock (n = 3 biological replicates, mean + SD). Significance was tested by ordinary one‐way ANOVA with Tukey's multiple comparisons test (**** = p ≤ 0.0001; ***: p ≤ 0.001; **: p ≤ 0.01; *: p ≤ 0.05; ns: p > 0.05).
FIGURE 5
FIGURE 5
Implementation of stable artificial miRNA (amiR/amiRNA) expression in Chinese hamster ovary (CHO) cells using the pcDNA6.2‐GW/EmGFP‐miR plasmid system. AmiRNAs for stable expression were chosen based on our recent results and data presented in green is based on these transient results [37] (A) Schematic representation of the (a)miRNA‐mRNA duplex for miR‐34a‐5p, amiR‐34a‐1, amiR‐34a‐2, miR‐669h‐5p and amiR‐669h‐1 and fucosyltransferase 8 (FUT8) from our previous results and their respective regulation on the fucosylation of a secreted monoclonal antibody (mAb) after transient transfection. Fucosylation data are presented as calculated normalized relative shares for every glycoform and relative to nontargeting control siRNA (NT) (n = 3 biological replicates, mean + SD). (B) Regulation of mAb fucosylation after transient mimic and stable plasmid transfection of amiRNAs and their native counterparts. Transient data were determined 72 h post transfection and stable data, as cell pools completed the antibiotic selection process. Data are presented as calculated normalized relative shares for every glycoform and relative to NT for mimic transfections or mock for stable integration (n = 3 biological replicates, mean + SD). (C) Regulation of the target genes fucosyltransferase 8 (FUT8) for miR‐34a‐5p, miR‐669h‐5p, and their artificial variants (amiRs) expressing cell pools and transient transfections of respective miRNA mimics assayed via quantitative reverse transcription polymerase chain reaction (qPCR). Data are presented as calculated x‐fold change normalized to glyceraldehyde‐3‐phosphate dehydrogenase (GAPDH) housekeeping control and relative to mock (n = 3 biological replicates, mean + SD). (D) Titer analysis of transiently transfected amiRNA mimics and their native counterparts 72 h post transfection and stable plasmid based integration in a 6‐day batch experiment. MAb Titer was measured via protein A chromatography relative to NT or mock (n = 3 biological replicates, mean + SD). (E) Viable cell density determined via trypan blue exclusion. For transient mimic transfection, cell density was determined 72 h post transfection, stable cell lines were assayed after a 6‐day batch experiment. X‐fold changes are calculated relative to NT or mock (n = 3 biological replicates, mean + SD). (F) Viability of CHO cells 72 h post transient transfection with amiRNAs and their native counterparts and during a 6‐day batch experiment of stably expressing cell pools. Viability is calculated relative to NT or mock (n = 3 biological replicates, mean + SD). Significance was tested by ordinary one‐way ANOVA with Tukey's multiple comparisons test (**** = p ≤ 0.0001; ***: p ≤ 0.001; **: p ≤ 0.01; *: p ≤ 0.05; ns: p > 0.05).
FIGURE 6
FIGURE 6
Metabolite analysis of selected stable cell pools. (A) Establishment of a positive control for metabolite analysis. A fucosyltransferase 8 targeting small interfering RNA (FUT8 siRNA) was stably expressed in Chinese hamster ovary (CHO) production cells. Fucosylation on the secreted monoclonal antibody (mAb) was measured via mass spectrometry. Data are presented as calculated normalized relative shares for every glycoform and relative to mock (n = 3 biological replicates, mean + SD). Regulation of the target gene FUT8 was assayed via quantitative reverse transcription polymerase chain reaction (qPCR). Data is presented as calculated x‐fold change normalized to glyceraldehyde‐3‐phosphate dehydrogenase (GAPDH) housekeeping control and relative to mock (n = 3 biological replicates, mean + SD). Significance was tested by ordinary one‐way ANOVA with Tukey's multiple comparisons test (**** = p ≤ 0.0001; ***: p ≤ 0.001; **: p ≤ 0.01; *: p ≤ 0.05; ns: p > 0.05). (B) Simplified representation of the interconversion of the analysed sugars and sugar phosphates in CHO production cells leading to mAb fucosylation. Bold names are metabolites, which are represented in the principal component analysis (PCA), italic names are metabolites shown for schematic overview that were not assayed in the metabolite analysis. Metabolites are as follows: D‐galactose (D‐Gal), galactose‐1‐phosphate (Gal‐1‐P), glucose‐1‐phosphate (Glc‐1‐P), D‐glucose (D‐Glc), fructose‐1‐phosphate (Fru‐1‐P), mannose‐6‐phosphate (Man‐6‐P), D‐mannose (D‐Man), mannose‐1‐phosphate (Man‐1‐P), GDP‐fucose (GDP‐Fuc). Created with BioRender.com. (C) Score plot of the PCA from the metabolite analysis in stably expressing CHO cell pools. (D) Loading plot from the PCA with the loading of the selected metabolites.

Similar articles

References

    1. Kim JY, Kim Y‐G, Lee GM. CHO cells in biotechnology for production of recombinant proteins: current state and further potential. Appl Microbiol Biotechnol. 2012;93:917‐930. doi:10.1007/s00253-011-3758-5 - DOI - PubMed
    1. Walsh G, Walsh E. Biopharmaceutical benchmarks 2022. Nat Biotechnol. 2022;40:1722‐1760. doi:10.1038/s41587-022-01582-x - DOI - PMC - PubMed
    1. Fischer S, Handrick R, Otte K. The art of CHO cell engineering: a comprehensive retrospect and future perspectives. Biotechnol Adv. 2015;33:1878‐1896. doi:10.1016/j.biotechadv.2015.10.015 - DOI - PubMed
    1. Edwards E, Livanos M, Krueger A, et al. Strategies to control therapeutic antibody glycosylation during bioprocessing: synthesis and separation. Biotechnol Bioeng. 2022;119:1343‐1358. doi:10.1002/bit.28066 - DOI - PMC - PubMed
    1. Yamane‐Ohnuki N, Kinoshita S, Inoue‐Urakubo M, et al. Establishment of FUT8 knockout Chinese hamster ovary cells: an ideal host cell line for producing completely defucosylated antibodies with enhanced antibody‐dependent cellular cytotoxicity. Biotechnol Bioeng. 2004;87:614‐622. doi:10.1002/bit.20151 - DOI - PubMed

LinkOut - more resources