

Quantifying functional group compositions of household fuel-burning emissions
- PMID: 38845819
- PMCID: PMC11151727
- DOI: 10.5194/amt-17-2401-2024
Quantifying functional group compositions of household fuel-burning emissions
Abstract
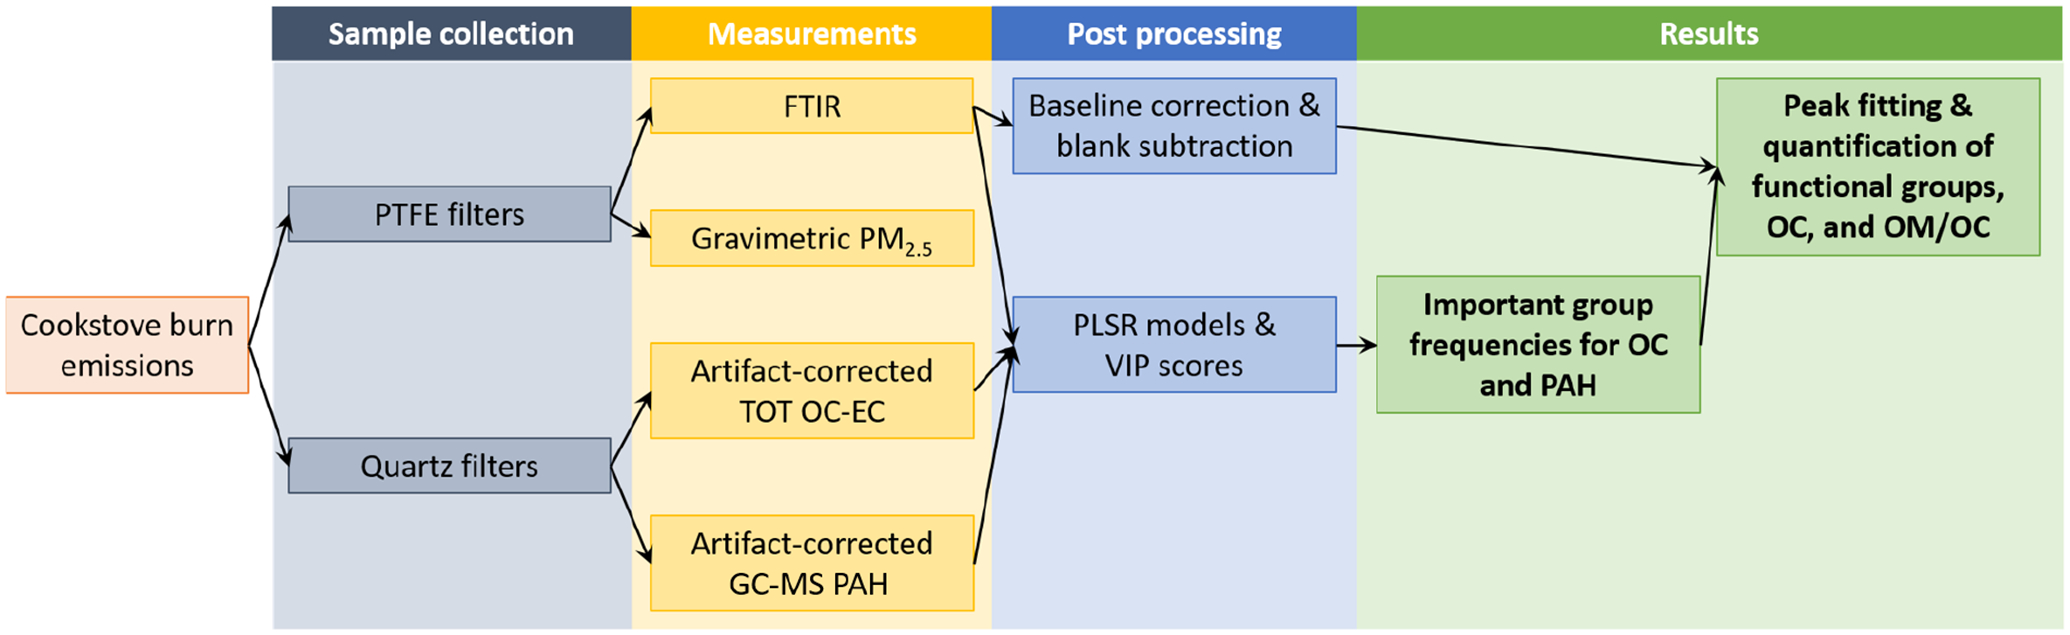
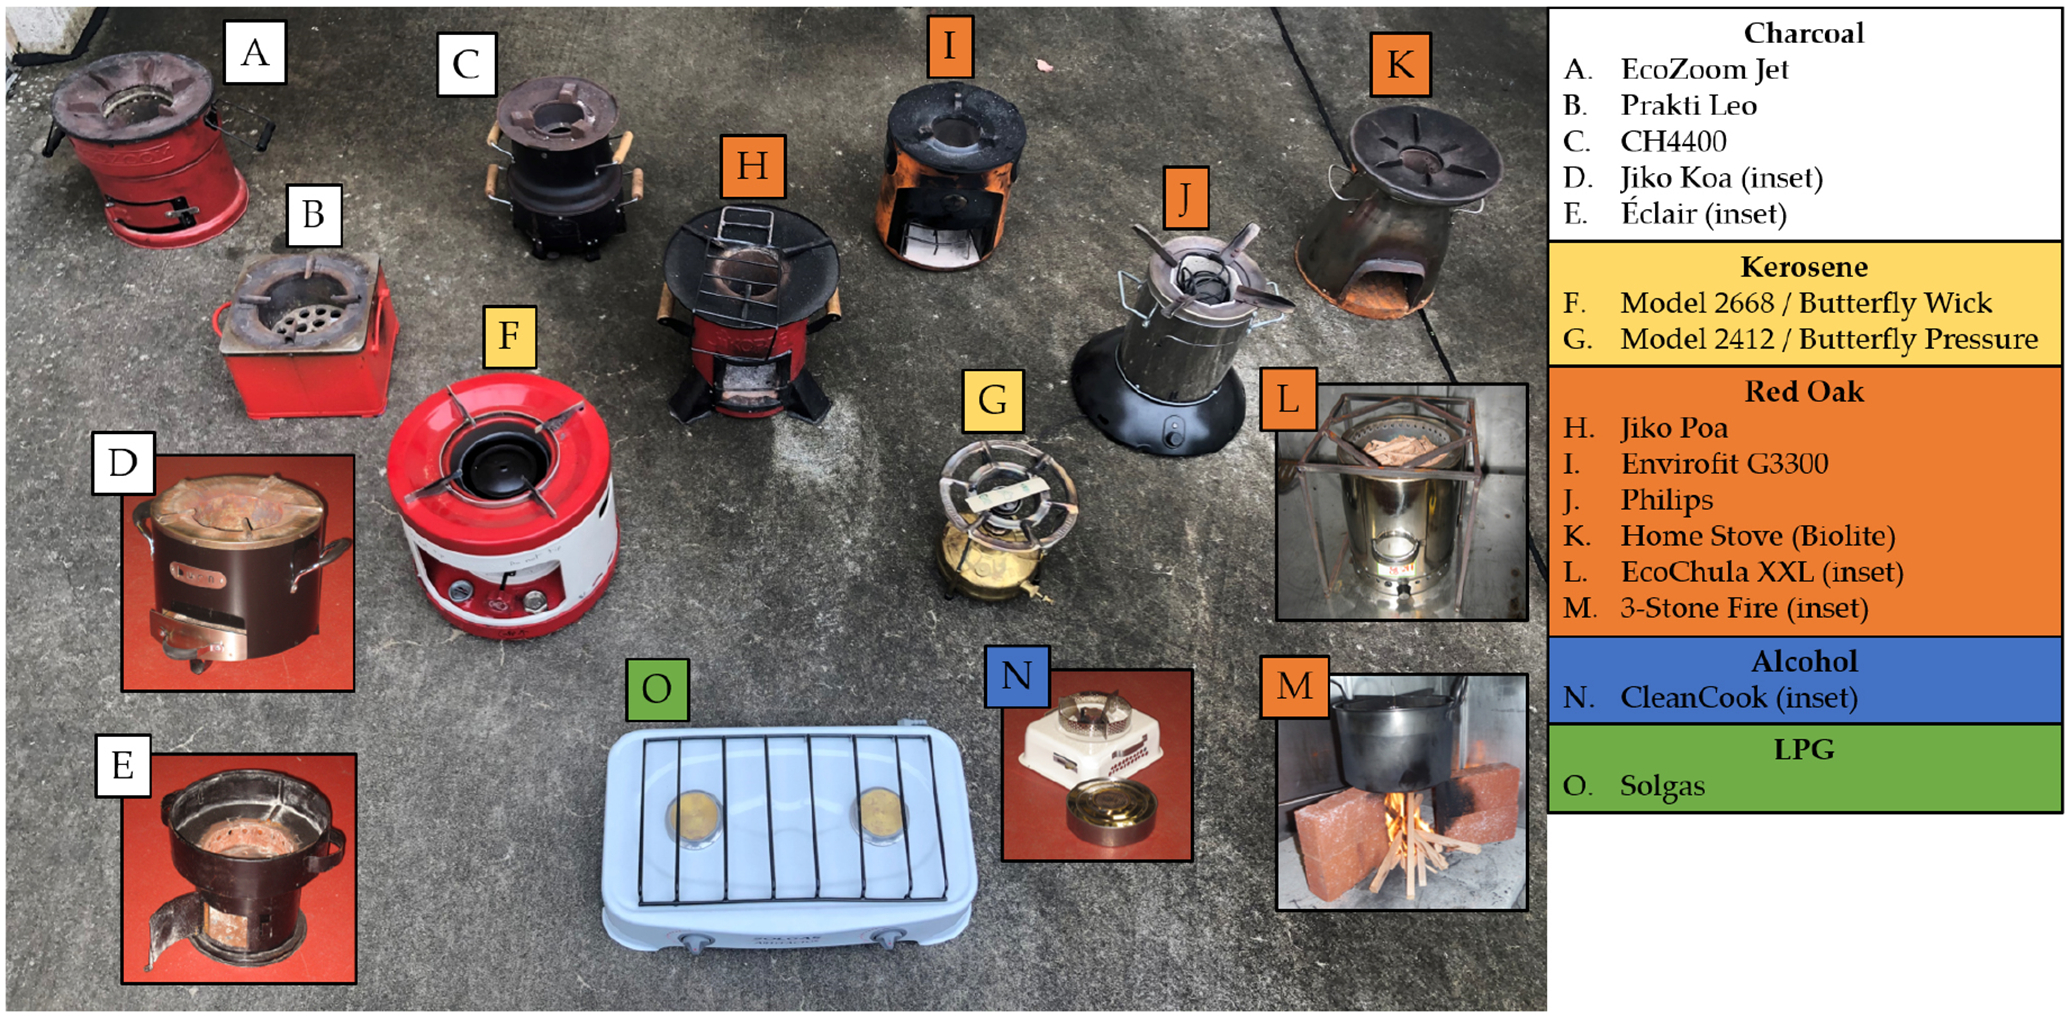
Globally, billions of people burn fuels indoors for cooking and heating, which contributes to millions of chronic illnesses and premature deaths annually. Additionally, residential burning contributes significantly to black carbon emissions, which have the highest global warming impacts after carbon dioxide and methane. In this study, we use Fourier transform infrared spectroscopy (FTIR) to analyze fine-particulate emissions collected on Teflon membrane filters from 15 cookstove types and 5 fuel types. Emissions from three fuel types (charcoal, kerosene, and red oak wood) were found to have enough FTIR spectral response for functional group (FG) analysis. We present distinct spectral profiles for particulate emissions of these three fuel types. We highlight the influential FGs constituting organic carbon (OC) using a multivariate statistical method and show that OC estimates by collocated FTIR and thermal-optical transmittance (TOT) are highly correlated, with a coefficient determination of 82.5 %. As FTIR analysis is fast and non-destructive and provides complementary FG information, the analysis method demonstrated herein can substantially reduce the need for thermal-optical measurements for source emissions.
Conflict of interest statement
Competing interests. The contact author has declared that none of the authors has any competing interests.
Figures


Similar articles
-
Light absorption of organic carbon emitted from burning wood, charcoal, and kerosene in household cookstoves.Environ Pollut. 2018 Sep;240:60-67. doi: 10.1016/j.envpol.2018.04.085. Epub 2018 May 3. Environ Pollut. 2018. PMID: 29729570 Free PMC article.
-
The 2023 Latin America report of the Lancet Countdown on health and climate change: the imperative for health-centred climate-resilient development.Lancet Reg Health Am. 2024 Apr 23;33:100746. doi: 10.1016/j.lana.2024.100746. eCollection 2024 May. Lancet Reg Health Am. 2024. PMID: 38800647 Free PMC article. Review.
-
Polycyclic Aromatic Hydrocarbons in Fine Particulate Matter Emitted from Burning Kerosene, Liquid Petroleum Gas, and Wood Fuels in Household Cookstoves.Energy Fuels. 2017;31(3):3081-3090. doi: 10.1021/acs.energyfuels.6b02641. Energy Fuels. 2017. PMID: 30245546 Free PMC article.
-
Pollutant emissions and energy efficiency under controlled conditions for household biomass cookstoves and implications for metrics useful in setting international test standards.Environ Sci Technol. 2012 Oct 2;46(19):10827-34. doi: 10.1021/es301693f. Epub 2012 Sep 17. Environ Sci Technol. 2012. PMID: 22924525
-
Black and organic carbon emission inventories: review and application to California.J Air Waste Manag Assoc. 2010 Apr;60(4):497-507. doi: 10.3155/1047-3289.60.4.497. J Air Waste Manag Assoc. 2010. PMID: 20437785 Review.
References
-
- Boeriu CG, Bravo D, Gosselink RJA, and van Dam JEG: Characterisation of Structure-Dependent Functional Properties of Lignin with Infrared Spectroscopy, Ind. Crops Prod, 20, 205–218, 10.1016/j.indcrop.2004.04.022, 2004. - DOI
-
- Bond TC, Doherty SJ, Fahey DW, Forster PM, Berntsen T, Deangelo BJ, Flanner MG, Ghan S, Kärcher B, Koch D, Kinne S, Kondo Y, Quinn PK, Sarofim MC, Schultz MG, Schulz M, Venkataraman C, Zhang H, Zhang S, Bellouin N, Guttikunda SK, Hopke PK, Jacobson MZ, Kaiser JW, Klimont Z, Lohmann U, Schwarz JP, Shindell D, Storelvmo T, Warren SG, and Zender CS: Bounding the Role of Black Carbon in the Climate System: A Scientific Assessment, J. Geophys. Res.-Atmos, 118, 5380–5552, 10.1002/jgrd.50171, 2013. - DOI
-
- Boris AJ, Takahama S, Weakley AT, Debus BM, Fredrickson CD, Esparza-Sanchez M, Burki C, Reggente M, Shaw SL, Edgerton ES, and Dillner AM: Quantifying organic matter and functional groups in particulate matter filter samples from the southeastern United States – Part 1: Methods, Atmos. Meas. Tech, 12, 5391–5415, 10.5194/amt-12-5391-2019, 2019. - DOI
-
- Bürki C, Reggente M, Dillner AM, Hand JL, Shaw SL, and Takahama S: Analysis of functional groups in atmospheric aerosols by infrared spectroscopy: method development for probabilistic modeling of organic carbon and organic matter concentrations, Atmos. Meas. Tech, 13, 1517–1538, 10.5194/amt-13-1517-2020, 2020. - DOI
Grants and funding
LinkOut - more resources
Full Text Sources
Research Materials