Low-Molecular-Weight PEGs for Cryopreservation of Stem Cell Spheroids
- PMID: 38845843
- PMCID: PMC11156479
- DOI: 10.34133/bmr.0037
Low-Molecular-Weight PEGs for Cryopreservation of Stem Cell Spheroids
Abstract
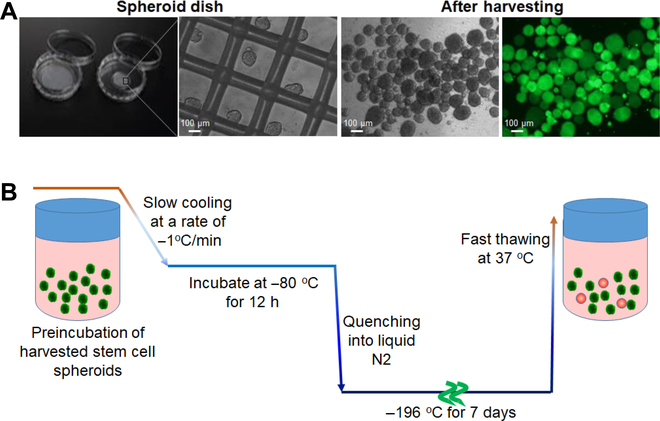
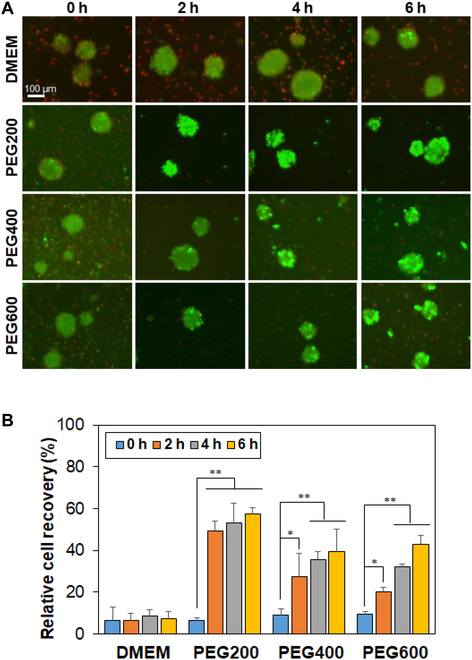
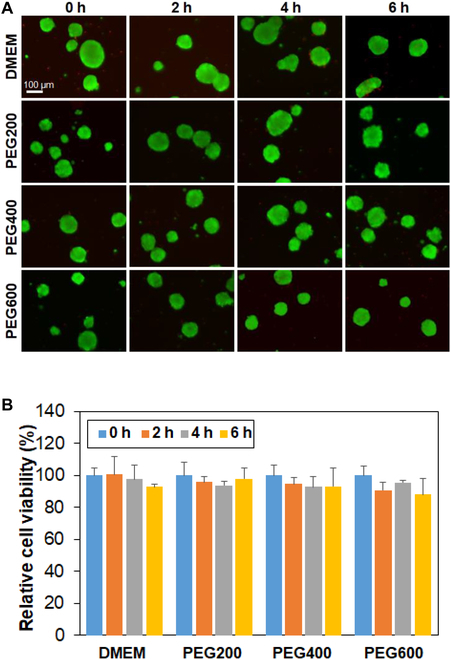
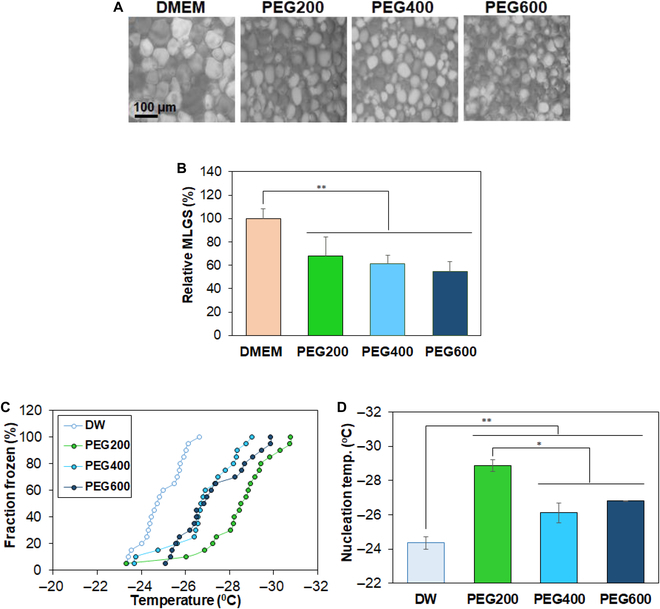
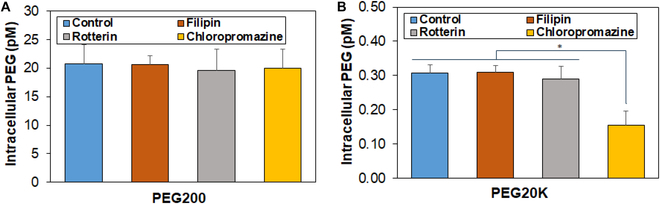
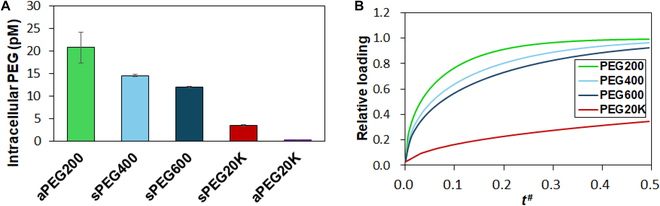
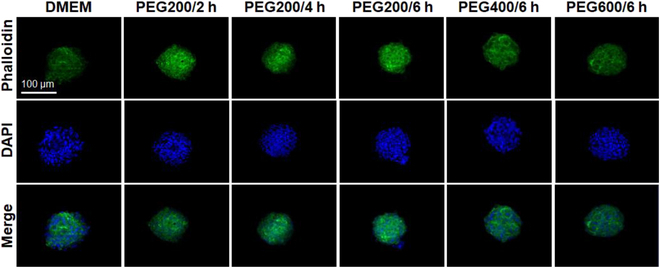
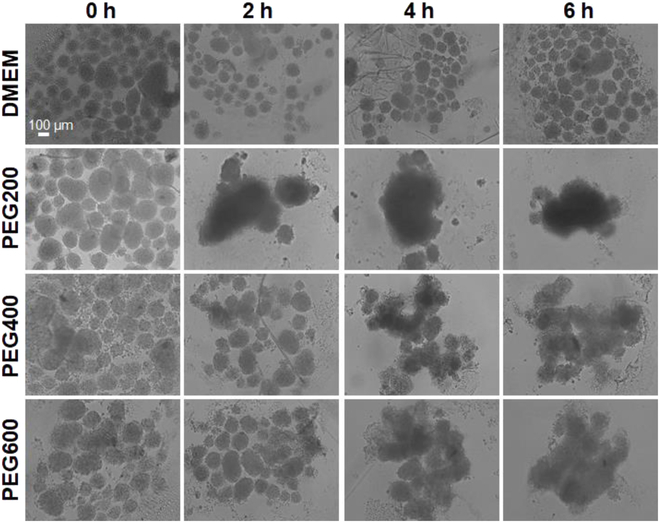
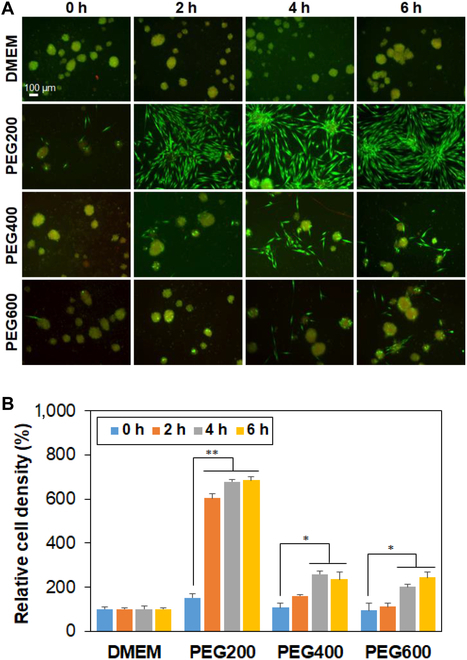
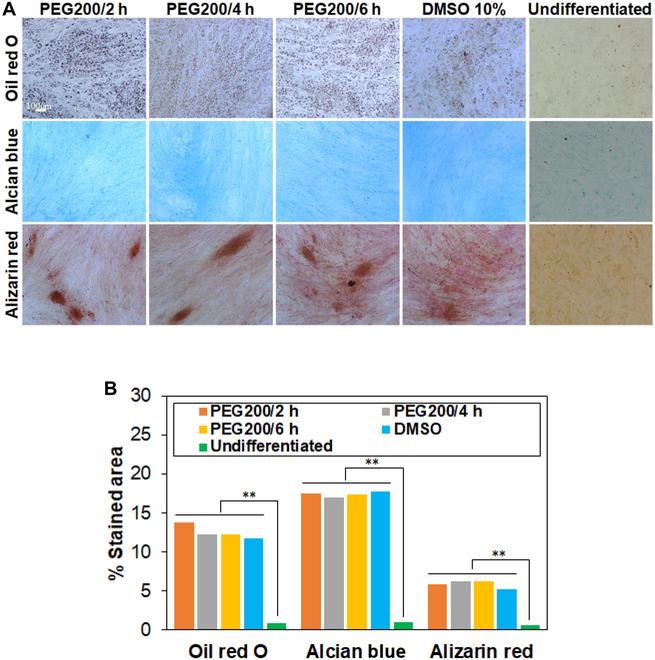
Stem cell spheroids (SCSs) are a valuable tool in stem cell research and regenerative medicine. SCSs provide a platform for stem cell behavior in a more biologically relevant context with enhanced cell-cell communications. In this study, we investigated the recovery of SCSs after cryopreservation at -196 °C for 7 days. Prior to cryopreservation, the SCSs were preincubated for 0 h (no preincubation), 2 h, 4 h, and 6 h at 37 °C in the presence of low-molecular-weight poly(ethylene glycol) (PEG) with molecular weights of 200, 400, and 600 Da. The recovery rate of SCSs was markedly affected by both the PEG molecular weight and the preincubation time. Specifically, when SCSs were preincubated with a PEG200 solution for 2 to 6 h, it significantly enhanced the recovery rate of the SCSs. Internalization of PEG200 through simple diffusion into the SCSs may be the cryoprotective mechanism. The PEG200 diffuses into the SCSs, which not only suppresses osmotic pressure development inside the cell but also inhibits ice formation. The recovered SCSs demonstrated both fusibility and capabilities for proliferation and differentiation comparable to SCSs recovered after dimethyl sulfoxide 10% cryopreservation. This study indicates that PEG200 serves as an effective cryoprotectant for SCSs. A simple preincubation procedure in the presence of the polymer greatly improves the recovery rate of SCSs from cryopreservation.
Copyright © 2024 Madhumita Patel et al.
Conflict of interest statement
Competing interests: The authors declare that they have no competing interests.
Figures
Similar articles
-
Rediscovery of poly(ethylene glycol)s as a cryoprotectant for mesenchymal stem cells.Biomater Res. 2023 Feb 20;27(1):17. doi: 10.1186/s40824-023-00356-z. Biomater Res. 2023. PMID: 36803669 Free PMC article.
-
Poly(l-alanine-co-l-lysine)-g-Trehalose as a Biomimetic Cryoprotectant for Stem Cells.Biomacromolecules. 2022 May 9;23(5):1995-2006. doi: 10.1021/acs.biomac.1c01701. Epub 2022 Apr 12. Biomacromolecules. 2022. PMID: 35412815
-
Size and Shape Control of Ice Crystals by Amphiphilic Block Copolymers and Their Implication in the Cryoprotection of Mesenchymal Stem Cells.ACS Appl Mater Interfaces. 2021 Jul 28;13(29):33969-33980. doi: 10.1021/acsami.1c09933. Epub 2021 Jul 18. ACS Appl Mater Interfaces. 2021. PMID: 34275265
-
Video analysis of osmotic cell response during cryopreservation.Cryobiology. 2012 Jun;64(3):250-60. doi: 10.1016/j.cryobiol.2012.02.008. Epub 2012 Feb 16. Cryobiology. 2012. PMID: 22342926
-
Cryopreservation of mouse spermatogonial stem cells in dimethylsulfoxide and polyethylene glycol.Biol Reprod. 2013 Nov 7;89(5):109. doi: 10.1095/biolreprod.113.111195. Print 2013 Nov. Biol Reprod. 2013. PMID: 24025741
Cited by
-
Smart Biomaterials for Delivery of Drugs and Cells.Biomater Res. 2025 Jul 31;29:0227. doi: 10.34133/bmr.0227. eCollection 2025. Biomater Res. 2025. PMID: 40746977 Free PMC article. No abstract available.
-
Advances in Cryopreservation Strategies for 3D Biofabricated Constructs: From Hydrogels to Bioprinted Tissues.Int J Mol Sci. 2025 Jul 18;26(14):6908. doi: 10.3390/ijms26146908. Int J Mol Sci. 2025. PMID: 40725153 Free PMC article. Review.
-
Atomistic Insights into the Chain-Length-Dependent Antifreeze Activity of Oligoprolines.Biomacromolecules. 2025 Aug 11;26(8):4886-4897. doi: 10.1021/acs.biomac.5c00324. Epub 2025 Jul 29. Biomacromolecules. 2025. PMID: 40727956 Free PMC article.
-
High-Quality Three-Dimensionally Cultured Cells Using Interfaces of Diblock Copolymers Containing Different Ratios of Zwitterionic N-Oxides.ACS Appl Mater Interfaces. 2024 Aug 28;16(34):44575-44589. doi: 10.1021/acsami.4c10118. Epub 2024 Aug 19. ACS Appl Mater Interfaces. 2024. PMID: 39160767 Free PMC article.
References
-
- Ko DY, Patel M, Lee HJ, Jeong B. Coordinating thermogel for stem cell spheroids and their cyto-effectiveness. Adv Funct Mater. 2018;28(7):1706286.
-
- Kim SJ, Kim EM, Yamamoto M, Park H, Shin H. Engineering multi-cellular spheroids for tissue engineering and regenerative medicine. Adv Healthc Mater. 2020;9:e2000608. - PubMed
-
- Friedrich J, Seidel C, Ebner R, Kunz-Schughart LA. Spheroid-based drug screen: Considerations and practical approach. Nat Protoc. 2009;4(3):309–324. - PubMed
LinkOut - more resources
Full Text Sources