. 2024 May 23:15:1416253.
doi: 10.3389/fpls.2024.1416253. eCollection 2024.

Exploring the comparative genome of rice pathogen Burkholderia plantarii: unveiling virulence, fitness traits, and a potential type III secretion system effector

Affiliations

Exploring the comparative genome of rice pathogen Burkholderia plantarii: unveiling virulence, fitness traits, and a potential type III secretion system effector

Mohamed Mannaa et al. Front Plant Sci. .

Abstract

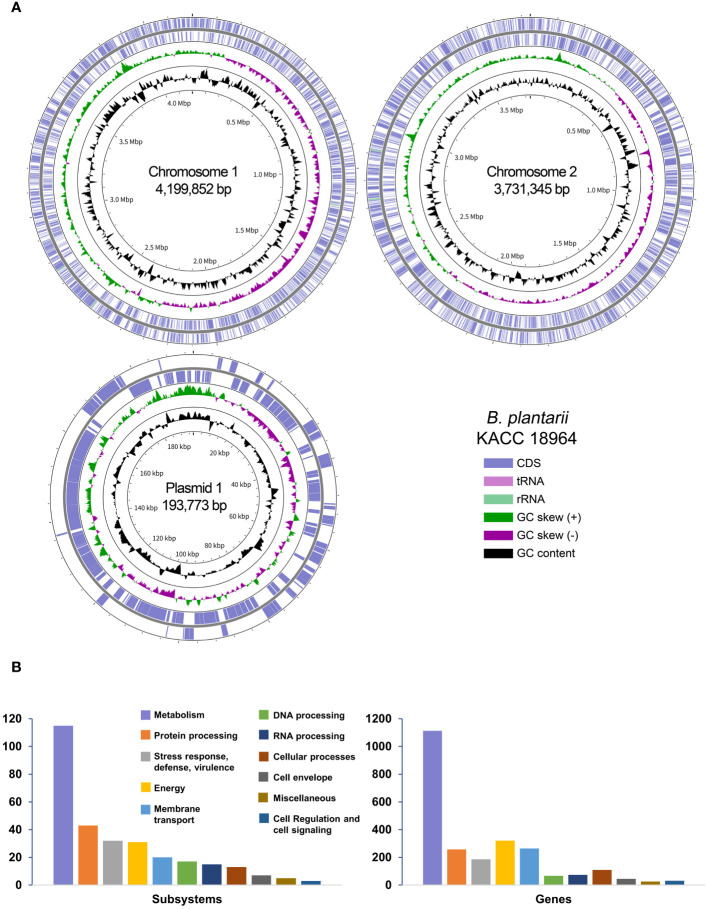
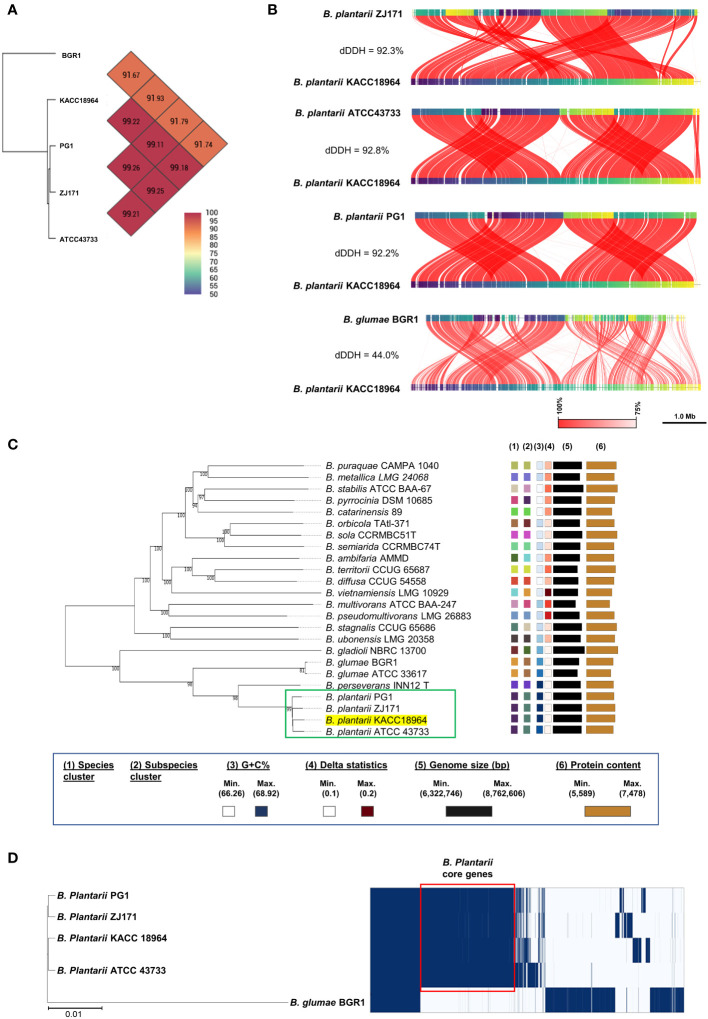
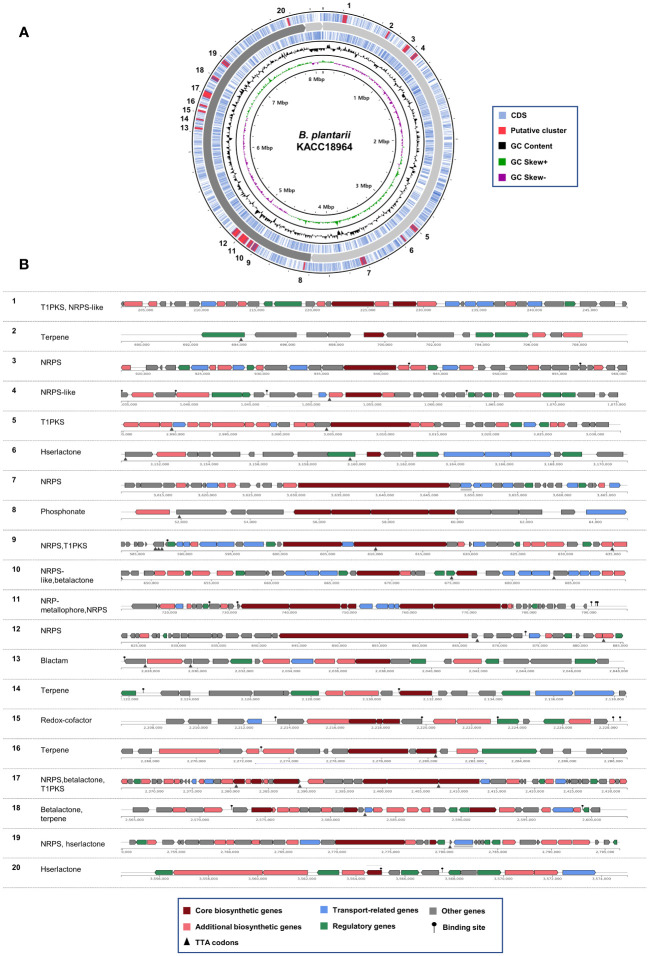
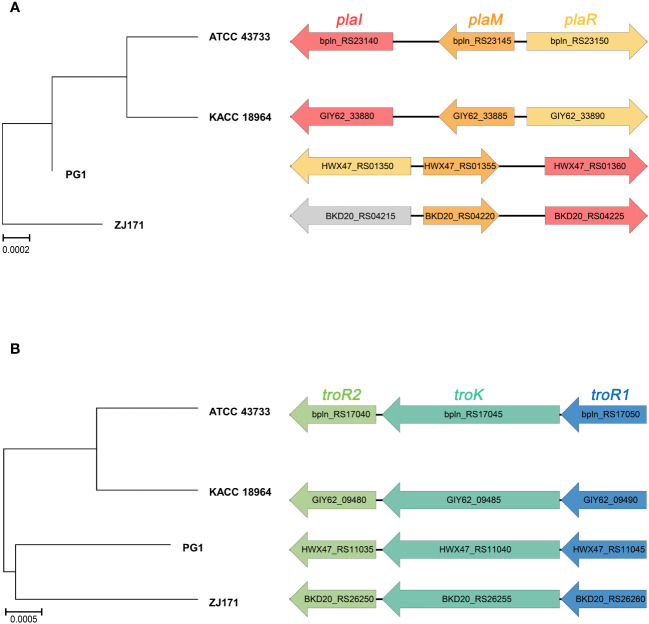
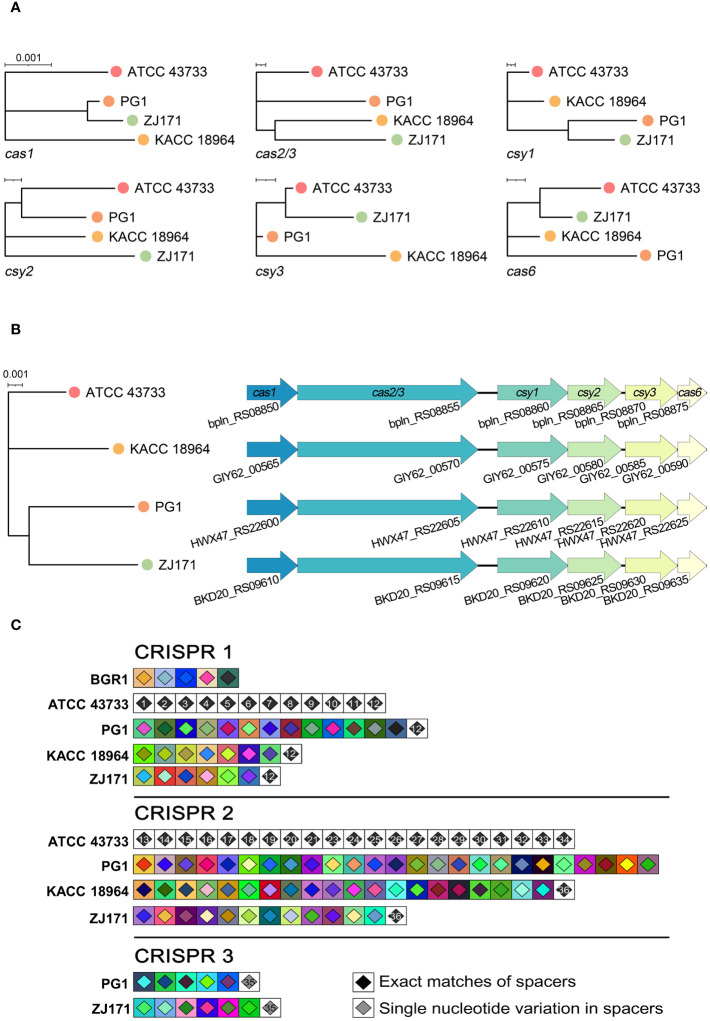
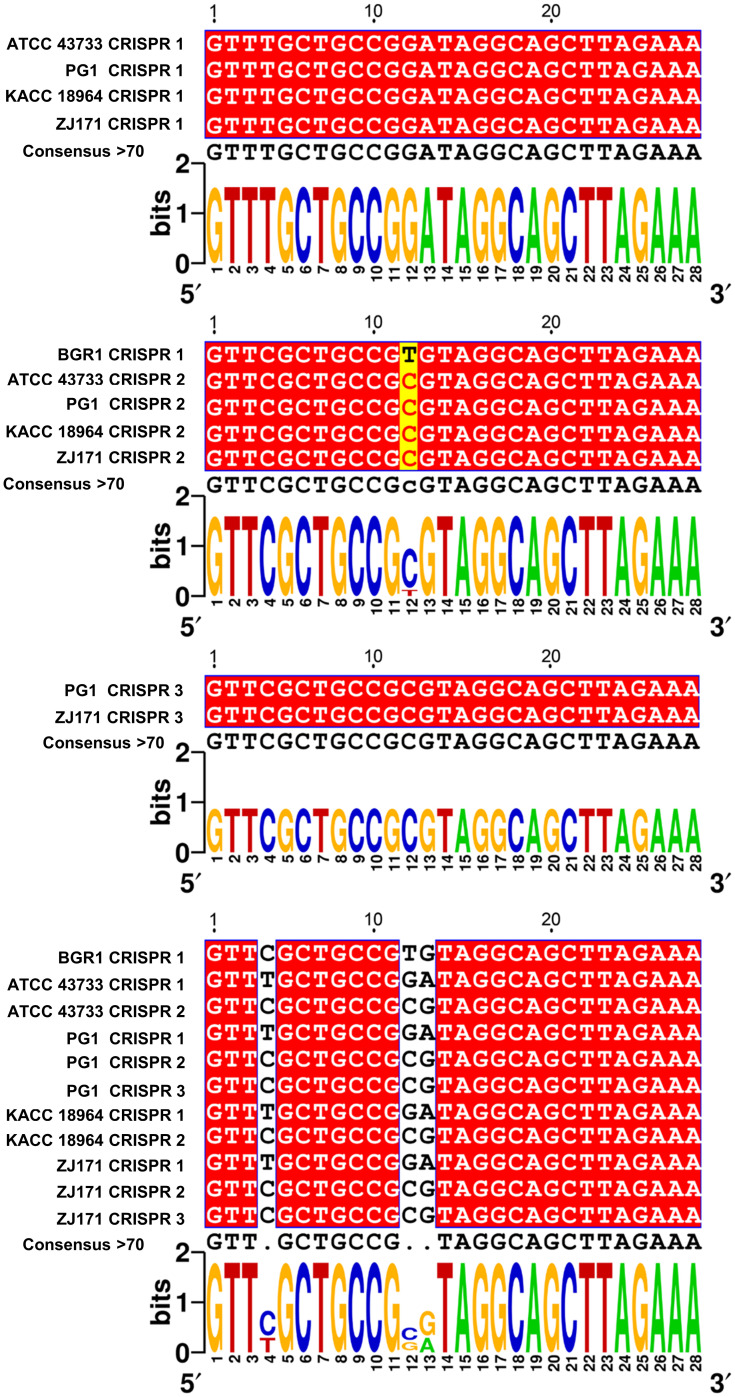
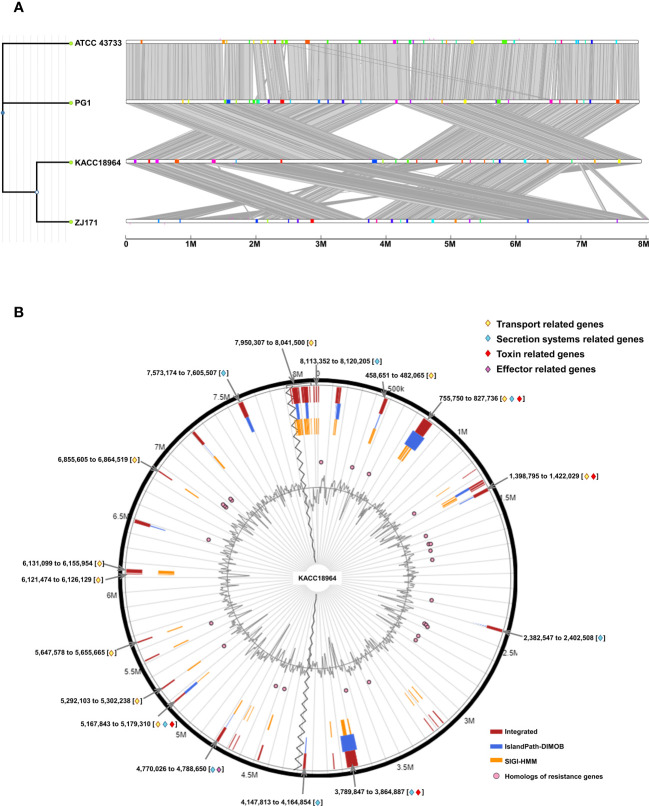
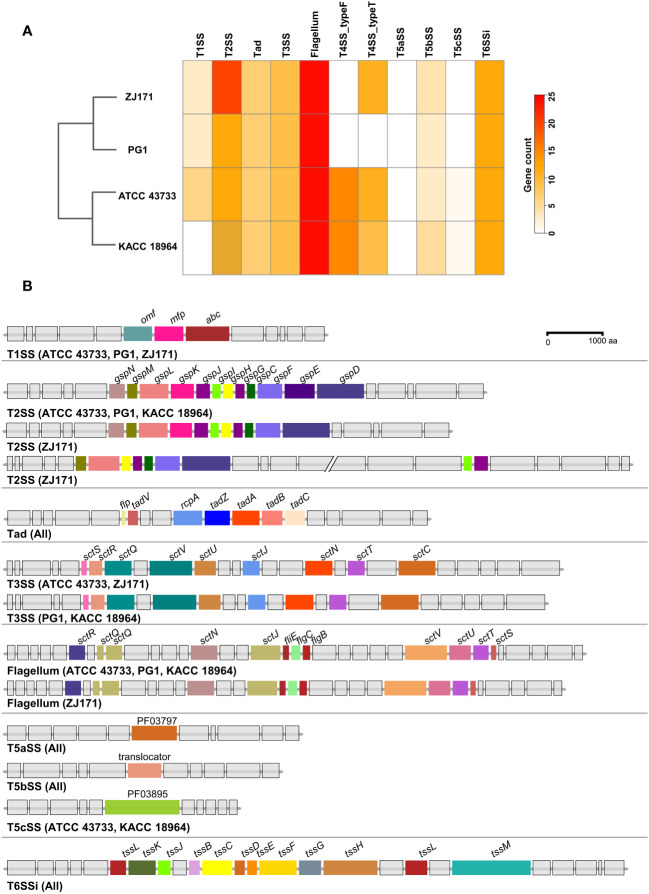
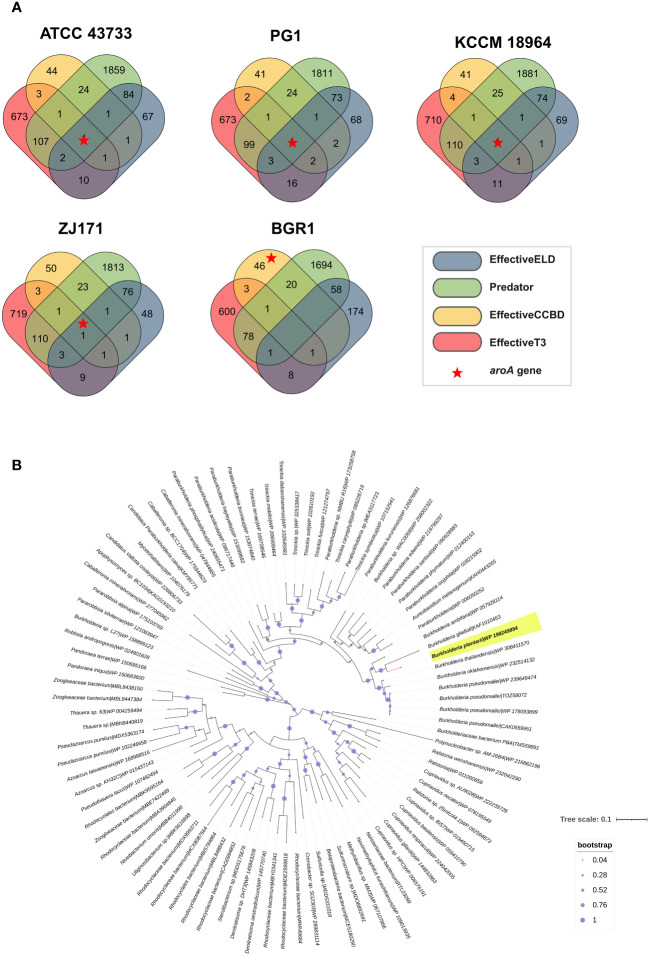
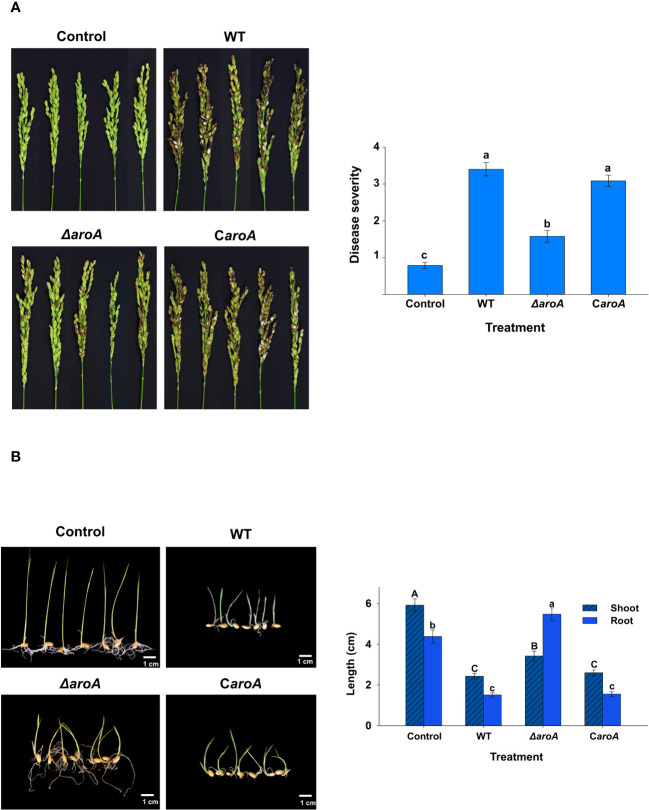
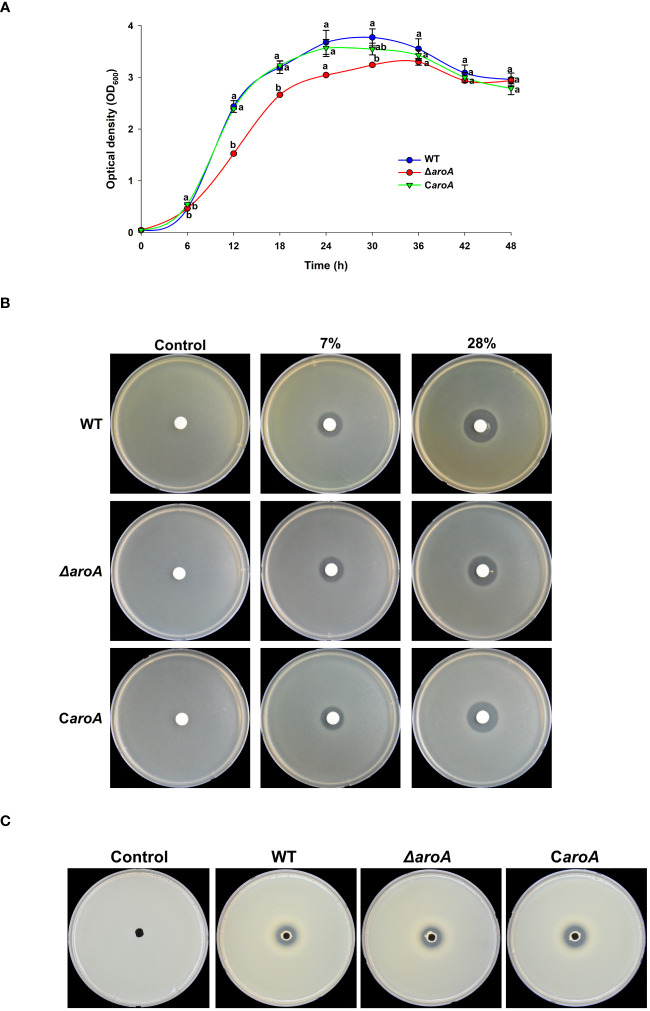
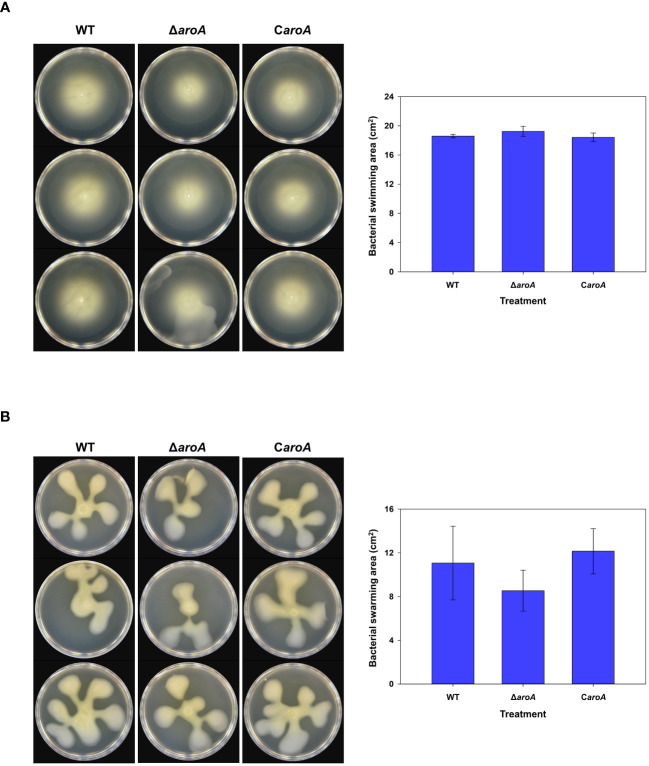
This study presents a comprehensive genomic analysis of Burkholderia plantarii, a rice pathogen that causes blight and grain rot in seedlings. The entire genome of B. plantarii KACC 18964 was sequenced, followed by a comparative genomic analysis with other available genomes to gain insights into its virulence, fitness, and interactions with rice. Multiple secondary metabolite gene clusters were identified. Among these, 12 demonstrated varying similarity levels to known clusters linked to bioactive compounds, whereas eight exhibited no similarity, indicating B. plantarii as a source of potentially novel secondary metabolites. Notably, the genes responsible for tropolone and quorum sensing were conserved across the examined genomes. Additionally, B. plantarii was observed to possess three complete CRISPR systems and a range of secretion systems, exhibiting minor variations among the analyzed genomes. Genomic islands were analyzed across the four genomes, and a detailed study of the B. plantarii KACC 18964 genome revealed 59 unique islands. These islands were thoroughly investigated for their gene contents and potential roles in virulence. Particular attention has been devoted to the Type III secretion system (T3SS), a crucial virulence factor. An in silico analysis of potential T3SS effectors identified a conserved gene, aroA. Further mutational studies, in planta and in vitro analyses validated the association between aroA and virulence in rice. Overall, this study enriches our understanding of the genomic basis of B. plantarii pathogenicity and emphasizes the potential role of aroA in virulence. This understanding may guide the development of effective disease management strategies.

Keywords: genome analysis; rice pathogenic bacteria; secondary metabolites; type III secretion system; virulence.


Conflict of interest statement

The authors declare that the research was conducted in the absence of any commercial or financial relationships that could be construed as a potential conflict of interest. The author(s) declared that they were an editorial board member of Frontiers, at the time of submission. This had no impact on the peer review process and the final decision.

Figures

Figure 1
Figure 1
(A) A Circular representation of the complete genome of Burkholderia plantarii strain KACC 18964. The key in the bottom-right corner illustrates the individual circles in a top-down outermost to innermost direction. (B) The subsystem categories of the B. plantarii KACC 18964 genome showing the distribution of the numbers of detected subsystems and genes with assigned functions.
Figure 2
Figure 2
Comparative genomic analysis of B. plantarii KACC 18964 with other B. plantarii strains (ATCC 43733, PG1, and ZJ171) and B. glumae BGR1 as a congeneric control for differentiation. (A) Pairwise comparison of average nucleotide identity (ANI) among KACC 18964, the other B. plantarii strains (ATCC 43733, PG1, and ZJ171), and B. glumae BGR1. (B) Whole genome alignment illustrating the differences in digital DNA-DNA hybridization (dDDH) among KACC 18964, the other B. plantarii strains (ATCC 43733, PG1, and ZJ171), and B. glumae BGR1. The ANI and dDDH% values were found to be consistent with the proposed and widely accepted species boundary thresholds of 95–96% and 70%, respectively. (C) Phylogenomic tree constructed using TYGS (https://tygs.dsmz.de/), inferred with FastME 2.1.6.1, based on genome GBDP distances calculated from the whole genome sequences of B. plantarii-related species. The branch lengths are scaled using the GBDP formula d5, with an average branch support of 99.8%. The tree is rooted at the midpoint. (D) Matrix of presence/absence genes generated using Roary software, accompanied by the maximum-likelihood phylogenetic tree of B. plantarii strains (KCCM 18964, ATCC 43733, PG1, and ZJ171) and B. glumae BGR1. Blue bars indicate the presence of specific genes across the panel, with genes shared among all B. plantarii strains outlined in red (core genome).
Figure 3
Figure 3
Predicted secondary metabolite gene clusters in B. plantarii KACC Identified by antiSMASH (version 7). (A) A circular representation of the whole genome indicating the locations of the detected secondary metabolite gene clusters. (B) Organization of gene clusters and the predicted classes of secondary metabolites. The secondary metabolite types are abbreviated as follows: T1PKS, Type I PKS (Polyketide synthase); NRPS-like, Non-ribosomal peptide synthetase-like fragment; NRPS, Non-ribosomal peptide synthetase; hserlactone, Homoserine lactone; beta lactone, Beta-lactone containing protease inhibitor; NRP-metallophore, Non-ribosomal peptide metallophores; lactam, β-lactam; redox-cofactor, Redox-cofactors such as PQQ (NC_021985:1458906–1494876).
Figure 4
Figure 4
Comparison of gene cluster organization and phylogenetic tree based on sequence relatedness of (A) quorum sensing system and (B) tropolone biosynthesis genes among Burkholderia plantarii strains (ATCC 43733, KCCM 18964, PG1, and ZJ171).
Figure 5
Figure 5
Comparative analysis of Cas genes and CRISPR spacers within the genomes of B. plantarii strains (ATCC 43733, KCCM 18964, PG1, and ZJ171). (A) Phylogenetic analysis based on sequence relatedness of the six detected Cas genes within the CRISPR systems. (B) Organization of Cas genes and phylogenetic analysis of the concatenated Cas genes in B. plantarii strains. (C) CRISPRStudio alignment of the arrays for three CRISPR systems, illustrating the schematic representation of spacer genes within the genomes of B. plantarii strains and B. glumae BGR1. The analysis reveals the absence of shared spacers between B. glumae BGR1 and B. plantarii strains, while all the spacers of CRISPR system 1 are common among the B. plantarii strains.
Figure 6
Figure 6
Multiple alignment of CRISPR 1–3 repeats in B. plantarii strains (ATCC 43733, KCCM 18964, PG1, and ZJ171) and B. glumae BGR1, and Weblogo analysis highlighting sequence variations and conservation among the examined strains. Multiple CRISPR systems were identified in B. plantarii strains, with most strains having two systems. However, strains PG1 and ZJ171 exhibited three CRISPR systems. In B. glumae BGR1, CRISPR 1 system repeats were detected, and their sequence showed a high similarity to CRISPR 2 in B. plantarii. Notably, a discrepancy was observed at the 12th sequence position, where T was present instead of C.
Figure 7
Figure 7
(A) Comparative visualization of the four Burkholderia plantarii genomes, generated using IslandCompare, highlights the genomic islands (GIs) and antimicrobial gene determinants. A phylogenetic tree, positioned on the upper left, elucidates the evolutionary relationships among the strains. Genomic islands (GIs) are represented as color-coded blocks aligned along the linear genome maps, (B). Distribution of predicted GIs in the B. plantarii KACC18964 genome, as analyzed by IslandViewer 4. The circular map marks the GIs with a color-coding scheme that reflects various predictive criteria. The figure captures the genomic complexity and identifies potential hotspots for gene exchange that could influence the bacterial pathogenicity and environmental adaptation. Regions associated with potential features relevant to bacterial virulence and fitness are notably highlighted, including those containing genes related to transport, toxins, and secretion. Labels indicating the start and end points of the GIs facilitate an understanding of their genomic context.
Figure 8
Figure 8
Comparison of secretion system gene clusters within the genomes of B. plantarii strains (ATCC 43733, KCCM 18964, PG1, and ZJ171). (A) A heatmap showing the number of genes identified within the detected secretion systems. (B) Comparative analysis of gene clusters from different detected secretion systems among B. plantarii strains. The type I secretion system was present in all four strains. Strain ZJ171 exhibited an additional Type II secretion system cluster. The type III secretion system showed slight variations between ATCC 43733 and ZJ171, as well as KCCM 18964 and PG1. The type IV secretion system differed among the strains, and PG1 lacked this gene cluster. The type VI secretion system exhibited the same structure and configuration across all four tested strains.
Figure 9
Figure 9
Analysis of effectors from the type III secretion system in B. plantarii strains (ATCC 43733, KCCM 18964, PG1, and ZJ171). and B. glumae BGR1. (A) Venn diagram demonstrating the analysis of effector genes using four different system criteria (EffectiveELD, Predator, EffectiveCCBD, and EffectiveT3). The number of detected effector genes is shown, with only one gene (highlighted as a red star) found in all analyses. This gene was also detected in B. glumae using the EffectiveCCBD criteria. (B) Phylogenetic tree generated using the maximum likelihood method with 1000 bootstrap replications, highlighting the evolutionary relationship of the aroA from Burkholderia plantarii (highlighted in yellow) against a backdrop of homologous sequences. Sequences were retrieved following a BLASTp search against the clustered non-redundant (nr) protein database of the NCBI, where each sequence is clustered at 90% identity and coverage. The representative sequence for each cluster is indicated, providing a compact result with increased taxonomic depth. The bootstrap values are represented by the size of the nodes, with larger nodes indicating higher support for the clade. The tree scale indicates the number of substitutions per site.
Figure 10
Figure 10
In planta assays for evaluation of the disease severity between the wild-type B. plantarii KACC18964, the mutant (ΔaroA), and the complemented strain (CaroA) (A) Disease severity in rice plants 10 d post-inoculation. Photographs depicting the variation in blight symptoms between the treatments. The bar graph on the right side illustrating the disease severity results in inoculated rice plants. Different letters on the error bars (Standard error, n = 5) indicate significant differences between the treatments, according to the least significant difference test at P < 0.05. A sterilized 1 mM MgSO4 solution was used as the negative control. (B) Rice seedling growth and disease severity post-inoculation. Photographs displaying the seedlings post-treatment with respective bacterial strains or control. The bar graph on the right side are showing the quantified shoot and root lengths. Seedlings treated with the ΔaroA deletion mutant exhibit less disease severity and greater shoot and root growth compared to those inoculated with the wild type, whereas complementation of the aroA mutant restores virulence to levels comparable to the wild type. Control seedlings treated with sterilized 1 mM MgSO4 showed no disease symptoms nor growth impairment, indicating healthy development. Different uppercase and lowercase letters on the error bars (standard error; n=30), indicate significant differences according to the LSD test at P < 0.05 for the shoot and root length, respectively.
Figure 11
Figure 11
Comparative analysis of growth, oxidative stress tolerance, and protease activity in Burkholderia plantarii wild-type KACC18964, the mutant (ΔaroA), and the complemented strain (CaroA). (A) Growth curves for the WT, ΔaroA, and CaroA strains, indicating the optical density (OD600) measurements over 6-h intervals. Different letters above the error bars (Standard error; n=3) indicate statistically significant differences (P < 0.05) between strains at the corresponding time points. (B) Disk diffusion assay for H2O2 sensitivity showing zones of inhibition around disks soaked in various H2O2 concentrations. (C) Extracellular protease activity assays with clear proteolysis zones on LB agar plates containing 2% skim milk, indicating protease secretion. Observed clear zones were comparable for the oxidative stress tolerance, and protease activity suggesting no difference between strains.
Figure 12
Figure 12
Comparative analysis of Burkholderia plantarii KACC 19864 wild-type, aroA deletion mutant, and aroA-complemented strains motility assays. (A) Swimming motility was assessed on 0.3% agar LB plates, and (B) swarming motility assay on 0.5% agar LB plates. After incubation, plates were imaged and the spread of bacterial growth was measured using ImageJ software. The bar graphs on the right side demonstrate the surface area of motility spread, with bars representing the mean from 3 replicates. Error bars represent standard deviation, illustrating no significant difference in motility among the strains.

Similar articles

Cited by

References

    1. Abby S. S., Cury J., Guglielmini J., Néron B., Touchon M., Rocha E. P. (2016). Identification of protein secretion systems in bacterial genomes. Sci. Rep. 6, 23080. doi: 10.1038/srep23080 - DOI - PMC - PubMed
    1. Abby S. S., Néron B., Ménager H., Touchon M., Rocha E. P. (2014). MacSyFinder: a program to mine genomes for molecular systems with an application to CRISPR-Cas systems. PloS One 9, e110726. doi: 10.1371/journal.pone.0110726 - DOI - PMC - PubMed
    1. Angus A. A., Agapakis C. M., Fong S., Yerrapragada S., Estrada-de Los Santos P., Yang P., et al. . (2014). Plant-associated symbiotic Burkholderia species lack hallmark strategies required in mammalian pathogenesis. PloS One 9, e83779. doi: 10.1371/journal.pone.0083779 - DOI - PMC - PubMed
    1. Azegami K., Nishiyama K., Kato H. (1988). Effect of iron limitation on “Pseudomonas plantarii” growth and tropolone and protein production. Appl. Environ. Microbiol. 54, 844–847. doi: 10.1128/aem.54.3.844-847.1988 - DOI - PMC - PubMed
    1. Azegami K., Nishiyama K., Watanabe Y., Kadota I., Ohuchi A., Fukazawa C. (1987). Pseudomonas plantarii sp. nov., the causal agent of rice seedling blight. Int. J. Syst. Evol. Microbiol. 37, 144–152. doi: 10.1099/00207713-37-2-144 - DOI

LinkOut - more resources