. 2024 May 25;10(11):e31969.
doi: 10.1016/j.heliyon.2024.e31969. eCollection 2024 Jun 15.

CircRNA hsa_circ_0069,399 as a potential clinical prognostic marker in laryngeal squamous cell carcinoma

Affiliations

CircRNA hsa_circ_0069,399 as a potential clinical prognostic marker in laryngeal squamous cell carcinoma

Zhipeng Mi et al. Heliyon. .

Erratum in

Abstract

Objective: Circular RNAs (circRNAs) significantly influence the invasion, metastasis, gene expression, proliferation, and apoptosis of tumor cells. However, the roles of circRNAs in laryngeal squamous cell carcinoma (LSCC) remain largely unexplored. This study aims to examine circRNA expression patterns in LSCC and adjacent non-tumorous tissues, with the goal of uncovering potential biomarkers for LSCC.

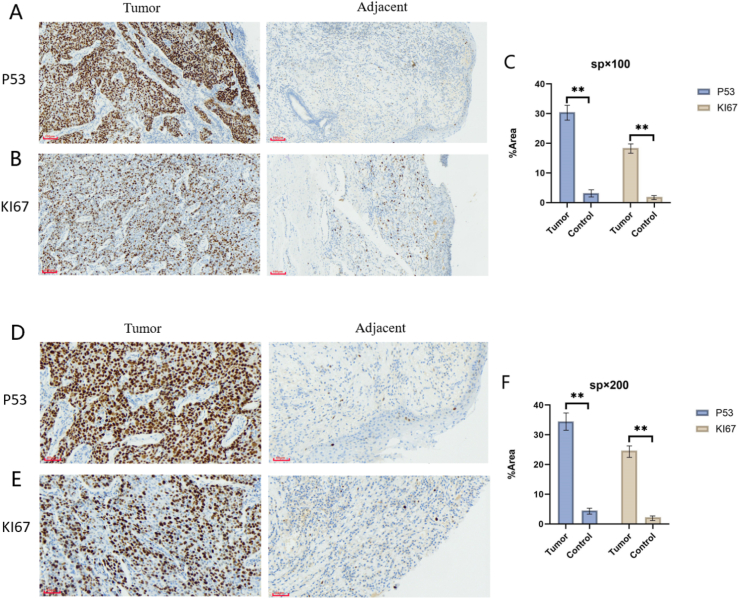
Methods: Tissue samples were collected from both the tumor and adjacent normal tissues of ten patients who had undergone surgical resection. The profiling of circRNAs was conducted through transcriptomic sequencing and analytical bioinformatics approaches. A ternary regulatory network based on the competitive endogenous RNA (ceRNA) hypothesis was established, linking target circRNAs to clinical immunohistochemical parameters for comparison. Verification of target circRNAs in LSCC tissues was performed using quantitative real-time PCR (RT-qPCR), whereas target mRNAs were analyzed through immunohistochemistry.

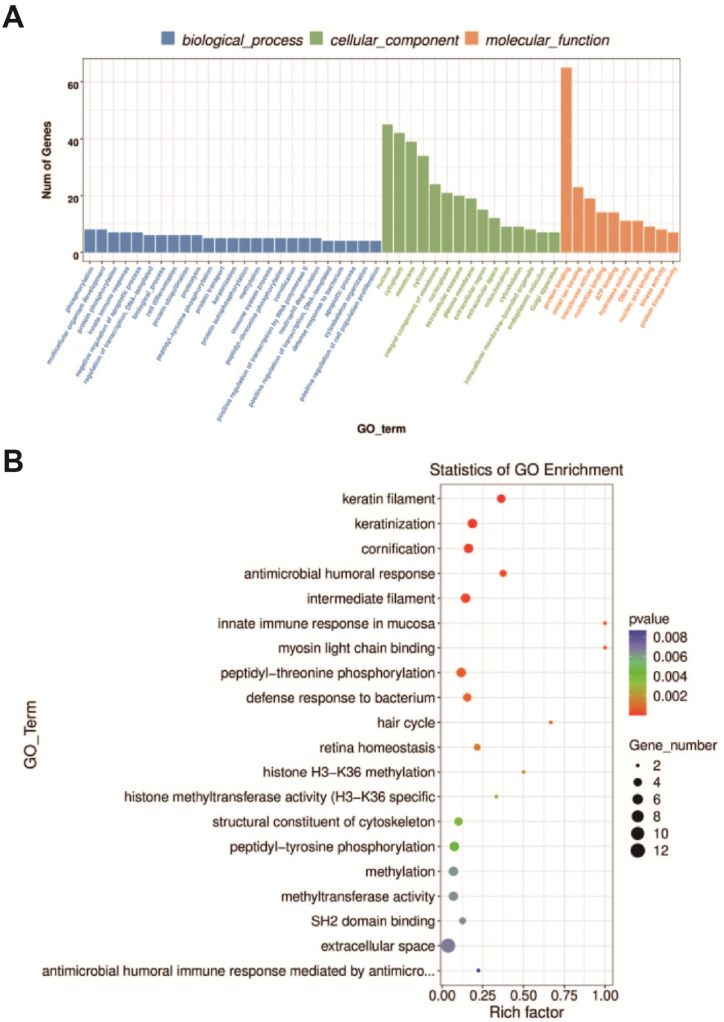
Results: A total of 126 significantly different circRNAs were identified, including 40 up-regulated genes and 86 down-regulated genes. Furthermore, 92 circRNA-miRNA-mRNA regulatory relationship axes related to clinical immunohistochemical indicators were found based on 5 candidate circRNAs. Interestingly, all axes related to the target genes MKI67 and TP53 were found to compete with the same circRNA: hsa_circ_0069,399. Further verification confirmed that the hsa_circ_0069,399 expression was overtly upregulated in tumor tissues from LSCC patients, which was consistent with the sequencing results.

Conclusion: hsa_circ_0069,399 could be a potential prognostic marker for LSCC.

Keywords: Laryngeal squamous cell carcinoma; ceRNA; circRNA; hsa_circ_0069399.


Conflict of interest statement

The authors declare that they have no known competing financial interests or personal relationships that could have appeared to influence the work reported in this paper.

Figures

Fig. 1
Fig. 1
circRNA differential expression profile and visual analysis. A, the differentially expressed circRNAs between LSCC tissues and adjacent normal tissues. The red columns indicate the number of up-regulated genes, while the blue columns indicate the number of down-regulated genes. B, Differentially expressed circRNA volcano maps. The volcano graph displays the fold change of differential gene expression in the comparison group on the x-axis, and the statistical significance of the difference in gene expression on the y-axis. In this graph, red indicates significantly up-regulated differentially expressed genes, blue represents significantly down-regulated differentially expressed genes, and gray represents non-significant differentially expressed genes. C, circRNA clustered analysis of differential expression. In the cluster diagram, the x-axis represents the sample, while the y-axis represents the screened differentially expressed genes. The different colors in the diagram represent different gene expression levels. The color scale ranges from blue to white to red, indicating the expression levels from low to high. Red color indicates high expressed genes, while blue color indicates low expressed genes.
Fig. 2
Fig. 2
GO enrichment analysis. A, GO Enrichment Analysis Histogram: The histogram visually segregates the genes into three main categories: molecular function, cellular component, and biological process, indicated along the x-axis. The y-axis illustrates how many differential genes are enriched within each specific Gene Ontology (GO) term, offering a clear distribution view. B, GO Enrichment Analysis Scatter Plot: This scatter plot demarcates the enrichment landscape of GO terms, with the x-axis displaying the Rich factor. The Rich factor quantifies the enrichment level, being the ratio of differential genes assigned to a GO term against the total gene count within that term — higher values suggest more substantial enrichment. On the y-axis, we have the GO_Term, denoting the functional annotation associated with each GO category. The diameter of each dot corresponds to the quantity of significantly differentiated genes aligned to an individual GO term, providing a visual measure of gene involvement. Dot coloration varies according to the p-value obtained from the enrichment analysis; colors representing a p-value below 0.05 signal statistically significant enrichment, enriching our understanding of the biological significance behind these genomic variations.
Fig. 3
Fig. 3
KEGG enrichment analysis. A, Visualization of KEGG Pathway Enrichment Analysis. This scatter plot illustrates the correlation between the Rich factor and the specific KEGG pathway terms, where the Rich factor embodies the enrichment level in KEGG pathways — a higher Rich factor denotes more significant enrichment. The term “Pathway” specifically pertains to the various metabolic pathways cataloged by KEGG. Each point's size on the plot corresponds to the count of significantly differentiated genes aligned with any single KEGG category. Additionally, the color coding of each point signifies the p-value from the enrichment analysis; notably, points marked with a color representing a p-value lower than 0.05 are considered to exhibit significant enrichment. B, Analysis of Disease Enrichment in KEGG Terms. The bar chart from the KEGG disease enrichment analysis highlights the top 20 disease terms that show significant enrichment. This graphical representation not only identifies which diseases are most prominently associated with the enriched genes but also provides insights into potential pathological connections revealed through the study.
Fig. 4
Fig. 4
CircRNA-mediated ceRNA network construction. A, Prediction of circRNA-miRNA-mRNA association: a. Down - regulated ceRNA network; b. Up - regulated ceRNA network; orange circles are circRNAs, blue triangles are miRNAs, and purple diamonds are mRNAs. B, Verification of target genes. The expression level of the target gene was verified by RT-qpcr. circRNA43 and hsa_circ_0069,399 are up-regulated, hsa_circ_0000344, hsa_circ_0001725, hsa_circ_0001789 and hsa-miR-2110_R-1 are down-regulated in LSCC tissue.
Fig. 5
Fig. 5
Immunohistochemical Staining of KI67 and P53. (A) Demonstrates elevated expression of P53 in tumor tissues compared to adjacent non-tumor tissues, observed through immunohistochemistry at 10× magnification. (B) Illustrates higher levels of KI67 expression in tumor tissues relative to adjacent tissues, captured via immunohistochemistry at 10× magnification. (D) Reveals increased expression of P53 in tumor tissues over adjacent non-tumor tissues, visualized through immunohistochemistry at 20× magnification. (E) Shows augmented expression of KI67 in tumor tissues in comparison to neighboring tissues, as seen through immunohistochemistry at 20× magnification. (C)&(F) Display the quantified expression levels of P53 and KI67 in tumor tissues, confirmed by immunohistochemical analysis, with **P<0.01 indicating a significant difference from adjacent non-tumor tissues. N = 10.

Similar articles

References

    1. Schutte H.W., Heutink F., Wellenstein D.J., et al. Impact of time to diagnosis and treatment in head and neck cancer: a systematic review. Otolaryngol. Head Neck Surg. 2020;162(4):446–457. - PubMed
    1. Pan X.L., Lin Y. The correct selection of treatment strategies for laryngeal cancer to improve the survival rate and quality of life for patients. Zhonghua er bi yan hou tou jing wai ke za zhi. 2020;55(12):1111–1115. - PubMed
    1. Miao L., Feng G., Yuan H. CircRNAs: a family number of miRNA regulatory transcriptome in laryngeal carcinoma. J. Clin. Lab. Anal. 2021;35(11) - PMC - PubMed
    1. Zheng Z.X.G. Treatment strategy and progress of laryngeal cancer. Modern oncology. 2022;30(11):2090–2093.
    1. Sharma A.R., Bhattacharya M., Bhakta S., et al. Recent research progress on circular RNAs: biogenesis, properties, functions, and therapeutic potential. Mol. Ther. Nucleic Acids. 2021;25:2162–2531. (Print)):355-371. - PMC - PubMed