. 2024 Jun 1;14(6):3901-3913.
doi: 10.21037/qims-23-1593. Epub 2024 Apr 22.

IDEAL-IQ measurement can distinguish dysplastic nodule from early hepatocellular carcinoma: a case-control study

Affiliations

IDEAL-IQ measurement can distinguish dysplastic nodule from early hepatocellular carcinoma: a case-control study

Guangping Zheng et al. Quant Imaging Med Surg. .

Abstract

Background: Previous studies have confirmed that malignant transformation of dysplastic nodule (DN) into hepatocellular carcinoma (HCC) is accompanied by reduction of iron content in nodules. This pathological abnormality can serve as the basis for magnetic resonance imaging (MRI). This study was designed to identify the feasibility of iterative decomposition of water and fat with echo asymmetry and least squares estimation-iron quantitative (IDEAL-IQ) measurement to distinguish early hepatocellular carcinoma (eHCC) from DN.

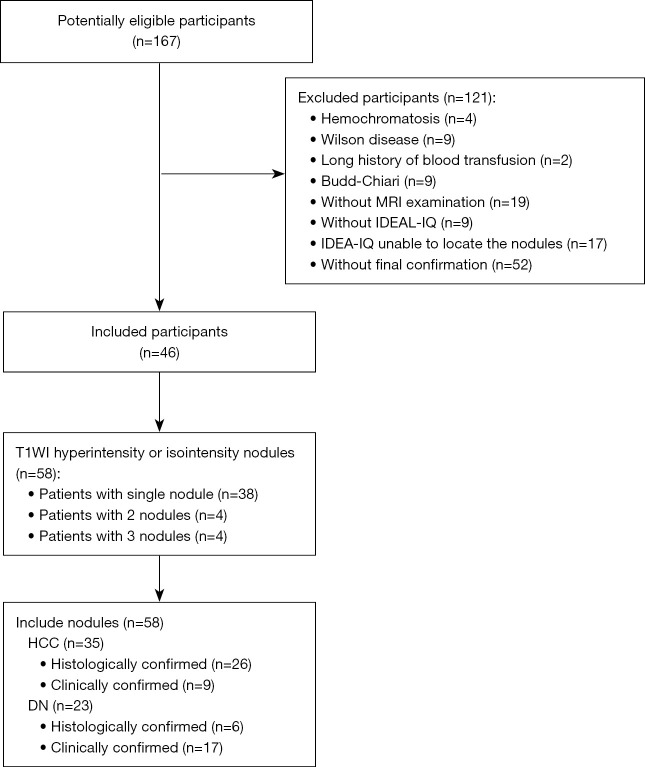
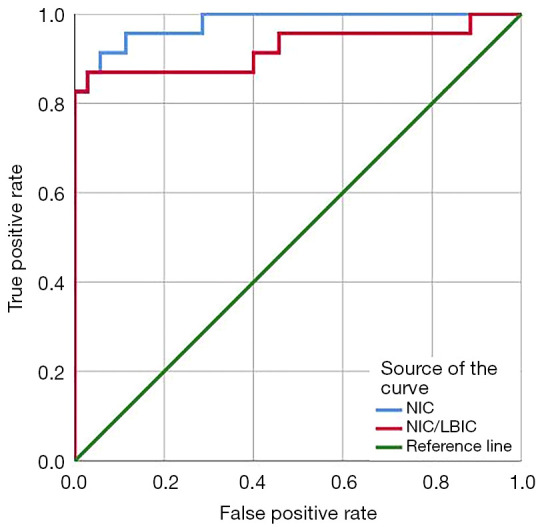
Methods: We reviewed MRI studies of 35 eHCC and 23 DN lesions (46 participants with 58 lesions total, 37 males, 9 females, 31-80 years old). The exams include IDEAL-IQ sequence and 3.0T MR conventional scan [including T1-weighted imaging (T1WI), T2-weighted imaging (T2WI), diffusion-weighted imaging (DWI), and Gadopentic acid (Gd-GDPA)-enhanced]. Then, 3 readers independently diagnosed eHCC, DN, or were unable to distinguish eHCC from DN using conventional MRI (CMRI), and then assessed R2* value of nodules [R2* value represents the nodule iron content (NIC)] and R2* value of liver background [R2* value represents the liver background iron content (LBIC)] with IDEAL-IQ. Statistical analysis was conducted using the t-test for comparison of means, the Mann-Whitney test for comparison of medians, the chi-square test for comparison of frequencies, and diagnostic efficacy was evaluated by using receiver operating characteristic (ROC) curve.

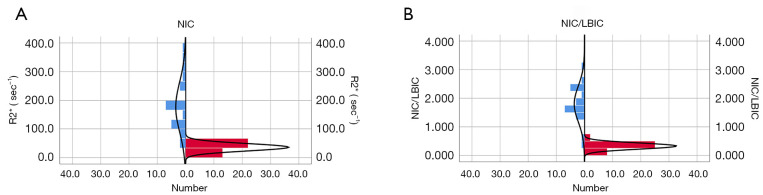
Results: This study evaluated 35 eHCC participants (17 males, 6 females, 34-81 years old, nodule size: 10.5-27.6 mm, median 18.0 mm) and 23 DN participants (20 males, 3 females, 31-76 years old, nodule size: 16.30±4.095 mm). The NIC and ratio of NIC to LIBC (NIC/LBIC) of the eHCC group (35.926±12.806 sec-1, 0.327±0.107) was lower than that of the DN group (176.635±87.686 sec-1, 1.799±0.629) (P<0.001). Using NIC and NIC/LBIC to distinguish eHCC from DN, the true positive/false positive rates were 91.3%/94.3% and 87.0%/97.1%, respectively. The rates of CMRI, NIC and NIC/LBIC in diagnosis of eHCC were 77.1%, and 94.3%, 97.1%, respectively, and those of DN were 65.2%, 91.3%, and 87.0%, respectively. The diagnosis rate of eHCC and DN by CMRI was lower than that of NIC and NIC/LBIC (eHCC: P=0.03, 0.04, DN: P=0.02, 0.04).

Conclusions: Using IDEAL-IQ measurement can distinguish DN from eHCC.

Keywords: Early hepatocellular carcinoma (eHCC); dysplastic nodule (DN); iterative decomposition of water and fat with echo asymmetry and least squares estimation-iron quantitative (IDEAL-IQ); magnetic resonance imaging (MRI).


Conflict of interest statement

Conflicts of Interest: All authors have completed the ICMJE uniform disclosure form (available at https://qims.amegroups.com/article/view/10.21037/qims-23-1593/coif). All authors report that this study received funding from Shenzhen High-level Hospital Construction Fund (No. G2022108). The authors have no other conflicts of interest to declare.

Figures

Figure 1
Figure 1
Flowchart of patient selection. MRI, magnetic resonance imaging; IDEAL-IQ, iterative decomposition of water and fat with echo asymmetry and least squares estimation-iron quantification; T1WI, T1-weighted imaging; HCC, hepatocellular carcinoma; DN, dysplastic nodule.
Figure 2
Figure 2
Comparison of R2* values (NIC) and NIC/LBIC in eHCC and DN. (A) The R2* value of eHCC (red bars) (35.926±12.806 sec−1) was lower than that of DN (blue bars) (176.635±87.686 sec−1), P<0.001. (B) The NIC/LBIC of eHCC (red bars) (0.327±0.107) was lower than that of DN (blue bars) (1.799±0.629), P<0.001. NIC, nodule iron content; LBIC, liver background iron content; NIC/LBIC, ratio of nodule iron content to liver background iron content-iron quantification; eHCC, early hepatocellular carcinoma; DN, dysplastic nodule.
Figure 3
Figure 3
MR images in a 52-year-old man with HCC (white arrow). Mass in segment VIII with T1WI hyperintensity (A), T2WI slightly hyperintensity (B) and DWI (b=800 s/mm2) hyperintensity (C). DCE-MRI (D-F): arterial phase mild hyperenhancement (D), washout appearance in portal venous phase (E) and delayed phase (F). In this case, 2 of the 3 radiologists diagnosed eHCC based on CMRI. Then, this patient also underwent Gadoxetic acid disodium (Gd-Eob-DTPA) enhancement: hepatobiliary phase in 10 minutes (G) and 20 minutes (H) showed mass hypointensity. IDEAL-IQ (I,J): the mass showed blur and slightly hyperintensity in PDFF mapping (I), yet low R2* value in R2* mapping (R2* value =49.523 sec−1) (J). Tumor surgical excision specimen (K). Histological images (hematoxylin and eosin staining, ×10) (L). MR, magnetic resonance; HCC, hepatocellular carcinoma; T1WI, T1-weighted imaging; T2WI, T2-weighted imaging; DWI, diffusion-weighted imaging; DCE-MRI, dynamic contrast-enhanced MRI; eHCC, early hepatocellular carcinoma; CMRI, conventional MRI; Gd-Eob-DTPA, gadolinium ethoxybenzyl-diethylenetriaminepentaacetic acid; IDEAL-IQ, iterative decomposition of water and fat with echo asymmetry and least squares estimation-iron quantification; PDFF, proton density fat fraction; MRI, magnetic resonance imaging.
Figure 4
Figure 4
MR images in a 49-year-old man with DN (white arrow). Nodule in segment V with T1WI slightly hyperintensity (A), T2WI slightly hyperintensity (B), and DWI (b=800) was blurred (C). DCE-MRI (D-F): arterial phase mild hyperenhancement (D), washout appearance in portal venous phase (E) and delayed phase (F). In this case, all 3 radiologists diagnosed eHCC based on CMRI. IDEAL-IQ (G,H): the nodule showed hyperintensity in PDFF mapping (G) and high R2* value in R2* mapping (R2* value =76.500 sec−1) (H). This patient also underwent Gadoxetic acid disodium (Gd-Eob-DTPA) enhancement: hepatobiliary phase in 10 minutes (I) and 20 minutes (J) showed nodule hypointensity. DSA examination showed no tumor staining (K). Histological image (needle biopsy, hematoxylin and eosin staining, ×20) (L). MR, magnetic resonance; DN, dysplastic nodule; T1WI, T1-weighted imaging; T2WI, T2-weighted imaging; DWI, diffusion-weighted imaging; DCE-MRI, dynamic contrast-enhanced MRI; eHCC, early hepatocellular carcinoma; CMRI, conventional MRI; IDEAL-IQ, iterative decomposition of water and fat with echo asymmetry and least squares estimation-iron quantification; Gd-Eob-DTPA, gadolinium ethoxybenzyl-diethylenetriaminepentaacetic acid; MRI, magnetic resonance imaging.
Figure 5
Figure 5
ROC curves of NIC and NIC/LBIC distinguish HCC from DN. The AUC was 0.979 (95% CI: 0.949–0.992) and 0.923 (95% CI: 0.831–0.954) (P<0.01), and the cutoff value was 71.45 sec−1 and 1.275, respectively. The true positive rate was 91.3%, 94.3%, and the false positive rate was 87.0%, 97.1%, respectively. NIC, nodule iron content; LBIC, liver background iron content; NIC/LBIC, ratio of nodule iron content to liver background iron content; ROC, receiver operating characteristic; HCC, hepatocellular carcinoma; DN, dysplastic nodule; AUC, area under the curve; CI, confidence interval.

Similar articles

Cited by

References

    1. Sung H, Ferlay J, Siegel RL, Laversanne M, Soerjomataram I, Jemal A, Bray F. Global Cancer Statistics 2020: GLOBOCAN Estimates of Incidence and Mortality Worldwide for 36 Cancers in 185 Countries. CA Cancer J Clin 2021;71:209-49. 10.3322/caac.21660 - DOI - PubMed
    1. van der Pol CB, McInnes MDF, Salameh JP, Levis B, Chernyak V, Sirlin CB, et al. CT/MRI and CEUS LI-RADS Major Features Association with Hepatocellular Carcinoma: Individual Patient Data Meta-Analysis. Radiology 2022;302:326-35. 10.1148/radiol.2021211244 - DOI - PubMed
    1. Yang JD, Heimbach JK. New advances in the diagnosis and management of hepatocellular carcinoma. BMJ 2020;371:m3544. 10.1136/bmj.m3544 - DOI - PubMed
    1. Takayama T, Makuuchi M, Hirohashi S, Sakamoto M, Okazaki N, Takayasu K, Kosuge T, Motoo Y, Yamazaki S, Hasegawa H. Malignant transformation of adenomatous hyperplasia to hepatocellular carcinoma. Lancet 1990;336:1150-3. 10.1016/0140-6736(90)92768-D - DOI - PubMed
    1. Sakamoto M, Hirohashi S, Shimosato Y. Early stages of multistep hepatocarcinogenesis: adenomatous hyperplasia and early hepatocellular carcinoma. Hum Pathol 1991;22:172-8. 10.1016/0046-8177(91)90039-R - DOI - PubMed