

doi: 10.21037/qims-24-335.
Epub 2024 May 9.
Cartilaginous endplate coverage of developmental Schmorl's node and the relevance of this in Schmorl's node etiology-based classification
Affiliations
- PMID: 38846309
- PMCID: PMC11151241
- DOI: 10.21037/qims-24-335
Item in Clipboard
Cartilaginous endplate coverage of developmental Schmorl's node and the relevance of this in Schmorl's node etiology-based classification
Quant Imaging Med Surg.
.
No abstract available
Conflict of interest statement
Conflicts of Interest: The author has completed the ICMJE uniform disclosure form (available at https://qims.amegroups.com/article/view/10.21037/qims-24-335/coif). Y.X.J.W. serves as the Editor-in-Chief of Quantitative Imaging in Medicine and Surgery. The author has no other conflicts of interest to declare.
Figures
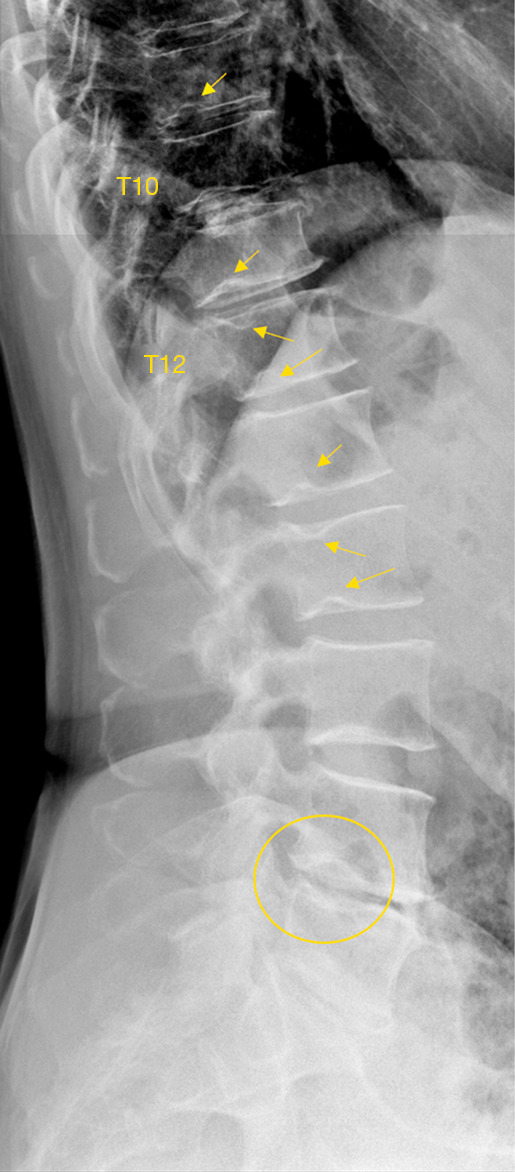
Radiograph shows multiple SN type-1A (arrows). The locations are very typical for this type of SN. T10/T11 disc space have calcified disc. L4 lower endplate shows ‘cupid bow’ (oval). SN, Schmorl’s node.
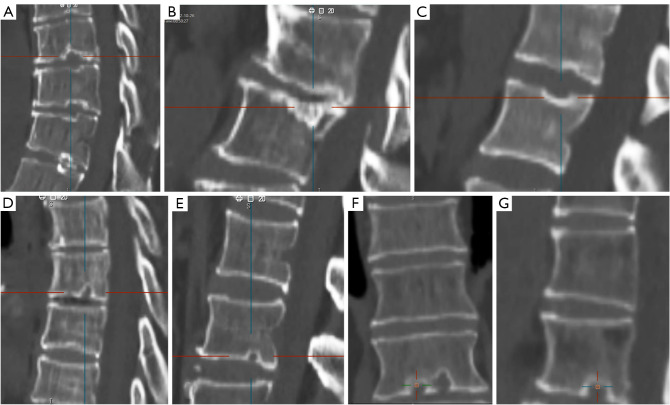
Sagittal CT reconstruction (A-G) shows SNd type-1A. Overall, these SNd have a clear and continuous sclerotic bony border, without apparent surrounding increased cloudy density that would reflect reactive bony regeneration. The location is very typical for this type of SNd, and at the junction of anterior 2/3 and posterior 1/3 of the endplates. Note that, in (C) the posterior portion of the superior endplate and in (G) the deep portion of the inferior endplate appear to be thick, but these are not considered as surrounding cloudy density. (F) and (G) are the same case. (F) with coronal view shows two SNd. CT, computed tomography; SNd, Schmorl’s node of developmental cause.
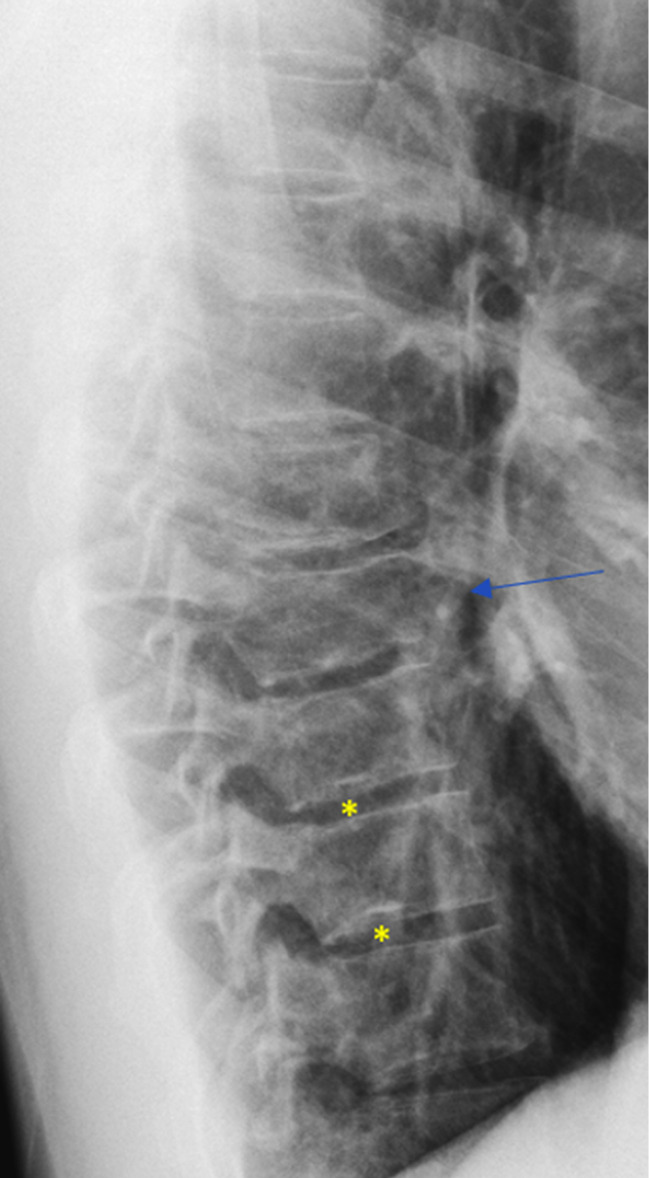
The lower endplates of T9 and T10 both have a small SN with typical location (asterisks, type-1A). T8 has a reduced height (developmental short vertebra), the border of T8 appears to be irregular (arrow). This patient was a 28-year-old man without any symptoms related to spine disorder. Reused with permission from Wáng (16). SN, Schmorl’s node.
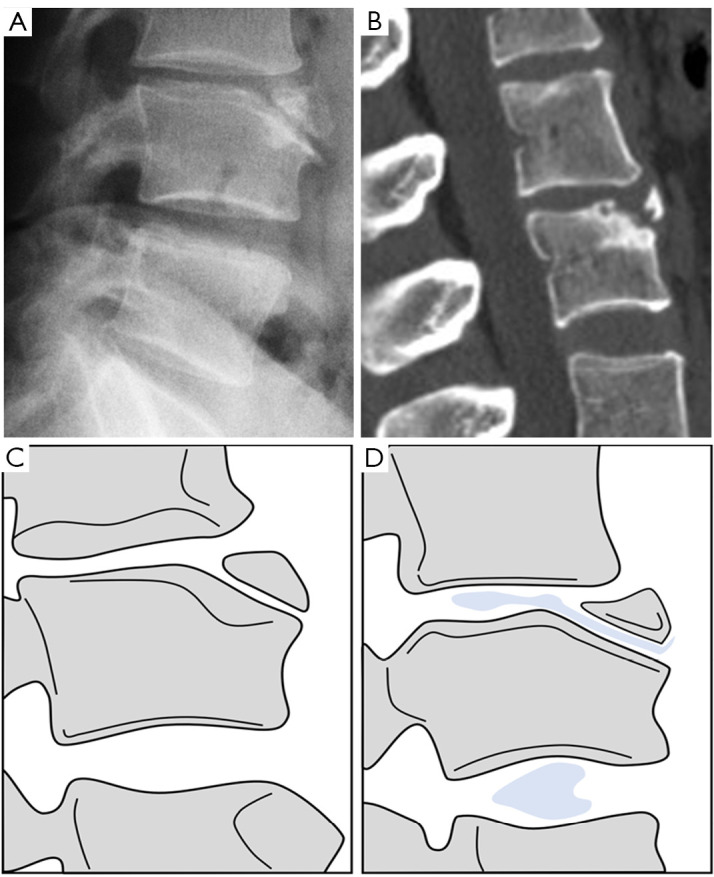
Limbus vertebra with SN type-1B. Radiograph (A) and sagittal reconstruction CT (B) show limbus vertebra. (C) and (D) are line-drawings mimicking the radiograph and radiographic discogram from Ghelman and Freiberger et al. (17). Limbus vertebra at L3 level. (D) Mimics discogram of L2–L3 disc showing opacified nucleus pulposus herniated between L2 vertebra body and fragments of limbus vertebra. Discogram at L3–L4 is normal. SN, Schmorl’s node; CT, computed tomography.
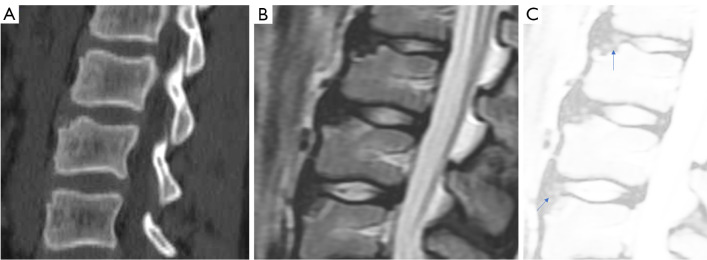
A case has multiple SNs (type-1B). Sagittal reconstructed CT image (A) and T2-weighted MR image (B,C). (C) T2-weighted MR image with heightened brightness tentatively shows disc herniation into the space (arrows). This case has the etiology as illustrated in Figure 11. Modified and reused with permission from Wáng et al. (18). SN, Schmorl’s node; CT, computed tomography; MR, magnetic resonance.
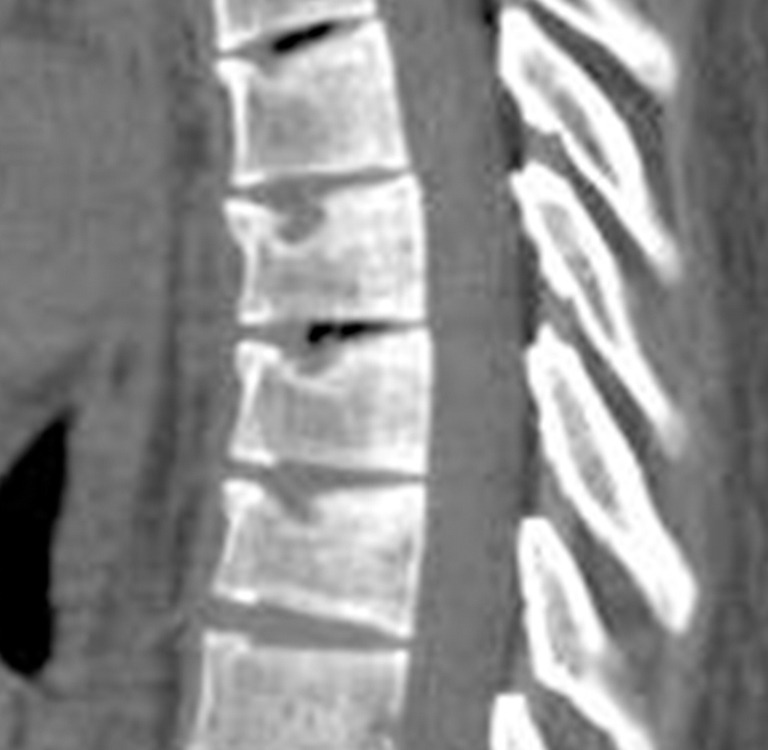
Sagittal reconstructed CT image of thoracic spine shows multiple SNds and mild wedging of vertebral bodies. Multiple nodules with similar locations strongly suggest this case had SNd (type-1B). Overall, these SNd have a clear and continuous sclerotic bony border. Reused with permission from Wáng et al. (18). CT, computed tomography; SNd, Schmorl’s node of developmental cause.
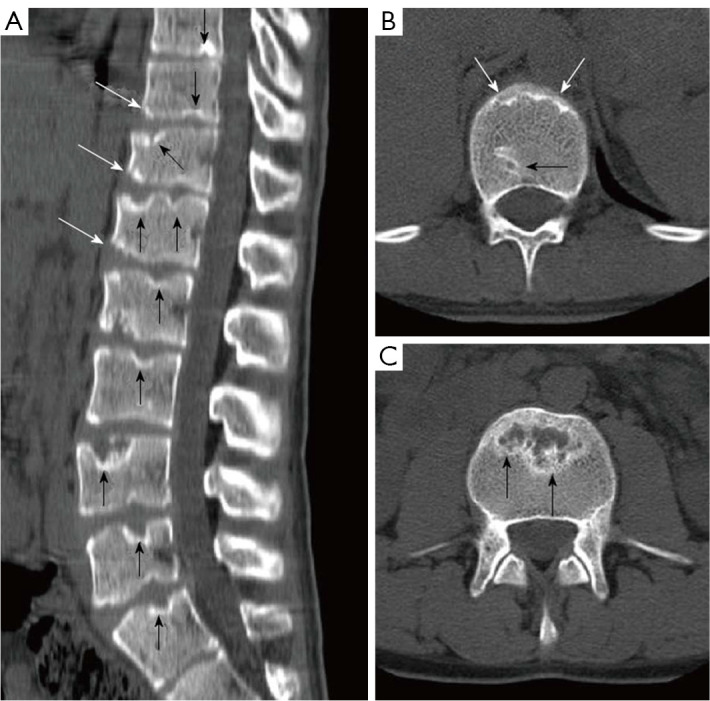
A case of atypical Scheuermann’s disease with sagittally reconstructed reformatted (A) and axial CT (B,C). (A) Evident irregularities and SN in thoracic, lumbar, and sacral endplate surfaces (black arrows), anterior wedging in vertebra body (white arrows) are shown; (B,C) endplate irregularities in axial plane CT images (white arrows) and SN (black arrows) are shown. Note that it is not necessary that every single one of these SN is due to Scheuermann’s disease. Reused with permission from Gokce and Beyhan (19). CT, computed tomography; SN, Schmorl’s node.
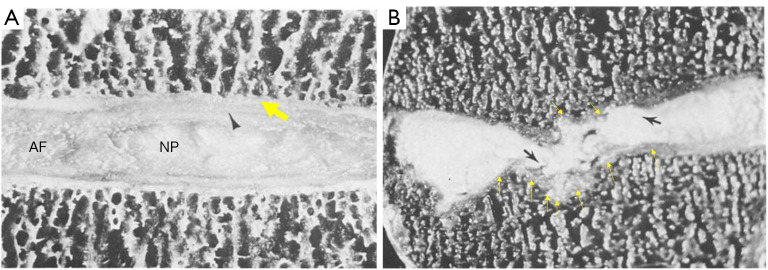
Anatomical image of a normal disc (A) and a disc with Scheuermann’s disease (B). Black arrowhead in (A): AF. Yellow thick arrow in (A): cartilaginous endplate. (B) Show multiple Schmorl nodes (black arrows) on both the superior and inferior surface of the vertebral body, where the cartilaginous endplate (yellow arrows) is still continuous. Disk space loss is also seen in (B). Reused with permission from Resnick and Niwayama et al. (20). AF, annulus fibrosus; NP, nucleus pulposus.
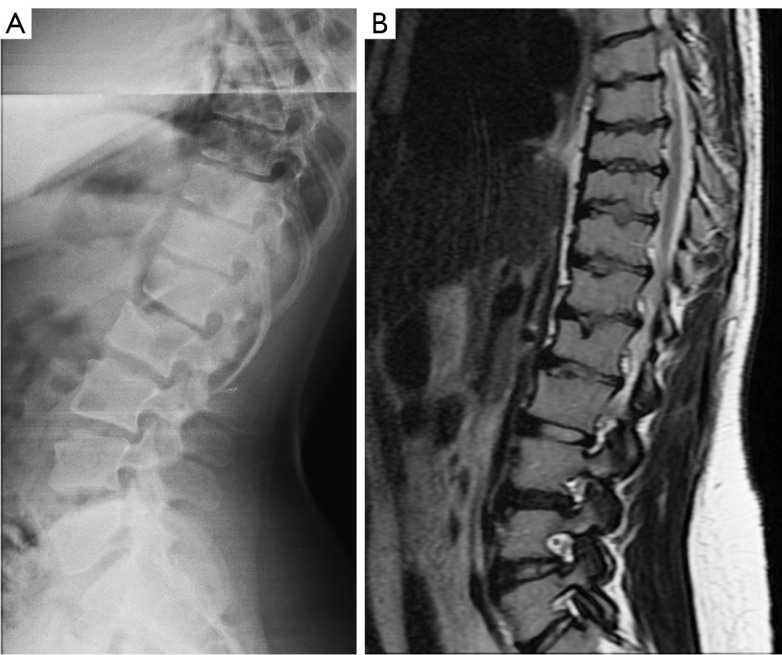
A patient with mucopolysaccharidosis type-1. Lateral spine radiograph (A) and sagittal T2-weighted MRI (B) show multiple hypoplastic vertebral bodies at the thoracolumbar transition, together with multiple SNs (type-1B). These are typical imaging findings of mucopolysaccharidosis. Reused with permission from Wáng et al. (18). MRI, magnetic resonance imaging; SN, Schmorl’s node.
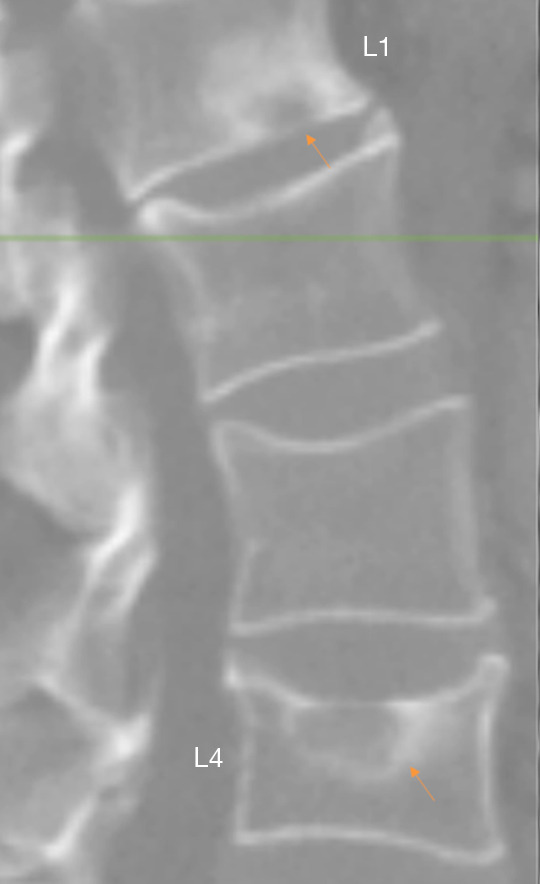
CT image examples of SN type-2 at L4 and at L1. L1 lower endplate SN (arrow: SNa) with apparent reactive bone changes, and L4 with upper endplate SNa (arrow) and depression. SNa at L4 is likely associated with low BMD. Reused with permission from Wáng et al. (22). CT, computed tomography; SN, Schmorl’s node; SNa, Schmorl’s node of acquired cause; BMD, bone mineral density.
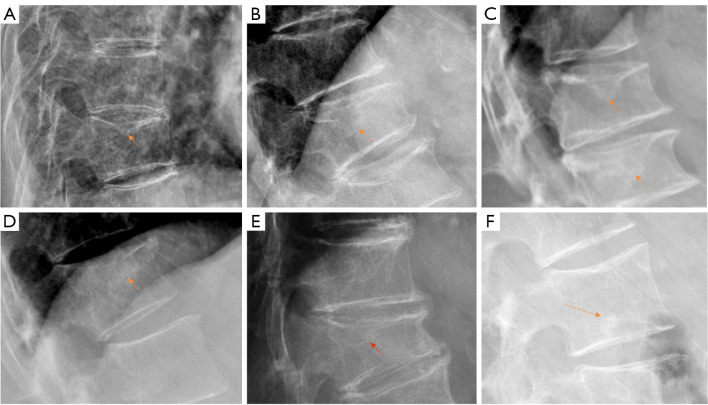
Radiograph shows SNa (type-2, A-F). Overall, these SN have surrounding hazy increased density reflecting reactive bony regeneration (arrow), and the bony sclerotic border may be incomplete. These SNs are not at the most typical location of SNd, and SNa in (A-E) also are associated with osteoporotic-like vertebral fractures. SNa, Schmorl’s node of acquired cause; SN, Schmorl’s node; SNd, Schmorl’s node of developmental cause.
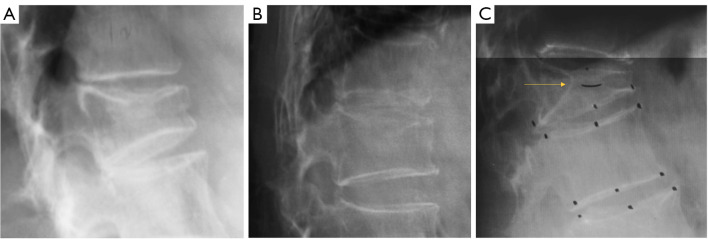
Radiograph of SN (type-2). The bony sclerotic border of these SN is incomplete. Endplate depression is seen in (A) and (B), with hazy increased density surrounding SN reflecting reactive bony regeneration. (C) shows a case of penetrating Schmorl node (arrow), and the involved vertebral body is collapsed due to osteoporosis. SN, Schmorl’s node.
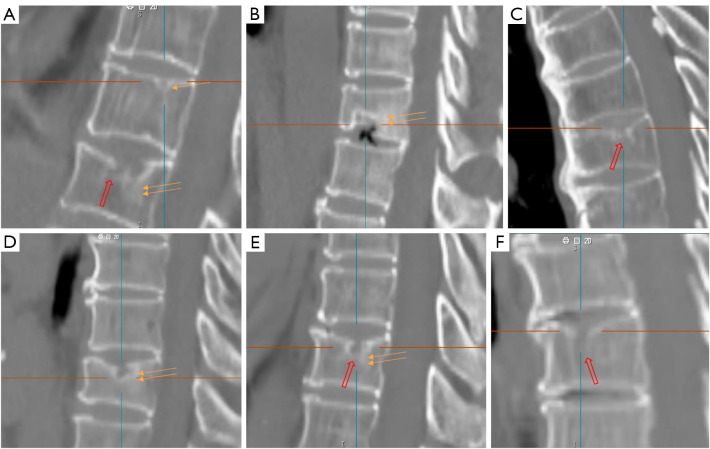
Sagittally reconstructed image show SNa and SNd (A-F). A single arrow denoted an SNd (type-1A) while double arrows and a red open arrow show an SNa (type-2). Double arrows in (A-F) show surrounding hazy increased density reflecting reactive bony regeneration. Red open arrow shows the bony sclerotic border of the SNa is incomplete. SNa, Schmorl’s node of acquired cause; SNd, Schmorl’s node of developmental cause.
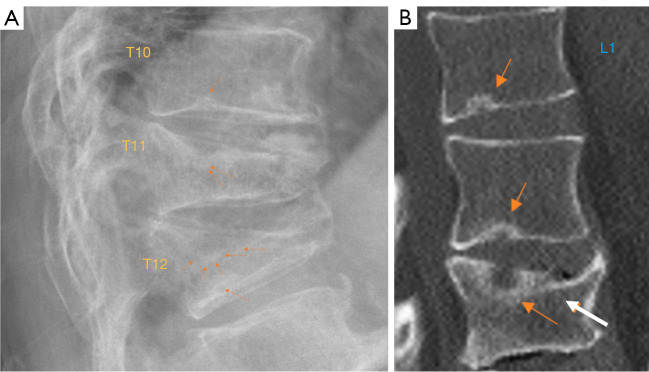
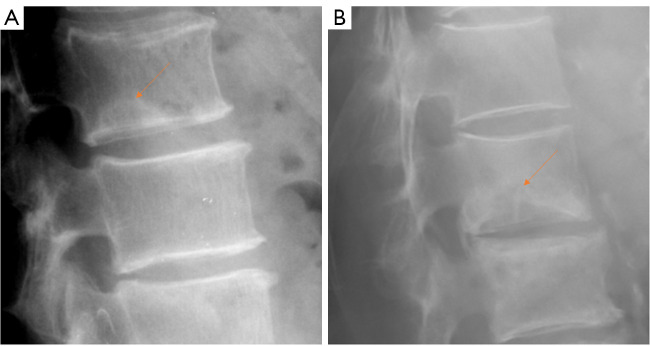
SN of type-1A and type-3, type-4. (A) Radiograph of SN type-1A at T10 and T12 lower endplate (single arrow), and T11 and T12 upper endplate SN type-3. T11 SN shows apparent reactive bone changes around the SN (arrows). T12 upper endplate SN shows an incomplete sclerotic border (arrows). T11 and T12 vertebrae are with collapsed grade osteoporotic fracture. The location of these two upper endplate SN of T11 and T12 is typical of developmental SN (type-1A). (B) Sagittally reconstructed CT image. L1 lower endplate SN type-1A (brown arrow). L2 lower endplate SN type-4. L3 upper endplate SN type-3 (brown arrow), and L3 upper endplate depression (white arrow). SN, Schmorl’s node; CT, computed tomography.
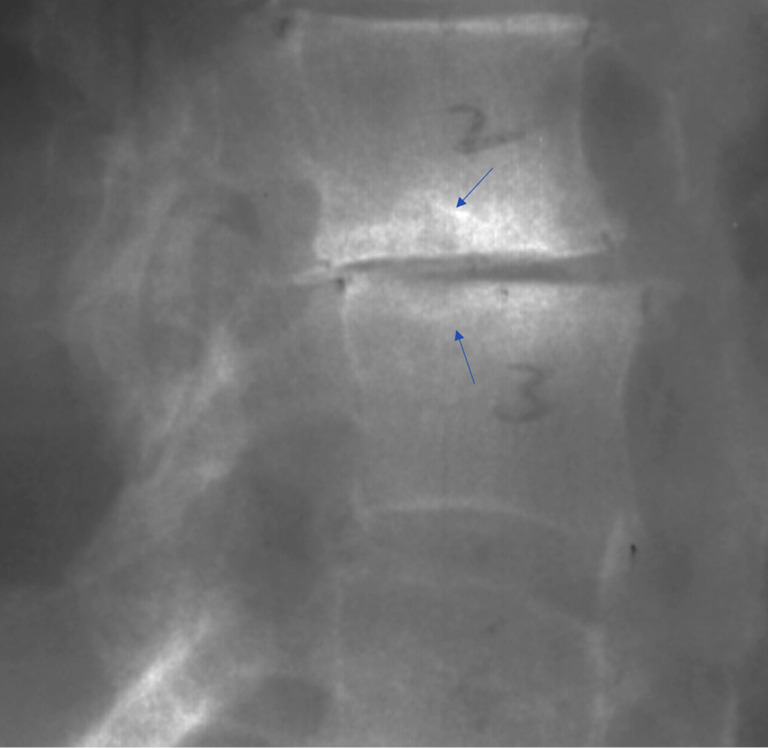
Radiograph of SN type-3 at L2 lower endplate and L3 upper endplate. Arrow shows apparent reactive bone changes while without endplate depression. The location of these two SN is typical of SNd, but the apparent reactive bone changes suggest involvement of acquired cause. There is also intervertebral disc space narrowing. SN, Schmorl’s node; SNd, Schmorl’s node of developmental cause.
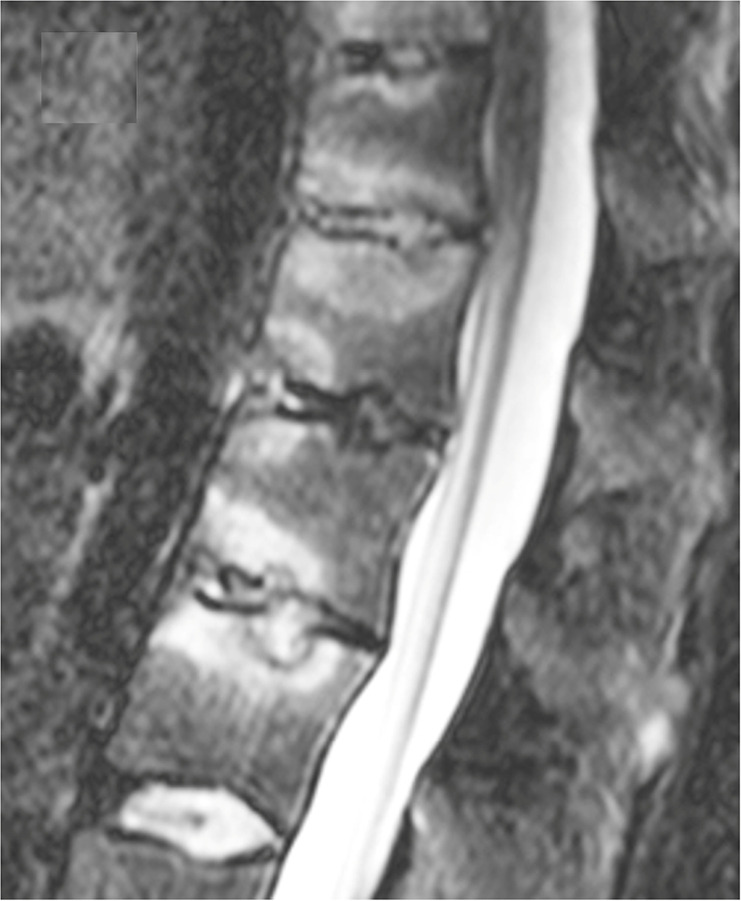
Spinal involvement in axial spondyloarthropathy. STIR images show SN type-3 and inflammatory changes. Reused with permission from Ruiz Santiago et al. (23). STIR, sagittal short tau inversion recovery; SN, Schmorl’s node.
Radiograph of SN type-4 (arrow). Lower endplate SN with possible surrounding reactive bone changes, without endplate depression in (A) and with endplate depression in (B). Bony borders of these two SN are ill-defined. On the other hand, the location of these two SN is typical of SN type-1A. These two SN can be due to pure acquired cause, or due to a mixture of acquired and developmental causes. Particularly for the case in (B), the clinical relevance of this SN will be the same as SN type-2. SN, Schmorl’s node.
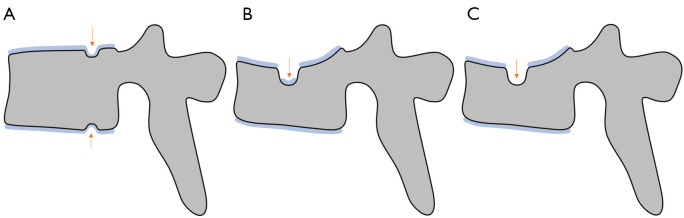
An illustration of cartilaginous endplate coverage of SN. (A) Two SNd with continuous cartilaginous endplate coverage (type-1A), however the covered cartilaginous endplate may be thinner and less regular (arrow). (B) A SNa with only partial remanent cartilaginous endplate (type-2, arrow). (C) A SNa without cartilaginous endplate coverage (type-2, arrow). It is highly possible that low BMD and osteoporosis is the most common etiology for SNa among elder populations, thus osteoporotic-like vertebral fracture can be a commonly associated imaging finding for these SNa. SN, Schmorl’s node; SNd, Schmorl’s node of developmental cause; SNa, Schmorl’s node of acquired cause; BMD, bone mineral density.
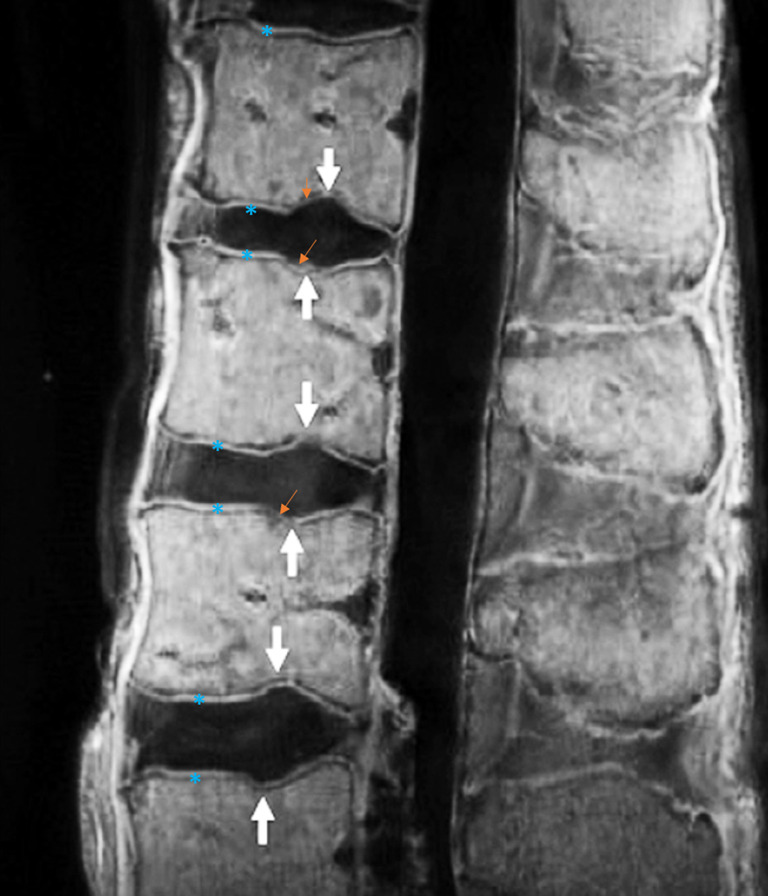
UTE ex vivo MR image shows multiple typical SN type-1A. The locations are very typical for this type of SN. The cartilaginous endplate (blue asterisks) covering the SNs appears to be continuous (arrows), though these parts appear to be thinner or less regular (brown small arrows) and may appear discontinuous artificially when the spatial resolution is insufficient. Reused with permission from Siriwanarangsun et al. (8). UTE, ultrashort time-to-echo; MR, magnetic resonance; SN, Schmorl’s node.
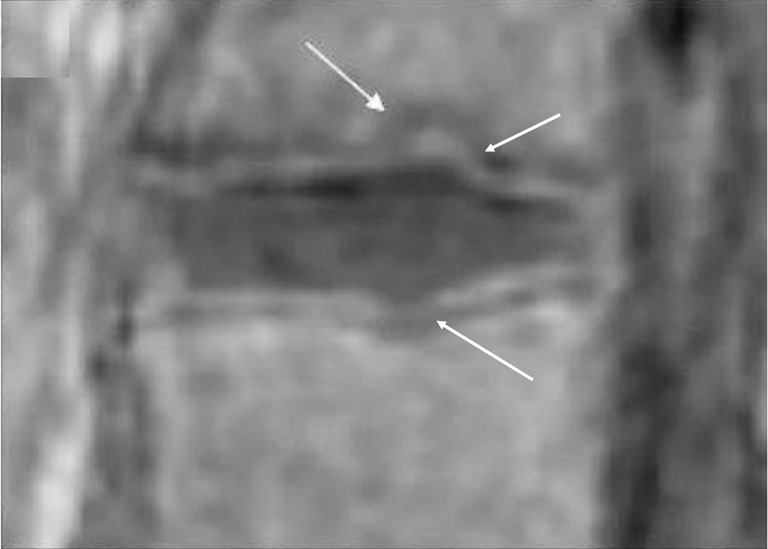
UTE image shows two typical SN type-1A. The locations are very typical for this type of SN, involving the lower endplate of an upper vertebra and the upper endplate of a lower vertebra, and at the junction of anterior 2/3 and posterior 1/3 of the endplates. The cartilaginous endplate covering the two SNs appears to be continuous (arrows). Reused with permission from Ji et al. (15). UTE, ultrashort time-to-echo; SN, Schmorl’s node.
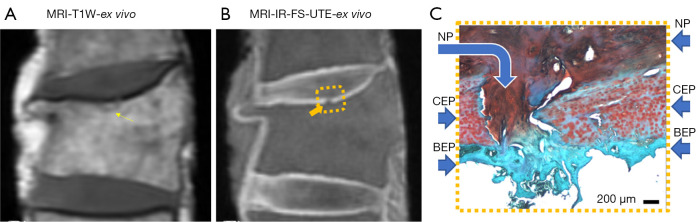
A small SN without cartilaginous endplate coverage (type-2). (A) T1w ex vivo MR image of a vertebra with compressive fracture and a small SN (arrow). (B) IR-FS-UTE ex vivo MR image shows cartilaginous endplate of high signal (square). The defect of the SN is shown (arrow). (C) Histology image: curved arrow denotes disruption of the CEP, straight arrow denotes NP, CEP, and BEP. Reused with permission from Lombardi et al. (9). MRI, magnetic resonance imaging; T1w, T1-weighted; IR, inversion-recovery-prepared; FS, fat-saturated; UTE, ultrashort time-to-echo; NP, nucleus pulposus; CEP, cartilaginous endplate plate; BEP, bony endplate plate; SN, Schmorl’s node; MR, magnetic resonance.
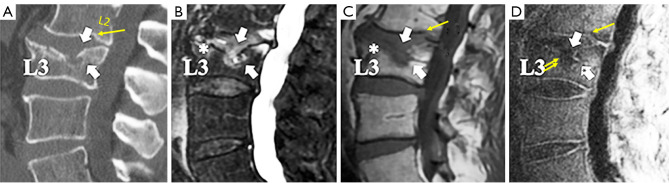
Vertebral L3 osteoporotic-like fracture and upper endplate SN type-2, as well as L2 lower endplate SN type-1A, with sagittal reconstructed in vivo CT image (A) and sagittal T2-weighted and T1-weighted images (B,C) as well as sagittal IR-FS-UTE images (D). T2 weighted image shows areas of bone marrow edema, especially in L3 (white asterisk). The cartilaginous endplate plate is seen on the IR-FS-UTE imaging (D), and it is discontinuous in the areas of fracture SNa entry (arrowheads and arrows in D). However, a residual amount of cartilaginous endplate can be appreciated (white arrow with a black asterisk). Reused with permission from Lombardi et al. (9). SN, Schmorl’s node; CT, computed tomography; IR, inversion-recovery-prepared; FS, fat-saturated; UTE, ultrashort time-to-echo; SNa, Schmorl’s node of acquired cause.
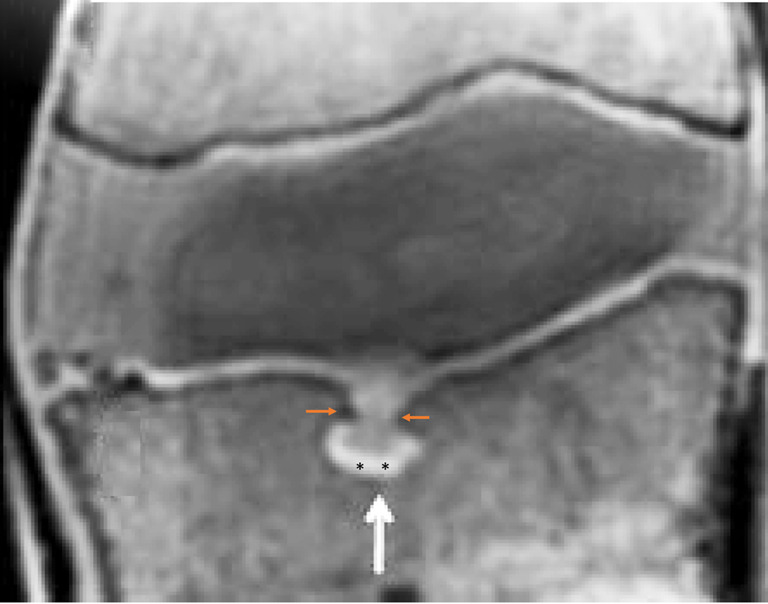
UTE MR image of a SN type-2 (white arrow). The cartilaginous endplate shows bright signal on the image, which is disrupted at the entry of SNa (brown arrows) and partially remains at the bottom of the SN (black asterisks). Note that the location of this SN is more anterior to the typical location of SN type-1A. Abruption and depression of adjacent bony endplate are also noted (brown arrows). Reused with permission from Lotz et al. (12). UTE, ultrashort time-to-echo; MR, magnetic resonance; SN, Schmorl’s node; SNa, Schmorl’s node of acquired cause.
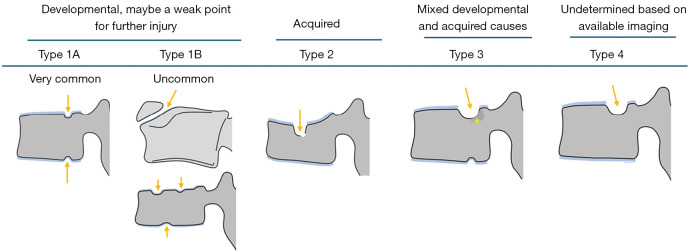
An illustration of four types of SN (arrows) classifications. Type-1A: SNd with continuous cartilaginous endplate coverage at the typical posterior part of the endplate and can involve both superior and inferior endplates. Type-1B: two types of less common SNd, with the lower example commonly seen in Scheuermann’s disease. Type-2: an SNa without cartilaginous endplate coverage and the sclerotic border of the SN may be discontinuous. Among older population, it is likely that low BMD/osteoporosis is the most common etiology of SN type-2, and compressive deformity of the involved vertebra is commonly seen. Type-3: this SN is at the typical location of type-1A, but also with SNa signs such as larger in size and with hazy cloud surrounding (asterisk). Type-4: this SN is at the typical location of type 1A, with possible additional signs suggesting SNa such as a larger than expected size. SN, Schmorl’s node; SNd, Schmorl’s node of developmental cause; SNa, Schmorl’s node of acquired cause; BMD, bone mineral density.
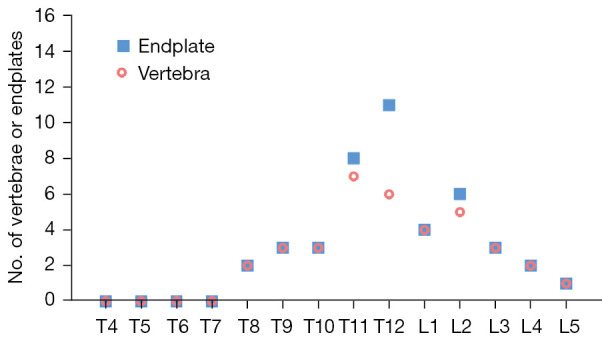
Vertebral level distribution of radiographic SNd (type-1A). X-axis: vertebral level. Y-axis: number of involved vertebra or endplate. Data from 297 cases of Italian Caucasian women with an SNd prevalence of 7.4% (22/297). The highest prevalence is at the thoracolumbar junction which is the site with the greatest biomechanical stress. For vertebrae with SNd (type-1A), 52.8% had lower endplate involvement, 27.8% had upper endplate involvement, while 19.4% had involved both upper and lower endplates. The data in this graph is from Wáng et al. (31). SNd, Schmorl’s node of developmental cause.
Similar articles
-
Differentiation between spinal subchondral bone metastasis with focal pathologic endplate fracture and oedematous Schmorl's node.J Med Imaging Radiat Oncol. 2022 Oct;66(7):913-919. doi: 10.1111/1754-9485.13365. Epub 2021 Dec 1. J Med Imaging Radiat Oncol. 2022. PMID: 34854219
-
Schmorl's Node: An Uncommon Case of Back Pain and Radiculopathy.Orthop Rev (Pavia). 2022 Apr 25;14(3):33641. doi: 10.52965/001c.33641. eCollection 2022. Orthop Rev (Pavia). 2022. PMID: 35775032 Free PMC article.
-
Schmorl's node may cause an increased FDG activity.Clin Nucl Med. 2011 Jun;36(6):494-5. doi: 10.1097/RLU.0b013e3182173967. Clin Nucl Med. 2011. PMID: 21552037
-
Schmorl's nodes: current pathophysiological, diagnostic, and therapeutic paradigms.Neurosurg Rev. 2014 Jan;37(1):39-46. doi: 10.1007/s10143-013-0488-4. Epub 2013 Aug 18. Neurosurg Rev. 2014. PMID: 23955279 Review.
-
Schmorl's nodes: demystification road of endplate defects-a critical review.Spine Deform. 2022 May;10(3):489-499. doi: 10.1007/s43390-021-00445-w. Epub 2021 Nov 25. Spine Deform. 2022. PMID: 34825353 Review.
Cited by
-
Subtype analysis of Schmorl's nodes in the lumbar spine and the association with lumbar degeneration: a retrospective evaluation of 2262 abdominal CT scans.Eur Spine J. 2025 May;34(5):1722-1730. doi: 10.1007/s00586-025-08827-8. Epub 2025 Apr 7. Eur Spine J. 2025. PMID: 40192771
-
Qualitative and Quantitative MR Imaging of the Cartilaginous Endplate: A Review.J Magn Reson Imaging. 2025 Apr;61(4):1552-1571. doi: 10.1002/jmri.29562. Epub 2024 Aug 20. J Magn Reson Imaging. 2025. PMID: 39165086 Review.
References
-
- Kronthaler S, Boehm C, Feuerriegel G, Börnert P, Katscher U, Weiss K, Makowski MR, Schwaiger BJ, Gersing AS, Karampinos DC. Assessment of vertebral fractures and edema of the thoracolumbar spine based on water-fat and susceptibility-weighted images derived from a single ultra-short echo time scan. Magn Reson Med 2022;87:1771-83. 10.1002/mrm.29078 - DOI - PubMed
LinkOut - more resources
Full Text Sources