. 2024 May 28;6(6):159-176.
doi: 10.1096/fba.2024-00047. eCollection 2024 Jun.

Heterogeneous distribution of mitochondria and succinate dehydrogenase activity in human airway smooth muscle cells

Affiliations

Heterogeneous distribution of mitochondria and succinate dehydrogenase activity in human airway smooth muscle cells

Sanjana Mahadev Bhat et al. FASEB Bioadv. .

Abstract

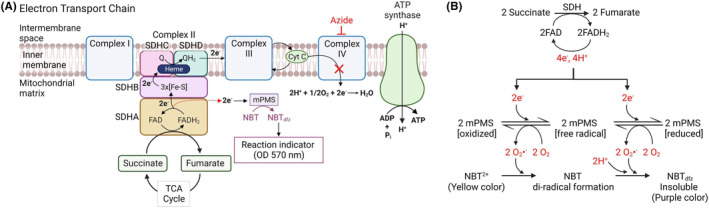
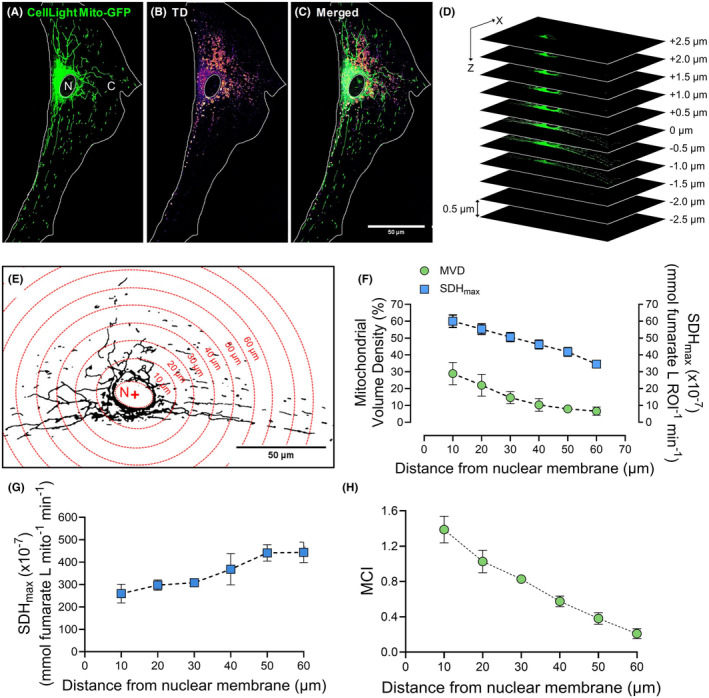
Succinate dehydrogenase (SDH) is a key mitochondrial enzyme involved in the tricarboxylic acid cycle, where it facilitates the oxidation of succinate to fumarate, and is coupled to the reduction of ubiquinone in the electron transport chain as Complex II. Previously, we developed a confocal-based quantitative histochemical technique to determine the maximum velocity of the SDH reaction (SDHmax) in single cells and observed that SDHmax corresponds with mitochondrial volume density. In addition, mitochondrial volume and motility varied within different compartments of human airway smooth muscle (hASM) cells. Therefore, we hypothesize that the SDH activity varies relative to the intracellular mitochondrial volume within hASM cells. Using 3D confocal imaging of labeled mitochondria and a concentric shell method for analysis, we quantified mitochondrial volume density, mitochondrial complexity index, and SDHmax relative to the distance from the nuclear membrane. The mitochondria within individual hASM cells were more filamentous in the immediate perinuclear region and were more fragmented in the distal parts of the cell. Within each shell, SDHmax also corresponded to mitochondrial volume density, where both peaked in the perinuclear region and decreased in more distal parts of the cell. Additionally, when normalized to mitochondrial volume, SDHmax was lower in the perinuclear region when compared to the distal parts of the cell. In summary, our results demonstrate that SDHmax measures differences in SDH activity within different cellular compartments. Importantly, our data indicate that mitochondria within individual cells are morphologically heterogeneous, and their distribution varies substantially within different cellular compartments, with distinct functional properties.

Keywords: airway smooth muscle; confocal microscope; intracellular distribution; mitochondria; succinate dehydrogenase.


Figures

FIGURE 1
FIGURE 1
Overview of the SDH assay. (A) An overview of the quantitative histochemical technique to measure the maximum velocity of the succinate dehydrogenase reaction (SDHmax). The schematic representation depicts the transfer of electrons (e) from the oxidation of succinate to fumarate in the TCA cycle into the ETC concluding at the terminal electron acceptor, complex IV. The SDH reaction is performed in the presence of azide to inhibit cytochrome oxidase (Complex IV) and an exogenous electron carrier, mPMS. As the terminal electron acceptor, mPMS promotes the progressive reduction of NBT to its diformazan (NBTdfz) which is used as the reaction indicator. The accumulation of NBTdfz within individual hASM cells is measured as the change in OD at 570 nm. (B) Schematic representation demonstrating the electron transport leading to the reduction of NBT, in the SDH assay. With succinate as substrate, the transfer of electrons from FADH2 to NBT is proposed along the classical pathway starting at complex II (Created with BioRender.com). hASM, human airway smooth muscle; NBT, nitroblue tetrazolium; OD, optical density; SDH, succinate dehydrogenase; TCA, tricarboxylic acid; ETC, electron transport chain.
FIGURE 2
FIGURE 2
Confirmation of hASM phenotype. (A) Representative maximum intensity Z projection image of dissociated cells show the phenotype of dissociated hASM cells based on their immunoreactivity to α‐SMA expression and larger size (scale bar = 50 μm). (B) Column bar graph represents the percentage of hASM cells present in dissociated cells determined by the fraction of α‐SMA expressing cells to total number of cells (determined from DAPI) from six patient samples (n = 120 hASM cells per patient). Note that ≥90% of total dissociated cells were immunoreactive to α‐SMA. hASM, human airway smooth muscle; SMA, smooth muscle actin.
FIGURE 3
FIGURE 3
SDH reaction is linear over time. (A) Representative images show the change in OD within delineated hASM cell during the SDH reaction at 0, 4, and 8 min. Individual hASM cells were delineated as the region of interest (ROI) for measuring the change in OD while the nucleus was excluded from the ROI (scale bar = 50 μm; N: Nucleus, C: Cytoplasm). To aid in visualizing the NBTdfz accumulation within hASM cells, the original gray‐scale images were manually thresholded and the LUTs were inverted to be represented as a heat map using NIS‐Elements software. (B) In hASM cells, the OD was measured every 15 s over an 8‐min period, with and without succinate (substrate). The SDH reaction was linear (R 2 = 0.99) across the 8‐min period in the presence of succinate. The rate of SDH reaction in the presence of succinate was significantly higher compared to that without succinate (R 2 = 0.95, p < 0.0001). Data represent results from one bronchial sample (patient), squares represent SDH reaction performed without succinate, and circles represent SDH reaction performed with succinate. Results were analyzed using a simple linear regression model. Statistical analyses were based on measurements from n = 10 cells per patient, from one bronchial sample (patients). NBT, nitroblue tetrazolium diformazan; OD, optical density; SDH, succinate dehydrogenase.
FIGURE 4
FIGURE 4
Inhibition of SDH catalytic core decreases SDHmax. (A) The diagram shows malonate competitively inhibiting SDH by blocking succinate uptake (Created with BioRender.com). (B) SDHmax measured in hASM cells after malonate treatment (1 mM for 24 h) was significantly decreased when compared to untreated (control) hASM cells (*p < 0.0001). (C) OCR measurements obtained from malonate‐treated and control hASM cells were normalized to the total cell count. (D) The maximal respiration was significantly decreased in malonate‐treated cells when compared to control hASM cells (*p < 0.0001). Each color represents results from one bronchial sample (patient). Circles represent SDHmax from untreated (control) hASM cells, and squares represent SDHmax from malonate‐treated cells. (E) The diagram shows the inhibition of the B subunit of SDH by targeted DsiRNA‐mediated knockdown (Created with BioRender.com). hASM cells were transfected with DsiRNA targeting SDHB (SDHB‐KD), with scrambled DsiRNA as negative control (NC). (F) SDHmax measured was significantly decreased in SDHB‐KD hASM cells when compared to NC (*p < 0.0001). (G) OCR measurements obtained from SDHB‐KD cells and NC cells were normalized to total cell count. (H) The maximal respiration was significantly decreased in SDHB‐KD hASM cells when compared to NC (*p < 0.0001). Each color represents results from one bronchial sample (patient). Circles represent SDHmax from NC hASM cells, and squares represent SDHmax from SDHB‐KD cells. Data are presented as mean ± SEM in scatter plot. Statistical analyses were based on measurements from n = 5 hASM cells per group from six bronchial samples (patients) using two‐way ANOVA for repeated measures. hASM, human airway smooth muscle; OCR, oxygen consumption rate; SDH, succinate dehydrogenase.
FIGURE 5
FIGURE 5
NBTdfz accumulation corresponds to mitochondrial volume within hASM cells. (A) Representative maximum intensity Z‐projection image of hASM cell loaded with CellLight™ Mitochondria‐GFP to visualize mitochondria (scale bar = 50 μm). (B) Representative image (TD) shows NBTdfz accumulation at 8 min. To aid in visualizing the NBTdfz accumulation within hASM cells, the original gray‐scale images were manually thresholded and the LUTs were inverted to be represented as a heat map using NIS‐Elements software. (C) Overlay of the CellLight‐labeled mitochondria and NBTdfz accumulation shows their respective pattern of distribution within the cell. (D) Z‐stacks were obtained with a controlled step size of 0.5 μm between optical slices across a 5 μm sampling depth (10 optical slices). (E) Representative image shows the binarized mitochondria within hASM cell with digitally computed and superimposed 3D concentric shells spaced in increments of 10 μm from the nuclear membrane (scale bar = 50 μm; N: Nucleus; +: Nuclear Centroid). Using this, the MCI, mitochondrial volume density and SDHmax within each shell were quantified. (F) The distribution of mitochondria as mitochondrial volume density (%) and SDHmax within the volume of each shell decreased relative to the distance (in μm) from the nuclear membrane. The SDHmax measurements mirrored the mitochondrial volume within the corresponding shells. (G) SDHmax normalized to mitochondrial volume decreased ~2‐fold in the perinuclear region when compared to those in the distal region. (H) MCI within the volume of each shell increased ~6‐fold in the perinuclear region when compared to the distal compartments. Circles represent mitochondrial volume density and MCI, and squares represent SDHmax. Statistical analyses in hASM cells were based on measurements from n = 10 hASM cells per group from one bronchial sample (patients). hASM, human airway smooth muscle; TD, transmitted light differential interference; MCI, mitochondrial complexity index; NBT, nitroblue tetrazolium diformazan; SDH, succinate dehydrogenase.

Similar articles

Cited by

References

    1. Cecchini G. Function and structure of complex II of the respiratory chain. Annu Rev Biochem. 2003;72:77‐109. - PubMed
    1. Benit P, Goncalves J, El Khoury R, et al. Succinate dehydrogenase, succinate, and Superoxides: a genetic, epigenetic, metabolic, environmental explosive crossroad. Biomedicines. 2022;10:1788. - PMC - PubMed
    1. Rustin P, Munnich A, Rotig A. Succinate dehydrogenase and human diseases: new insights into a well‐known enzyme. Eur J Hum Genet. 2002;10:289‐291. - PubMed
    1. Rutter J, Winge DR, Schiffman JD. Succinate dehydrogenase—assembly, regulation and role in human disease. Mitochondrion. 2010;10:393‐401. - PMC - PubMed
    1. Sieck GC, Sacks RD, Blanco CE, Edgerton VR. SDH activity and cross‐sectional area of muscle fibers in cat diaphragm. J Appl Physiol (1985). 1986;60:1284‐1292. - PubMed

LinkOut - more resources