. 2024 May 3;15(22):8488-8499.
doi: 10.1039/d4sc01575d. eCollection 2024 Jun 5.

Photoswitching of Co(ii)-based coordination cages containing azobenzene backbones

Affiliations

Photoswitching of Co(ii)-based coordination cages containing azobenzene backbones

Max B Tipping et al. Chem Sci. .

Abstract

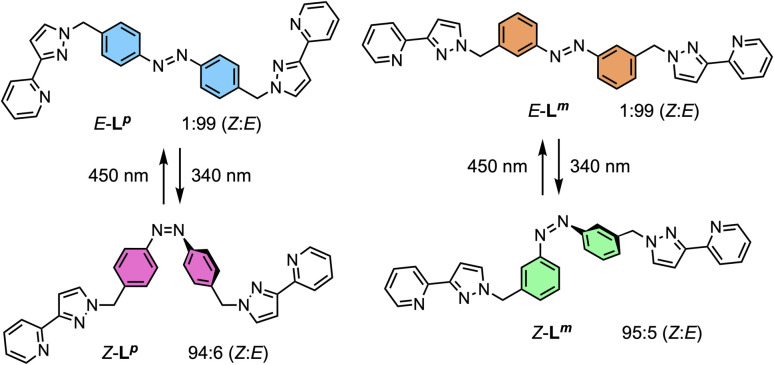
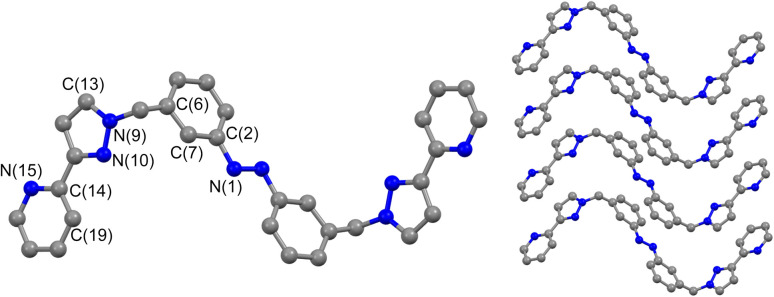
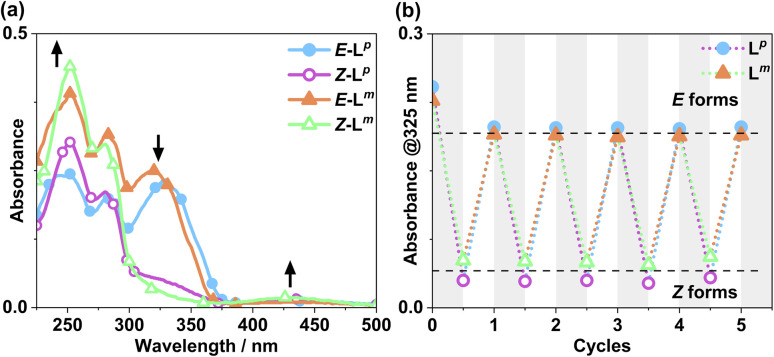
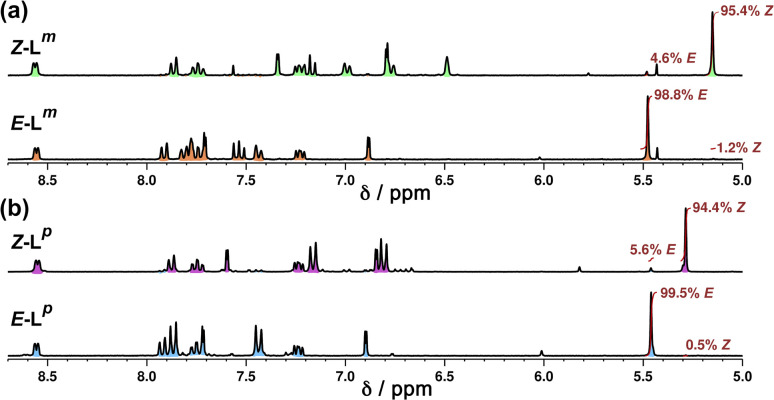
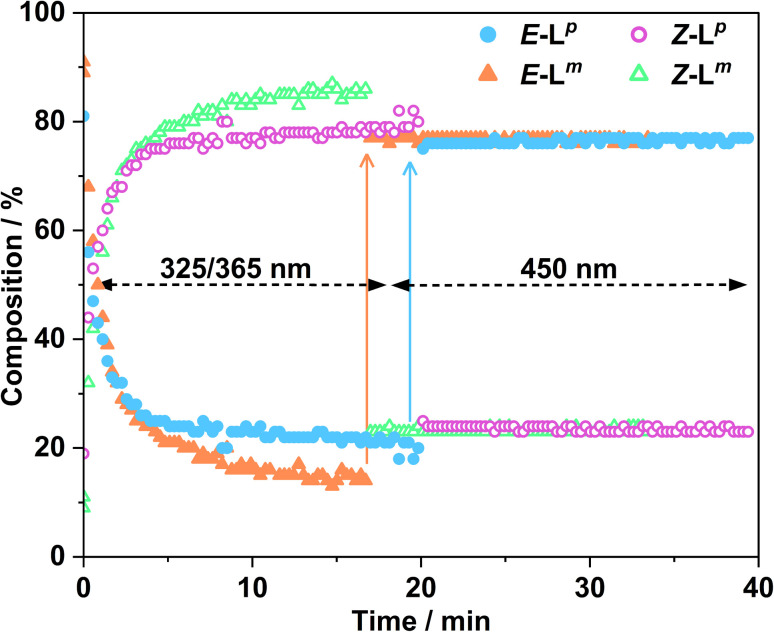
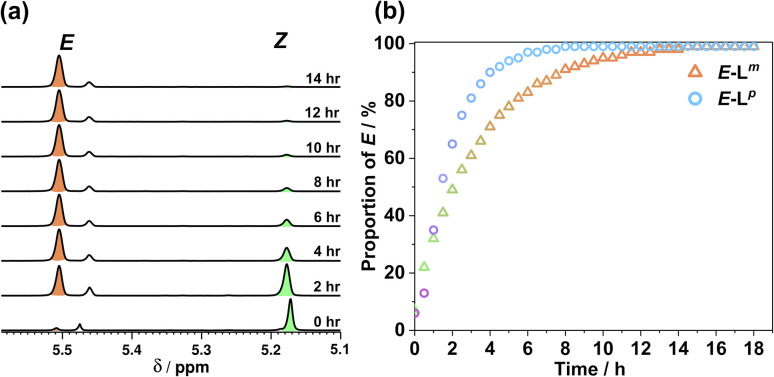
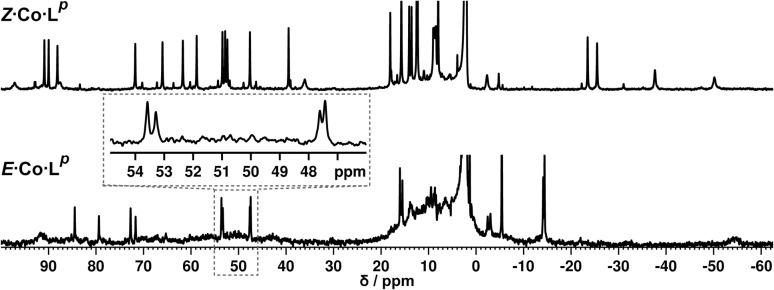
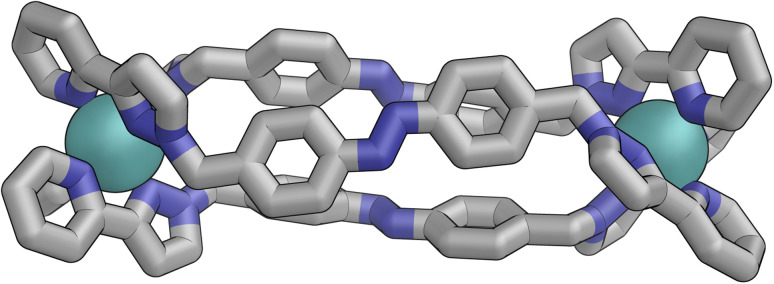
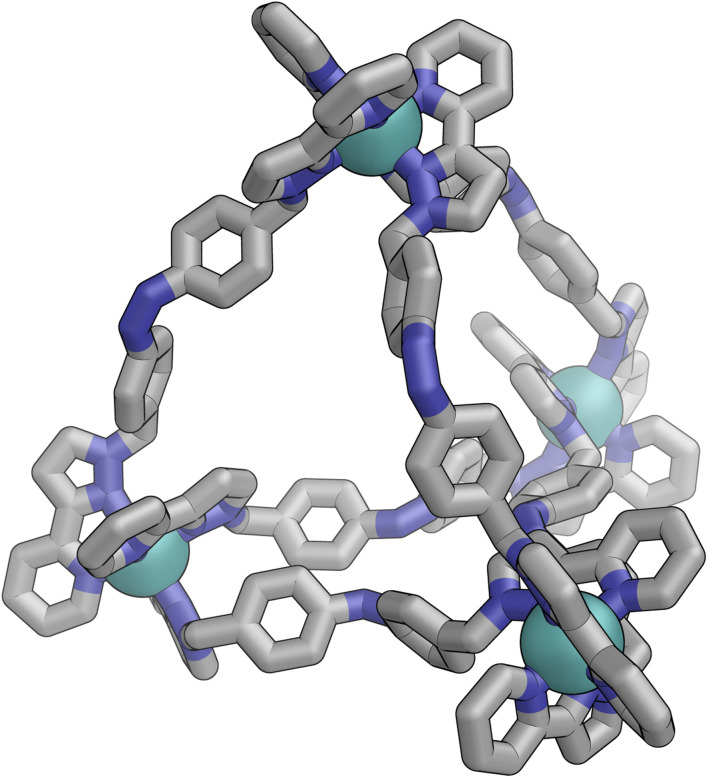
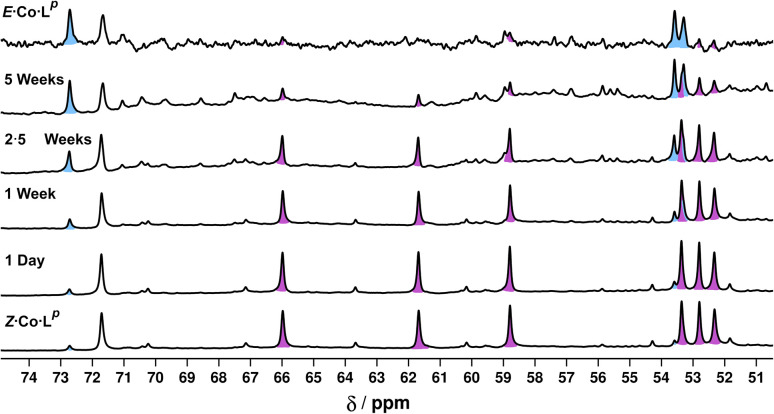
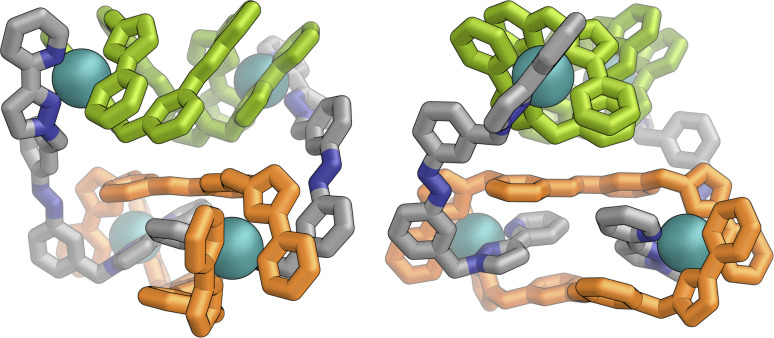
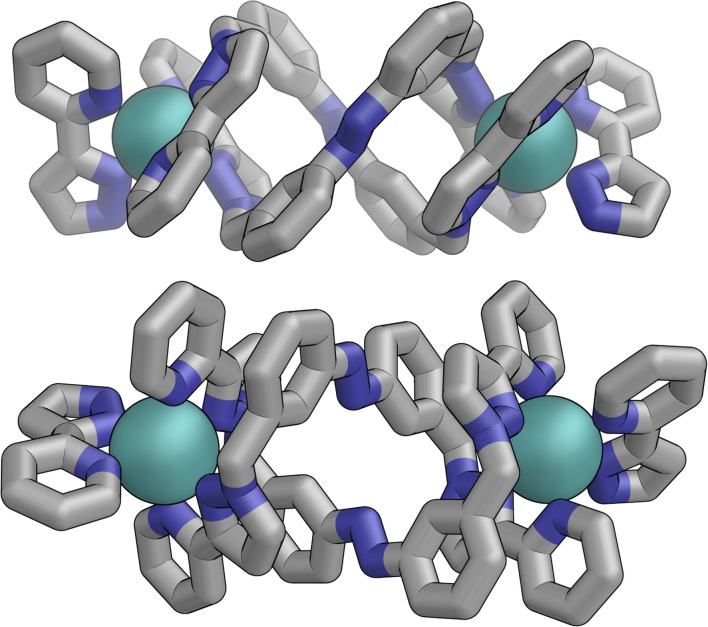
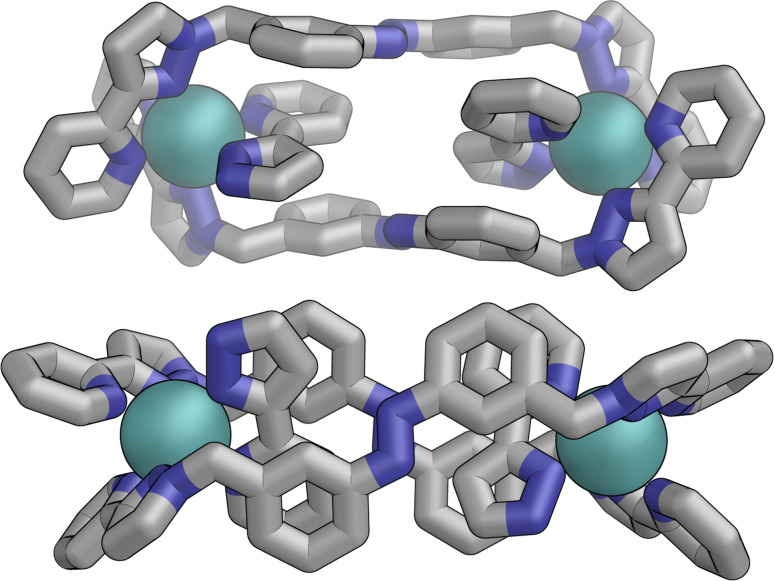
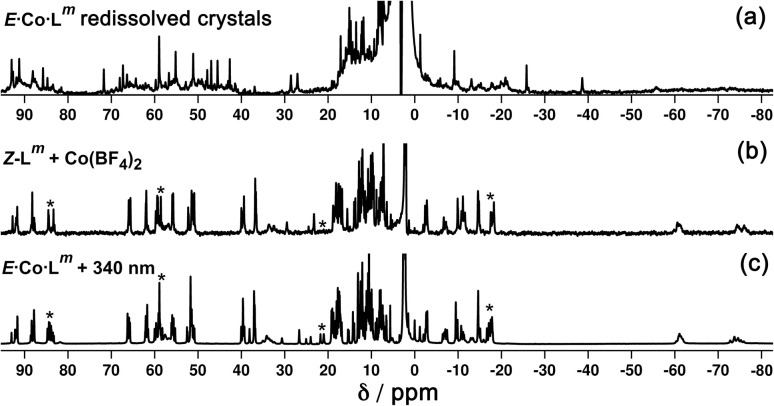
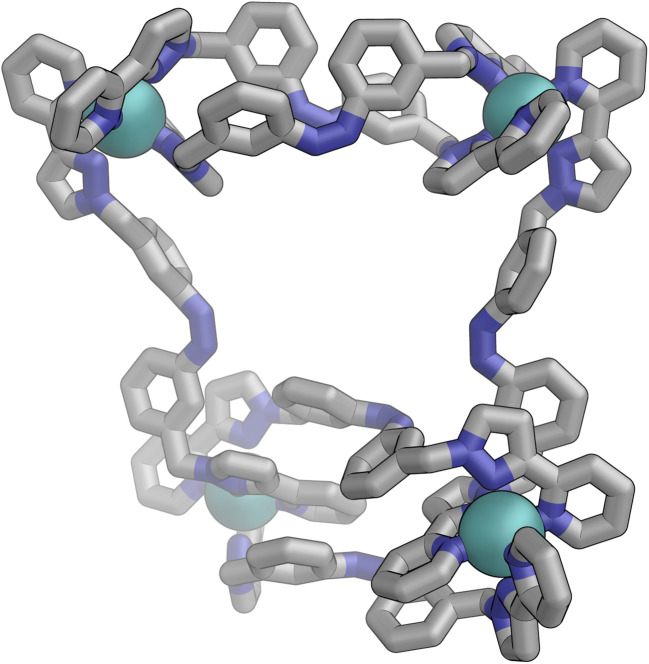
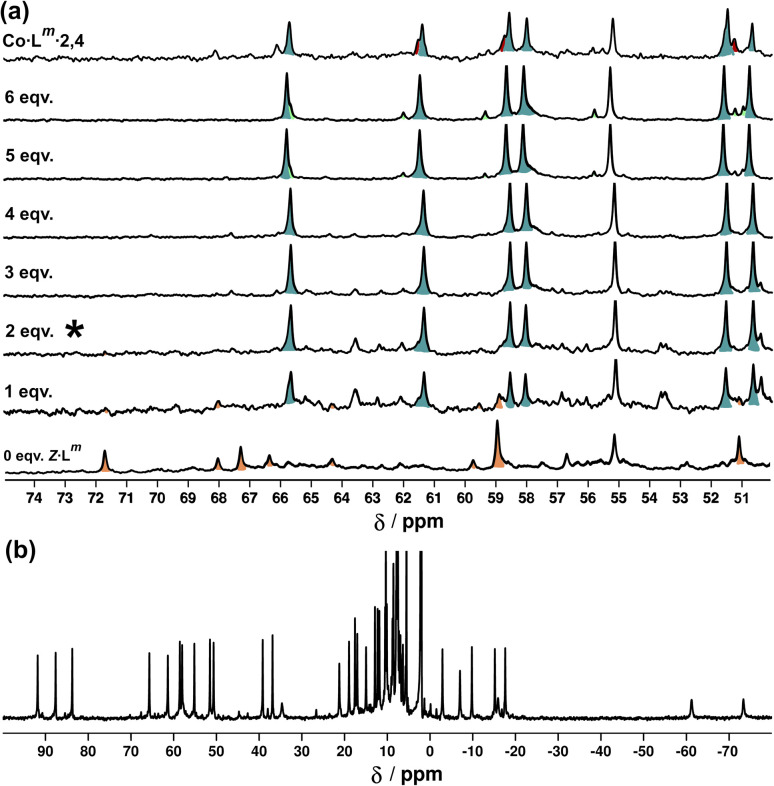
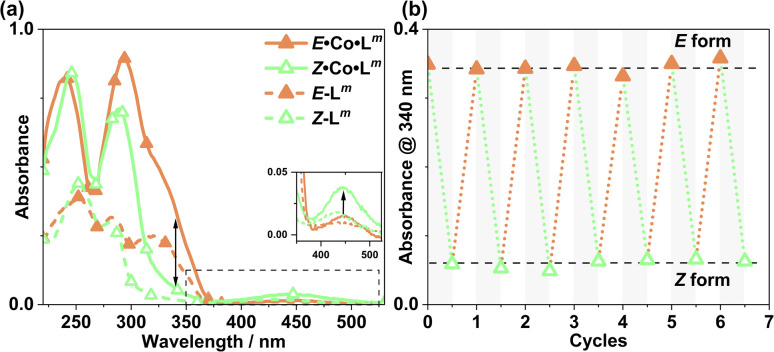
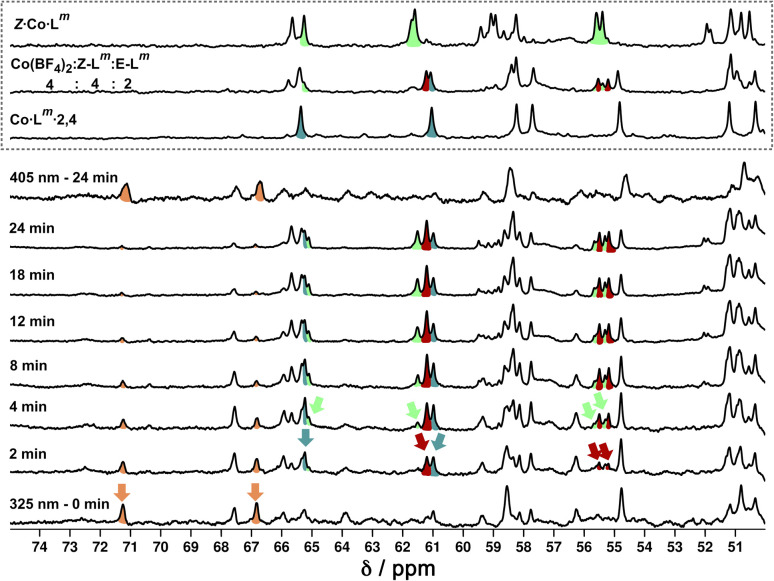
Inclusion of photoswitchable azobenzene units as spacers into ditopic bridging ligands Lm and Lp, containing two chelating pyrazolyl-pyridine termini, allows formation of metal complex assemblies with Co(ii) that undergo a range of light-induced structural transformations. One notable result is the light-induced conversion of a Co2(Lp)3 dinuclear triple helicate (based on the E ligand isomer) to a C 3-symmetric Co4(Lp)6 assembly, assumed to be an edge-bridged tetrahedral cage, based on the Z ligand isomer. Another is the preparation of a series of Co4(Lm)6 complexes, of which Co4(E-Lm)6 was crystallographically characterised and consists of a pair of Co2(Lm)2 double helicates connected by an additional two bridging ligands which span the pair of helicate units, giving a cyclic Co4 array in which one and then two bridging ligands alternate around the periphery. A set of Co4(Lm)6 complexes could be prepared containing different ratios of Z : E ligand isomers (0 : 6, 2 : 4, 4 : 2 and 6 : 0) of which Co4(Z-Lm)2(E-Lm)4 was particularly stable and dominated the speciation behaviour, either during light-induced switching of the ligand geometry in pre-formed complexes, or when ligand isomers were combined in different proportions during the preparation. These examples of (i) interconversion between Co2L3 (helicate) and (ii) Co4L6 (cage) assemblies with Lp, and the interconversion between a series of Co4L6 assemblies Co4(Z-Lm)n(E-Lm)6-n with Lm, constitute significant advances in the field of photoswitchable supramolecular assemblies.


Conflict of interest statement

There are no conflicts to declare.

Figures

Scheme 1
Scheme 1. Ligands used in this paper and their isomeric forms.
Fig. 1
Fig. 1. Molecular structure of Lm from crystallographic data, including the atomic labelling scheme and the packing arrangement.
Fig. 2
Fig. 2. (a) Absorption spectra of 10 μM solutions of Lm and Lp in MeCN, pre (E form) and post (Z form) irradiation with 340 nm light. Arrows indicate changes in absorbance maxima. (b) Switching reversibility experiment monitoring absorbance of each ligand (10 μM) at 325 nm, after alternating irradiation with 340 nm and white light.
Fig. 3
Fig. 3. Stacked 1H NMR spectra (300 MHz, MeCN-d3, 10 μM, 298 K) of (a) Lm and (b) Lp showing changes between E forms (bottom) and predominantly Z forms (top), following photoirradiation at 340 nm, which generates a Z : E mixtures of 95 : 5 (Lm) and 94 : 6 (Lp).
Fig. 4
Fig. 4. Changes in composition of Z/E mixtures of Lp (blue and pink for E and Z isomers, respectively) and Lm (orange and green for E and Z isomers, respectively) measured by in situ illumination 1H NMR (700 MHz, CD3CN, 298 K). A sample of E-Lm (2.0 mM) was irradiated with 325 nm light for ca. 17 minutes to induce the E to Z isomerisation; followed by illumination with 450 nm light for ca. 17 minutes, to switch the ligands back to the E configuration. A sample of E-Lp (2.0 mM) was irradiated with 365 nm light for ca. 20 minutes, with subsequent irradiation with 450 nm light for ca. 20 minutes. In both cases the slow change to the Z isomer during the first 17–20 minutes with the UV irradiation, and then the very fast change back to the E isomer following visible light irradiation, are clear.
Fig. 5
Fig. 5. (a) 1H NMR spectra (400 MHz, CD3CN, 338 K) indicating the change in the methylene proton signals of (predominantly) Z-Lm peaks following heating at 65 °C in CD3CN to effect thermal relaxation back to E-Lm; (b) proportion of E-Lm and E-Lp with time during this heating process.
Fig. 6
Fig. 6. (Top) 1H NMR spectrum (300 MHz, CD3CN, 298 K) of Z·Co·Lp, prepared by irradiation at 340 nm of a solution of E·Co·Lp. (Bottom) 1H NMR spectrum (300 MHz, CD3CN, 298 K) of E·Co·Lp. An expansion of the 47–54 ppm region makes clear the presence of two closely-spaced signals: this is also apparent in the signal at −14 ppm.
Fig. 7
Fig. 7. MM2-optimised model of E·Co·Lp showing a dinuclear, triple-helicate with D3 symmetry.
Fig. 8
Fig. 8. 19F NMR spectra (400 MHz, CD3CN, 298 K) of (bottom) Zn(BF4)2 showing the presence of only one anion environment (the two separate signals arise from the 10B and 11B isotopomers which give slightly different chemical shifts for attached 19F atoms); (middle) E·Zn·Lp showing by the extra splitting the presence of two BF4 anion environments in the complex; and (top) Z·Zn·Lp showing the presence of only one anion environment.
Fig. 9
Fig. 9. GFN-xTB generated structure of the C3 symmetric M4L6 tetrahedral cage Z·Co·Lp. The structure contains two distinct ligand environments, with one ligand environment spanning fac (top metal ion in Figure) and mer (other three metal ions at base of Figure) metal vertices, and the other spanning two mer vertices but with no internal symmetry due to the cage chirality.
Fig. 10
Fig. 10. (a) UV/Vis spectra of E·Co·Lp and Z·Co·Lp (MeCN, 13 μg ml−1), as well as E-Lp and Z-Lp (MeCN, 10 μM). (b) Switching stability experiment monitoring the absorbance at 340 nm [black arrow in part (a)] of a 13 μg ml−1 sample after alternating irradiation with 340 nm for 30 minutes and then white light for 30 minutes, to switch between E·Co·Lp and Z·Co·Lp complexes.
Fig. 11
Fig. 11. Photoswitching of a solution of E·Co·Lp to Z·Co·Lp and back, using 365 nm and then 405 nm irradiation respectively, monitored by in situ1H NMR spectroscopy (700 MHz, CD3CN, 298 K); see main text. The light blue trace shows the initial solution containing 3 : 97 Z : E complexes converting over several minutes to a PSS containing ca. 90 : 10 Z : E forms under UV irradiation, followed by rapid conversion back to the starting composition under 405 nm light excitation.
Fig. 12
Fig. 12. Series of 1H NMR spectra (400 MHz, CD3CN, RT) showing the slow thermal conversion of Z·Co·Lp (bottom spectrum) back to E·Co·Lp (top spectrum) over 5 weeks. The top and bottom spectra match those in Fig. 6.
Fig. 13
Fig. 13. Two views of the molecular structure of the M4L6 complex cation of E·Co·Lm from an X-ray crystal structure determination, with different types of ligand environment highlighted in green or orange (within the two M2L2 helicate units), or grey (cross-linking the two helicate units).
Fig. 14
Fig. 14. Structure of the M2L2 double-helicate unit coloured green in Fig. 13, with approximate (non-crystallographic) C2 internal symmetry in which the two ligands are essentially identical but conformational details two ends of each ligand are different (i.e. both adopt the same ‘head to tail’ arrangement within the M2L2 unit).
Fig. 15
Fig. 15. Structure of the M2L2 double-helicate unit coloured orange in Fig. 14, with each ligand having approximate (non-crystallographic) C2 internal symmetry with each end the same: the two ligands are essentially identical, giving local D2 symmetry for the M2L2 unit.
Fig. 16
Fig. 16. 1H NMR spectra (300 MHz, CD3CN, 298 K) of (a) redissolved crystals of E·Co·Lm; (b) Z·Co·Lm prepared by combination of Z-Lm with Co(BF4)2; and (c) Z·Co·Lm prepared by irradiation of a sample of E·Co·Lm at 340 nm. Comparison of signals labelled * between parts (b) and (c) show additional complexity in the spectrum of the sample generated by photoswitching.
Fig. 17
Fig. 17. GFN-xTB generated structure of the M4L6 complex cation of Z·Co·Lm comprising two M2L2 helicate units joined by two cross-linking ligands, with no internal symmetry.
Fig. 18
Fig. 18. (a) 1H NMR spectra [300 MHz, MeCN-d3/CDCl3 (85 : 15 v/v), 298 K] recorded during addition of 0–6 equivalents (from bottom up) of Z-Lm to a solution of E·Co·Lm. The spectrum labelled * (after addition of two equivalents of Z-Lm) signals the point at which Co·Lm·2,4 is the dominant species present with little change thereafter. (b) 1H-NMR spectrum (300 MHz, MeCN-d3/CDCl3 (85 : 15 v/v), 298 K) of Co·Lm·2,4 prepared separately in the same solvent mixture – compare the 50–70 ppm region with the spectrum labelled * in Fig. 18a.
Fig. 19
Fig. 19. (a) UV/Vis spectra of Z·Co·Lm and E·Co·Lm in MeCN (20 μg ml−1), as well as E-Lp and Z-Lp (MeCN, 10 μM). (b) Switching stability experiment monitoring the absorbance of Co·Lm (20 μg ml−1) species at 340 nm, after alternating irradiation with 340 nm for 30 minutes and white light for 30 minutes.
Fig. 20
Fig. 20. 1H NMR (700 MHz, CD3CN, 298 K) spectral changes during illumination of E·Co·Lm (orange) with 325 nm light for 24 minutes, with subsequent illumination with 405 nm light for 24 minutes. Characteristic spectra of Z·Co·Lm (green) and Co·Lm·2,4 (teal blue) prepared by combination of stoichiometric quantities of Z and E-Lm with Co(BF4)2, are shown for comparison. A third spectrum prepared by combination of Z-Lm, E-Lm and Co(BF4)2 in a 4 : 2 : 4 ratio shows the presence of a fourth species (red) amongst signals associated with Z·Co·Lm and Co·Lm·2,4. For discussion of signals labelled with coloured arrows, see main text.

Similar articles

References

    1. Cook T. R. Stang P. J. Chem. Rev. 2015;115:7001. doi: 10.1021/cr5005666. - DOI - PubMed
    2. Smulders M. M. J. Riddell I. A. Browne C. Nitschke J. R. Chem. Soc. Rev. 2013;42:1728. doi: 10.1039/C2CS35254K. - DOI - PubMed
    3. Zhang D. Ronson T. K. Nitschke J. R. Acc. Chem. Res. 2018;51:2423. doi: 10.1021/acs.accounts.8b00303. - DOI - PubMed
    4. Vardhan H. Yusubov M. Verpoort F. Coord. Chem. Rev. 2016;306:171. doi: 10.1016/j.ccr.2015.05.016. - DOI
    5. Percástegui E. G. Ronson T. K. Nitschke J. R. Chem. Rev. 2020;120:13480. doi: 10.1021/acs.chemrev.0c00672. - DOI - PMC - PubMed
    6. Rizzuto F. J. von Krbek L. K. S. Nitschke J. R. Nat. Rev. Chem. 2019;3:204. doi: 10.1038/s41570-019-0085-3. - DOI
    7. Ronson T. K. Meng W. Nitschke J. R. J. Am. Chem. Soc. 2017;139:9698. doi: 10.1021/jacs.7b05202. - DOI - PubMed
    8. Taylor C. G. P. Argent S. P. Ludden M. D. Piper J. R. Mozaceanu C. Barnett S. A. Ward M. D. Chem.–Eur. J. 2020;26:3054. doi: 10.1002/chem.201905499. - DOI - PMC - PubMed
    9. Cullen W. Turega S. Hunter C. A. Ward M. D. Chem. Sci. 2015;6:2790. doi: 10.1039/C5SC00534E. - DOI - PMC - PubMed
    1. Cullen W. Turega S. Hunter C. A. Ward M. D. Chem. Sci. 2015;6:625–631. doi: 10.1039/C4SC02090A. - DOI - PMC - PubMed
    1. Szalóki G. Croué V. Carré V. Aubriet F. Alévêque O. Levillain E. Allain M. Aragó J. Ortí E. Goeb S. Sallé M. Angew. Chem., Int. Ed. 2017;56:16272–16276. doi: 10.1002/anie.201709483. - DOI - PubMed
    1. Wezenberg S. J. Chem. Lett. 2020;49:609. doi: 10.1246/cl.200076. - DOI
    2. Benchimol E. Tessarolo J. Clever G. H. Nat. Chem. 2024;16:13. doi: 10.1038/s41557-023-01387-8. - DOI - PubMed
    1. Qu D.-H. Wang Q.-C. Zhang Q.-W. Ma X. Tian H. Chem. Rev. 2015;115:7543–7588. doi: 10.1021/cr5006342. - DOI - PubMed
    2. Wezenberg S. J. Chem. Commun. 2022;58:11045. doi: 10.1039/D2CC04329G. - DOI - PMC - PubMed
    3. Ghosh A. Slappendel L. Nguyen B.-N. T. von Krbek L. K. S. Ronson T. K. Castilla A. M. Nitschke J. R. J. Am. Chem. Soc. 2023;145:3828. doi: 10.1021/jacs.2c10084. - DOI - PMC - PubMed