. 2024 May 2;15(22):8390-8403.
doi: 10.1039/d3sc06749a. eCollection 2024 Jun 5.

Accessing the electronic structure of liquid crystalline semiconductors with bottom-up electronic coarse-graining

Affiliations

Accessing the electronic structure of liquid crystalline semiconductors with bottom-up electronic coarse-graining

Chun-I Wang et al. Chem Sci. .

Abstract

Understanding the relationship between multiscale morphology and electronic structure is a grand challenge for semiconducting soft materials. Computational studies aimed at characterizing these relationships require the complex integration of quantum-chemical (QC) calculations, all-atom and coarse-grained (CG) molecular dynamics simulations, and back-mapping approaches. However, these methods pose substantial computational challenges that limit their application to the requisite length scales of soft material morphologies. Here, we demonstrate the bottom-up electronic coarse-graining (ECG) of morphology-dependent electronic structure in the liquid-crystal-forming semiconductor, 2-(4-methoxyphenyl)-7-octyl-benzothienobenzothiophene (BTBT). ECG is applied to construct density functional theory (DFT)-accurate valence band Hamiltonians of the isotropic and smectic liquid crystal (LC) phases using only the CG representation of BTBT. By bypassing the atomistic resolution and its prohibitive computational costs, ECG enables the first calculations of the morphology dependence of the electronic structure of charge carriers across LC phases at the ∼20 nm length scale, with robust statistical sampling. Kinetic Monte Carlo (kMC) simulations reveal a strong morphology dependence on zero-field charge mobility among different LC phases as well as the presence of two-molecule charge carriers that act as traps and hinder charge transport. We leverage these results to further evaluate the feasibility of developing mesoscopic, field-based ECG models in future works. The fully CG approach to electronic property predictions in LC semiconductors opens a new computational direction for designing electronic processes in soft materials at their characteristic length scales.


Conflict of interest statement

There are no conflicts to declare.

Figures

Fig. 1
Fig. 1. Workflow depicting the bottom-up CG models (top-left panel), ECG models (bottom-left panel), and the morphology-dependent electronic Hamiltonian (right panel). Gray arrows illustrate the bottom-up CG model development process. Blue arrows outline the workflow, encompassing data set creation, ML model training, and the prediction of electronic observables for a given CG configuration. The inset illustrates the architecture of deep kernel learning (DKL), incorporating a feed-forward neural network (FNN), a variational layer, and Gaussian process regression (GPR). The orange arrow signifies that Hamiltonians are sampled from the ECG-predicted Gaussian distribution.
Fig. 2
Fig. 2. Structural characterization of the CG isotropic, smectic A, and smectic E phases: (a) number density distribution of the center of mass along y-axis, (b) structure factor distributions, (c) nematic order parameters of the molecular long-axis as a function of characterization radius, (d) snapshots of CG morphology, where the dashed line and solid line represent the principal director and the layer normal, respectively, and (e) representative snapshots of BTBT local packing structure within the smectic layers extracted from AA MD simulations. The analyses depicted in (a)–(d) are conducted on a system comprising 9000 BTBT molecules across the three specified temperatures. The molecular long-axis for the nematic order parameter analysis is determined by the moment of inertia of each BTBT molecule at CG resolution.
Fig. 3
Fig. 3. Evaluation of the DKL-ECG models for predicting HOMO energy (left panels) and HOMO–HOMO electronic coupling (right panels). The mean values of HOMO energy predicted by the DKL-ECG models are compared with values obtained through DFT calculations across the (a) testing-isotropic, (c) testing-smectic A, and (e) testing-smectic E data sets. The right panels assess HOMO–HOMO electronic coupling predictions, utilizing DFT calculations as benchmarks, and contrasting values derived from the DKL-predicted mean and a FNN sign classifier, for the (b) testing-isotropic (d) testing-smectic A, and (f) testing-smectic E data sets. The heatmap visually represents the density of data points. The DKL-ECG model for HOMO energy prediction was trained on the training-isotropic data set. ECG for electronic coupling predictions are derived from the DKL regression model trained on the training-smectic A data set and the FNN classification model trained on the training-isotropic data set. Detailed evaluations of these ECG models are discussed in the ESI.
Fig. 4
Fig. 4. (a) Histograms of the number of charge delocalized molecules (IPR value), and the corresponding IPR value distribution plotted against CT state energy across 9000 CT states for (b) the isotropic phase, (c) smectic A phase, and (d) smectic E phase. Orange, blue, and green masks highlight CT states with IPR > 3, IPR ∼ 2, and IPR ∼ 1, respectively. The heatmap provides a visual representation of the data point density. The histograms represent averages over the 2400 Hamiltonians for each LC phase.
Fig. 5
Fig. 5. Schematic representations detailing the statistical analyses of structural and electronic features related to (a) all molecules adjacent to the charge center within the characteristic radius, (b) nearest neighbor molecules surrounding the charge center, and (c) the molecular network excluding the charge center within the characteristic radius. Radar charts depict the mean values of the structural and electronic features in the (d) isotropic, (e) smectic A, and (f) smectic E phase. The characteristic radius of 13 Å is chosen to achieve two objectives: first, to allow for the quantification of network properties like network coupling and network π–π-stacking strength, which require a minimum of two molecular shells for statistically significant analysis; second, to accommodate the variability in the size of the first molecular shell observed across different LC phases.
Fig. 6
Fig. 6. Zero-field charge mobilities along the three Cartesian coordinates (μx, μy, and μz) for isotropic, smectic A, and smectic E phases obtained through rejection-free kMC simulations. Error bars represent the standard deviation of the mobility obtained from 100 CG configurations.
Fig. 7
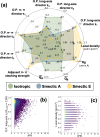
Fig. 7. (a) Radar charts illustrating the mean values of field-based descriptors in isotropic and smectic phases, where the descriptors include O. P. long-axis εi, representing the ith eigenvalue of the nematic order tensor aligned with the BTBT long axis; O. P. π–π director εi, signifying the eigenvalue based on the π–π direction; 4 and 6, denoting the 4-fold and 6-fold Steinhardt order parameters, respectively; and Rg, corresponding to the radius of gyration of BTBT molecules, and (b) correlation between local nematic order parameter (O. P. long-axis ε1) and IPR, (c) correlation between local density and IPR.

References

    1. Hong G. Gan X. Leonhardt C. Zhang Z. Seibert J. Busch J. M. Bräse S. Adv. Mater. 2021;33:2005630. doi: 10.1002/adma.202005630. - DOI - PubMed
    1. Shi Y.-Z. Wu H. Wang K. Yu J. Ou X.-M. Zhang X.-H. Chem. Sci. 2022;13:3625–3651. doi: 10.1039/D1SC07180G. - DOI - PMC - PubMed
    1. Luo D. Jang W. Babu D. D. Kim M. S. Wang D. H. Kyaw A. K. K. J. Mater. Chem. A. 2022;10:3255–3295. doi: 10.1039/D1TA10707K. - DOI
    1. Bernardo G. Lopes T. Lidzey D. G. Mendes A. Adv. Energy Mater. 2021;11:2100342. doi: 10.1002/aenm.202100342. - DOI
    1. Liu K. Ouyang B. Guo X. Guo Y. Liu Y. npj Flexible Electron. 2022;6:1–19. doi: 10.1038/s41528-022-00133-3. - DOI