. 2024 Apr 26;35(2):102202.
doi: 10.1016/j.omtn.2024.102202. eCollection 2024 Jun 11.

Aberrant spliceosome activity via elevated intron retention and upregulation and phosphorylation of SF3B1 in chronic lymphocytic leukemia

Affiliations

Aberrant spliceosome activity via elevated intron retention and upregulation and phosphorylation of SF3B1 in chronic lymphocytic leukemia

Manoj Kumar Kashyap et al. Mol Ther Nucleic Acids. .

Abstract

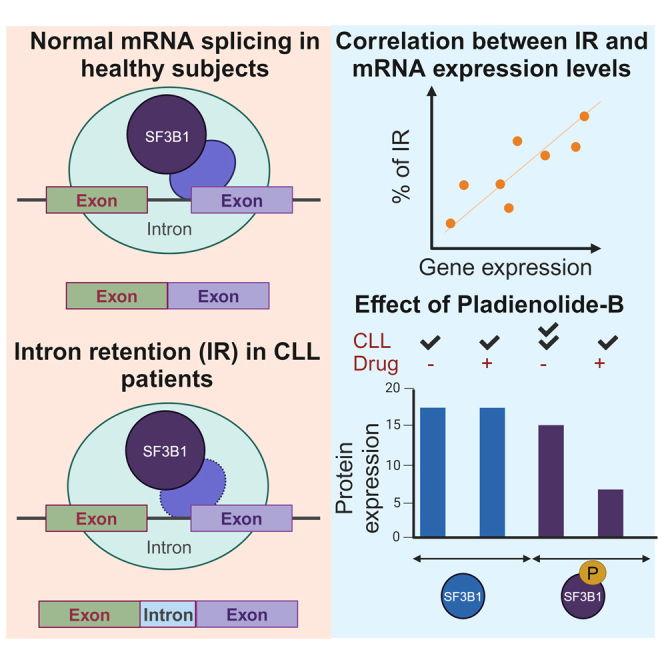
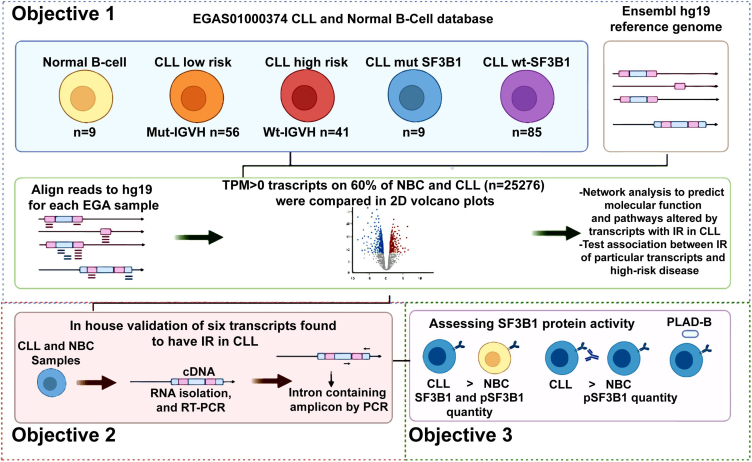
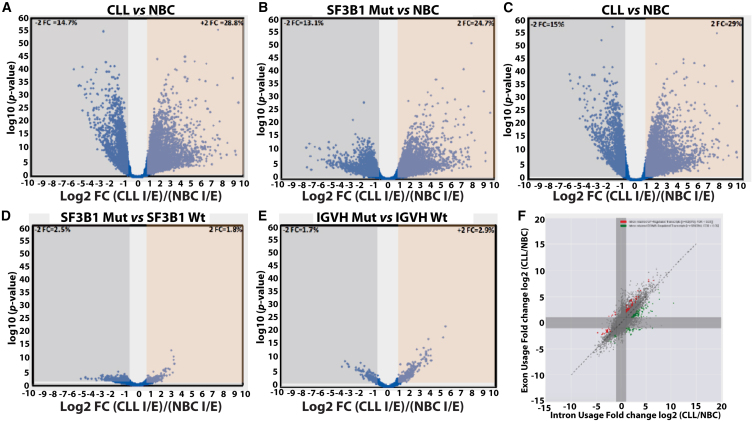
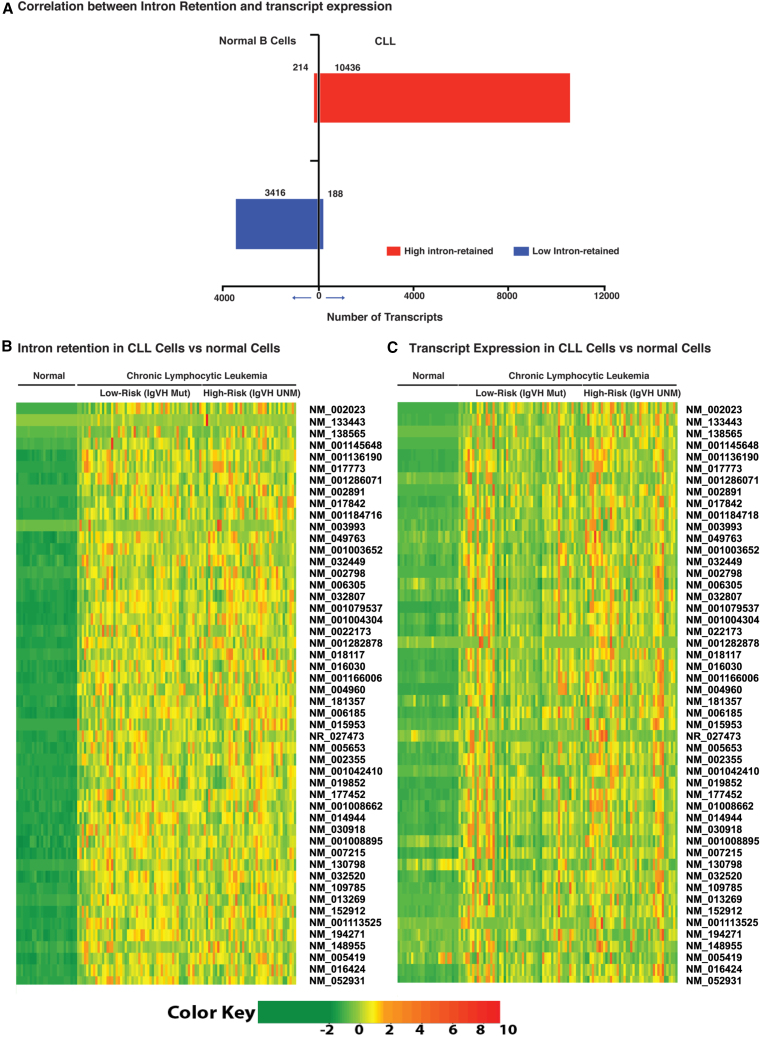
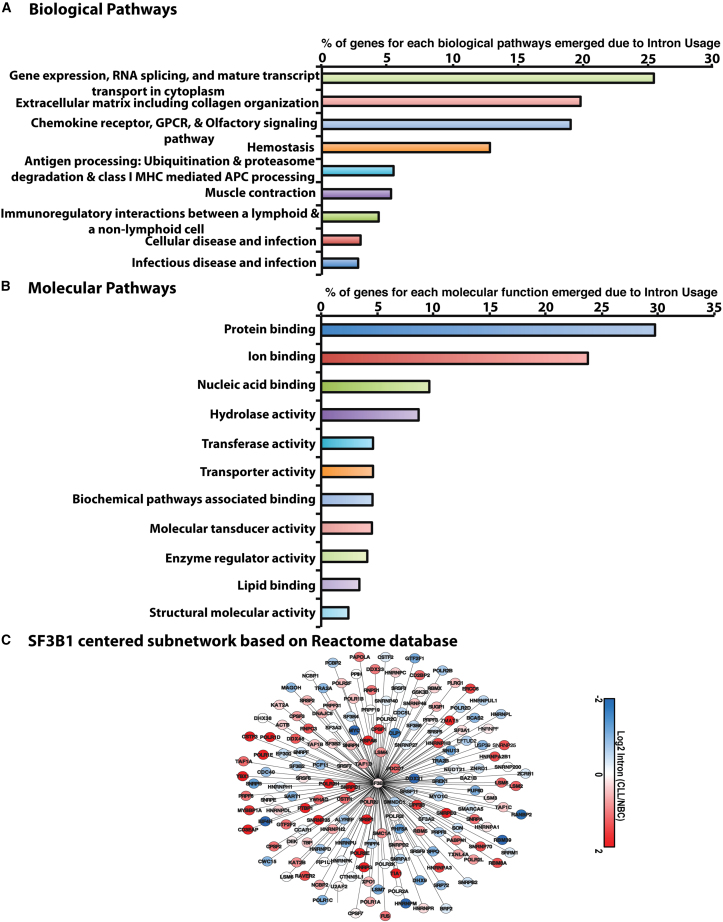
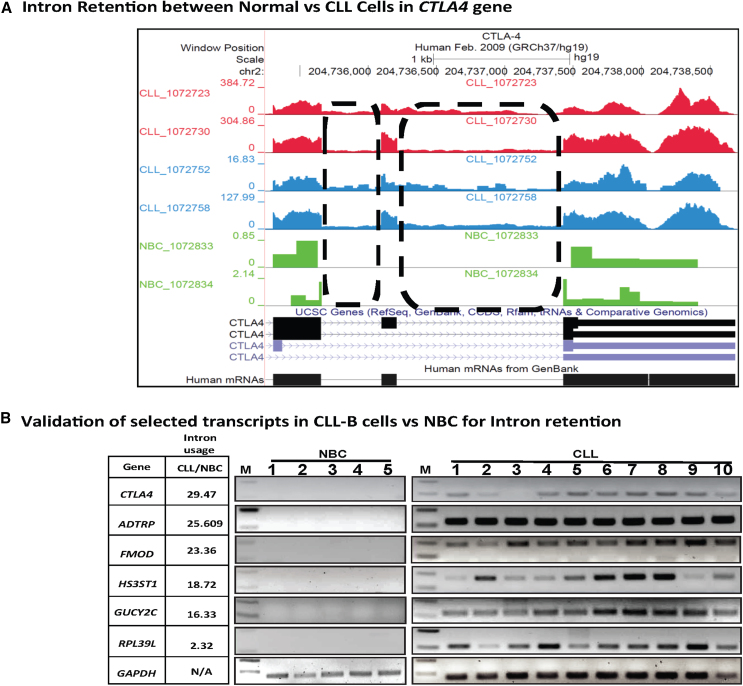
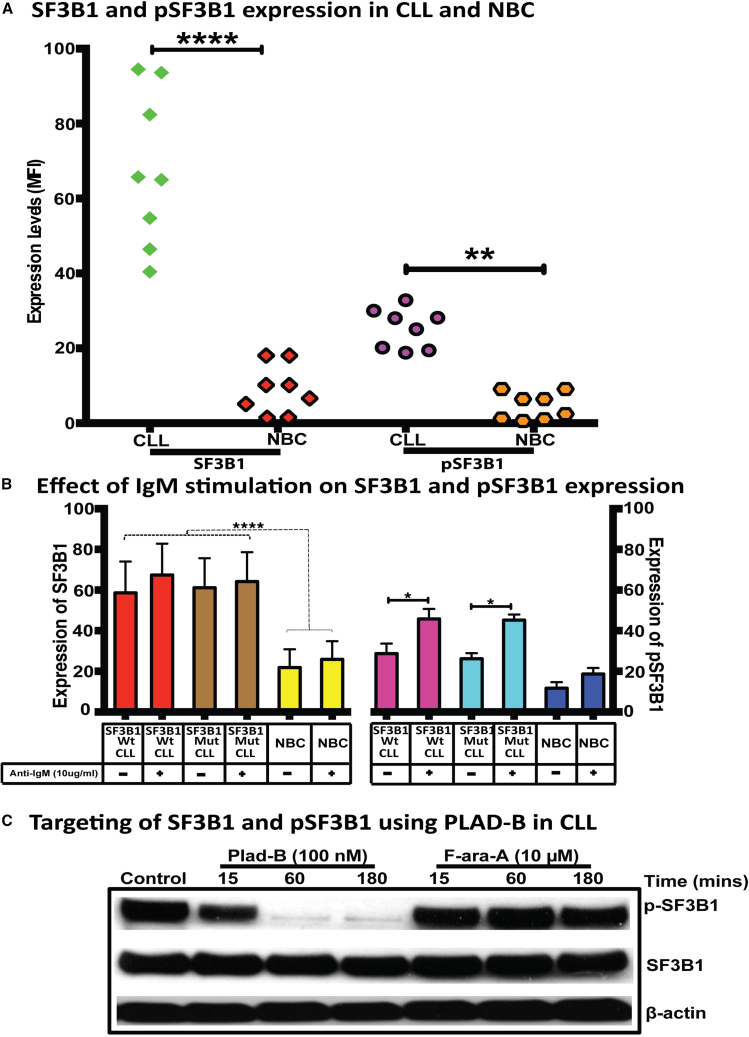
Splicing factor 3b subunit 1 (SF3B1) is the largest subunit and core component of the spliceosome. Inhibition of SF3B1 was associated with an increase in broad intron retention (IR) on most transcripts, suggesting that IR can be used as a marker of spliceosome inhibition in chronic lymphocytic leukemia (CLL) cells. Furthermore, we separately analyzed exonic and intronic mapped reads on annotated RNA-sequencing transcripts obtained from B cells (n = 98 CLL patients) and healthy volunteers (n = 9). We measured intron/exon ratio to use that as a surrogate for alternative RNA splicing (ARS) and found that 66% of CLL-B cell transcripts had significant IR elevation compared with normal B cells (NBCs) and that correlated with mRNA downregulation and low expression levels. Transcripts with the highest IR levels belonged to biological pathways associated with gene expression and RNA splicing. A >2-fold increase of active pSF3B1 was observed in CLL-B cells compared with NBCs. Additionally, when the CLL-B cells were treated with macrolides (pladienolide-B), a significant decrease in pSF3B1, but not total SF3B1 protein, was observed. These findings suggest that IR/ARS is increased in CLL, which is associated with SF3B1 phosphorylation and susceptibility to SF3B1 inhibitors. These data provide additional support to the relevance of ARS in carcinogenesis and evidence of pSF3B1 participation in this process.

Keywords: CLL; E7107; MT: RNA/DNA Editing; RNA splicing; RNA-seq; SF3B1; alternative RNA splicing; intron retention; intron usage; macrolide; pladienolide-B; spliceosome.


Conflict of interest statement

The authors declare no competing interests.

Figures

None
Graphical abstract
Figure 1
Figure 1
The workflow for RNA-seq analysis for IR study in CLL vs. NBC For studying the global IR pattern between CLL vs. NBC, the RNA-seq data obtained from EGA was processed for analysis after alignment with the reference genome hg19. The transcripts with >0 TPM values were selected if those were detected in at least 60% of the population. A comparative analysis of IR between different CLL cell subtypes vs. NBCs was done. Further biological pathways and molecular function were studies using PANTHER. An SF3B1 centric subnetwork was constructed to study if there are involvements of genes/transcripts in RNA splicing. A selected number of transcripts to show IR were validated using cDNA derived from CLL cells and NBC (synthesized from total RNA treated with DNaseI to remove the DNA contamination) after subjecting to RT-PCR followed by agarose gel electrophoresis. SF3B1 and pSF3B1 profiling was done after IgM stimulation of CLL and NBCs. Further, the effect of macrolide PLAD-B and fludarabine (F-ara-A) was studied in vitro on CLL cells after treatment for different time points. The protein was isolated after cell lysis and after SDS-PAGE; the protein was transferred on the membrane for detection of SF3B1, pSF3B1, and loading control (β-actin).
Figure 2
Figure 2
RNA-sequencing analysis for global intron retention in CLL vs. normal B cells and correlation with transcript expression RNA-seq analysis was conducted on sequences obtained from the EGA data derived from CLL samples (n = 97 including high risk = 41, low risk = 56) and normal B cells (n = 9 from healthy controls in triplicate). (A–E) Volcano plot displaying the differential intron retention log2 ratios TPM (intron/exon) in different combinations including (A) CLL-B cells and NBCs (CLL-B vs. NBC). The scatterplot shows 14811 transcripts for intron retention between CLL-B cells vs. NBCs. (B) CLL-B cells carrying Mut-SF3B1 and NBC (Mut-SF3B1 vs. NBC). (C) CLL-B cells carrying Wt-SF3B1 and NBC (Wt-SF3B1 vs. NBC). (D) CLL-B cells carrying Mut-SF3B1 and CLL-B cells carrying Wt-SF3B1 (Mut-SF3B1 vs. Wt-SF3B1). (E) CLL-B cells carrying Mut-IgVH and CLL-B cells carrying Wt-IgVH (Mut-IgVH vs. Wt-IgVH). The bottom black line represents the diagonal regression line where intron retention ratios are equal in both samples compared. (F) Further, the data were presented in form of a quadrant between CLL-B cells vs. NBCs to show the distribution of ratio of intronic and exonic TPM values for 14,811 transcripts.
Figure 3
Figure 3
The correlation between intron retention and transcript expression in various cell types (A) A total of 16,725 transcripts that were accumulated differentially used-intron respectively in CLL (set-I) and NBC (set-II) at p ≤ 0.05 (FDR = 5%) and among those the three subsets each of the sets corresponding to over-expressed (set-IA, set-IIA), under-expressed (set-IB, set-IIB), and non-differentially expressed (set- IC, set-IIC) transcripts consequently found in CLL and NBC at p < 0.05 (FDR = 5%). The chi-square p value for the 2 × 3 table is ≤1.0e−300. The bar graph represents two sets of bars, each for a fraction of high intron used in CLL (set-I) and NBC (set-II) cases. It is associated with upregulated (set-IA, set-IIA) and downregulated (set-IB, set-IIB) at transcription level. The 2 × 2 contingency table shows significant p value <1.0e−300 and ODDs = 886. (B) The Heatmap Z scores of TPM values for sample-wise intron retention in NBC and CLL from each of the top 200 transcripts selected based on high intron retention in CLL with fulfilling condition CLL > NBC at p < 0.05; FDR = 5%. (C) The Heatmap Z scores of TPM values for sample-wise transcripts expression in NBC and CLL from each of the top 200 transcripts selected based on high intron retention in CLL with fulfilling condition CLL > NBC at p < 0.05; FDR = 5%.
Figure 4
Figure 4
Biological pathway, molecular functions, and network analysis based on intron retention (A) For biological pathway analysis, we took the top 25% of transcripts with high intron retention in CLL as compared with normal B cells (p < 0.05, FDR = 0.1). The gene symbols for corresponding transcripts were used as input and subjected for Reactome Pathway. The p value was adjusted using a Bonferroni correction. The x axis shows the % of the genes enriched and y axis shows the description of the pathways. (B) Molecular function analysis was done for the top 25% of transcripts with high intron retention CLL/NBC Network analysis by selecting transcripts with high intron retention in CLL as compared with normal B cells using WebGestalt. The height of the bar represents the % of genes observed in the category. (C) Subnetwork centered on SF3B1 and its first neighbors. The SF3B1 centered subnetwork was based on Reactome FI network database and cytoscape V3.4 was used to identify the first neighbors of SF3B1. Nodes and links represent genes and functional interactions, respectively. The color of each node scale with log2 intron retention ratio in CLL cells vs. NBCs as indicated in the scale at the bottom.
Figure 5
Figure 5
Selection and validation of transcripts for intron retention using RT-PCR (A) RNA-seq read mapping (tracks) of the CTLA4 gene from the UCSC reference genome (hg19), six representative samples belonging to high- or low-risk CLL cells, or normal B cells are shown. The intron retention tracks are shown in green (for normal B cells), blue (low-risk CLL), and red (high-risk CLL) colors. It is clear that the reads map to the intronic region of CTLA4 transcript as annotated in the UCSC database. The absolute read counts for each sample are indicated on the y axis. (B) For validation, RNA was isolated from pure CLL-B cells or NBC and after DNase I digestion cDNA was prepared. Selected intronic region for assessment of intron retention were amplified using RT-PCR for PPP2R5B, ADTRP, RPL39L, HS3ST1, CTLA4, FMOD, and GUCY2C transcripts. GAPDH was used as control for normalization/loading of RNA.
Figure 6
Figure 6
Effect of IgM stimulation on SF3B1 and pSF3B1 expression in normal and CLL cells (A) Normal B cells or CLL-B cells were stained for intracellular staining using anti-SF3B1 and anti-phospho-SF3B1 antibodies for total and phospho-SF3B1 protein using flow cytometry. (B) Normal B cells or CLL-B cells were stimulated with anti-IgM (10 μg/mL) for 15 min followed by intracellular staining using anti-SF3B1 and anti-phospho-SF3B1 antibodies for total and phospho-SF3B1 using flow cytometry. All the samples were run in duplicate and the data are presented with the means and their respective SDs. Statistical significance was determined by using Bonferroni correction test for multiple comparison test, where ∗, ∗∗, ∗∗∗, ∗∗∗∗ represent p < 0.05, p < 0.01, p < 0.001, and p < 0.0001, respectively. (C) A total of 5 million CLL-B cells were incubated overnight and treated with 100 nM of Pladienolide-B (PLAD-B) or 10 μM of Fludarabine (F-ara-A) for 15, 60, and 180 min. Post-incubation of splicing modulators or chemotherapy, cells were harvested and lysed using modified RIPA. A total of 200 μg of protein was run on SDS-PAGE and subjected for western blot. Antibodies against SF3B1, and phospho-SF3B1 were used for assessing total and phospho-SF3B1 levels. β-actin was used as a loading control, while cells incubated in media only were used as the negative control (−).

Similar articles

References

    1. Hewamana S., Dearden C. Treatment options for high-risk chronic lymphocytic leukaemia. Ther. Adv. Hematol. 2011;2:147–159. - PMC - PubMed
    1. Stilgenbauer S., Zenz T. Understanding and managing ultra high-risk chronic lymphocytic leukemia. Hematology. Am. Soc. Hematol. Educ. Program. 2010;2010:481–488. - PubMed
    1. Wong J.J.L., Gao D., Nguyen T.V., Kwok C.T., van Geldermalsen M., Middleton R., Pinello N., Thoeng A., Nagarajah R., Holst J., et al. Intron retention is regulated by altered MeCP2-mediated splicing factor recruitment. Nat. Commun. 2017;8 - PMC - PubMed
    1. Wong J.J.L., Ritchie W., Ebner O.A., Selbach M., Wong J.W.H., Huang Y., Gao D., Pinello N., Gonzalez M., Baidya K., et al. Orchestrated intron retention regulates normal granulocyte differentiation. Cell. 2013;154:583–595. - PubMed
    1. Ergun A., Doran G., Costello J.C., Paik H.H., Collins J.J., Mathis D., Benoist C., ImmGen Consortium Differential splicing across immune system lineages. Proc. Natl. Acad. Sci. USA. 2013;110:14324–14329. - PMC - PubMed