. 2024 Jun 7:13:RP93908.
doi: 10.7554/eLife.93908.

Targeted protein degradation systems to enhance Wnt signaling

Affiliations

Targeted protein degradation systems to enhance Wnt signaling

Parthasarathy Sampathkumar et al. Elife. .

Abstract

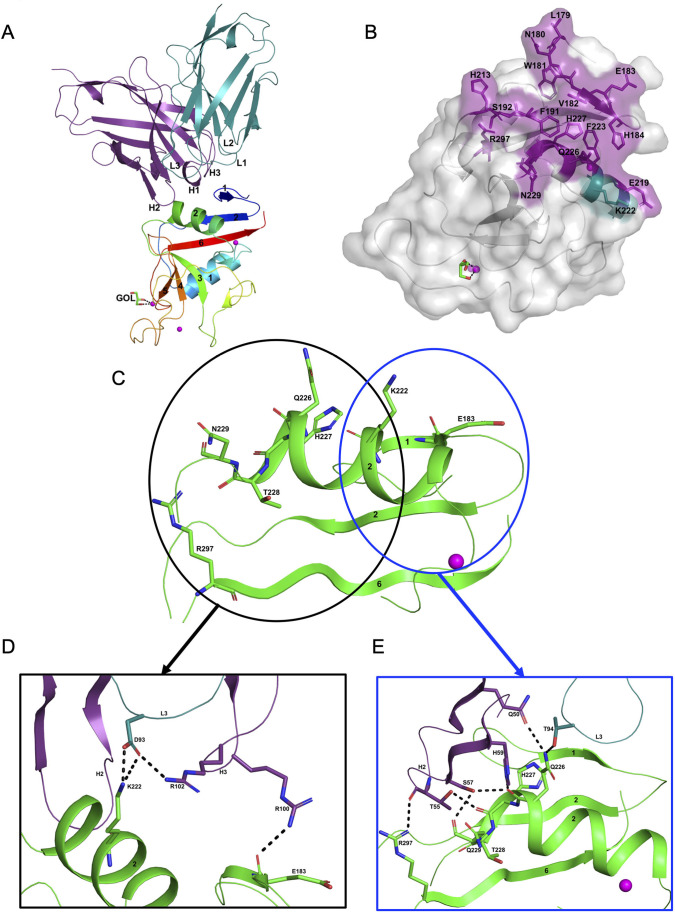
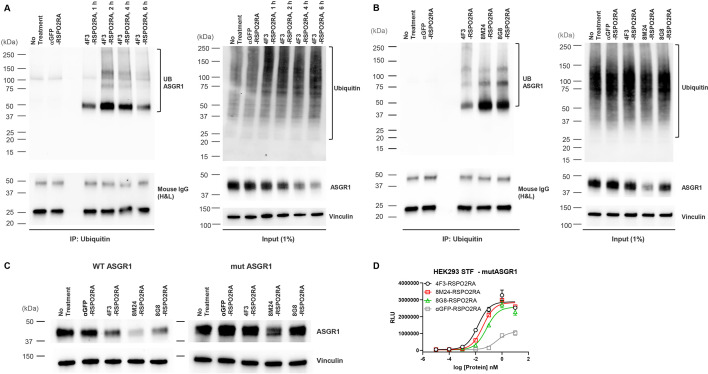
Molecules that facilitate targeted protein degradation (TPD) offer great promise as novel therapeutics. The human hepatic lectin asialoglycoprotein receptor (ASGR) is selectively expressed on hepatocytes. We have previously engineered an anti-ASGR1 antibody-mutant RSPO2 (RSPO2RA) fusion protein (called SWEETS) to drive tissue-specific degradation of ZNRF3/RNF43 E3 ubiquitin ligases, which achieved hepatocyte-specific enhanced Wnt signaling, proliferation, and restored liver function in mouse models, and an antibody-RSPO2RA fusion molecule is currently in human clinical trials. In the current study, we identified two new ASGR1- and ASGR1/2-specific antibodies, 8M24 and 8G8. High-resolution crystal structures of ASGR1:8M24 and ASGR2:8G8 complexes revealed that these antibodies bind to distinct epitopes on opposing sides of ASGR, away from the substrate-binding site. Both antibodies enhanced Wnt activity when assembled as SWEETS molecules with RSPO2RA through specific effects sequestering E3 ligases. In addition, 8M24-RSPO2RA and 8G8-RSPO2RA efficiently downregulate ASGR1 through TPD mechanisms. These results demonstrate the possibility of combining different therapeutic effects and degradation mechanisms in a single molecule.

Keywords: ASGR1; LYTAC; PROTAC; R-spondin; SWEETS; Wnt; biochemistry; chemical biology; none; regenerative medicine; stem cells.


Conflict of interest statement

PS, HJ, ZZ, ZH, TL, RB, WY former full-time employee and shareholder of Surrozen, Inc, HC, NS, YY, SL, JY current full-time employee and shareholder of Surrozen, Inc, YL current full-time employee and shareholder of Surrozen, Inc; is Executive Vice President of Research at Surrozen, Inc

Figures

Figure 1.
Figure 1.. Biolayer interferometry (BLI) profiles of antigen carbohydrate recognition domains (CRDs) to antibodies.
(A) Binding of hASGR1 to 8M24-IgG1; (B) non-binding of mASGR1, hASGR2, and mASGR2 to 8M24-IgG1; (C) binding of hASGR1 to 8G8-IgG1; (D) binding of hASGR2 to 8G8-IgG1; (E) binding of mASGR1 to 8G8-IgG1; and (F) binding of mASGR2 to 8G8-IgG1. Binding profiles for hASGR1, hASGR2, mASGR1, and mASGR2 are shown in brown, magenta, orange, and red traces, respectively.
Figure 1—figure supplement 1.
Figure 1—figure supplement 1.. 8M24 is specific to human ASGR1, and 8G8 binds to both ASGR1 and ASGR2 with mouse cross-reactivity.
(A) Interaction of 8M24-Fab with human and mouse ASGR1 and ASGR2 carbohydrate recognition domains (CRDs). The left-shifted peak, corresponding to complex formation, is observed only with hASGR1-CRD. (B) Interaction of 8G8-Fab with human and mouse ASGR1 and ASGR2 CRDs. The left-shifted peak, corresponding to complex formation, is observed for four proteins from human and mouse ASGR1 and ASGR2 CBDs. Elution time is shown on the x-axis, and the absorption unit on the y-axis is not to actual scale. Samples were analyzed on an Agilent AdvanceBio SEC 300 Å, 2.7 μm, 7.8 × 300 mm column, equilibrated with 20 mM HEPES (4-(2-hydroxyethyl) piperazine-1-ethane-sulfonic acid) pH 7.5, 150 mM sodium chloride, mounted on a Vanquish (Thermo Scientific, USA) UHPLC system.
Figure 2.
Figure 2.. Structure of the hASGR1:8M24 complex.
(A) A cartoon representation of the overall structure of the hASGR1CRD:8M24-Fab complex. The heavy and light chains of 8M24 are colored orange and olive, respectively, with their CDR loops marked as H1, H2, H3, L1, L2, and L3. hASGR1CRD is traced in blue to red from the N- to C-terminus. Three calcium ions are represented as magenta spheres. A glycerol molecule bound to the calcium ion at the ASGR substrate-binding site is highlighted in the stick representation. (B) The epitope of 8M24 highlighted on the surface of hASGR1. Antigen residues that are within 4.5 Å from 8M24 heavy and light chains are shown in orange and olive, respectively. (C) Residues of hASGR1 involved in polar interactions with the 8M24 antibody are shown in stick notation on the secondary structure elements (cyan traces) with most of the residues situated on the helix ∝1 of hASGR1. (D) A close-up view of polar interactions between 8M24 and hASGR1 near the N-terminus of helix ∝1. (E) A close-up view of polar interactions between 8M24 and hASGR1 near the C-terminus of helix ∝1.
Figure 3.
Figure 3.. Comparison of hASGR1:8M24 and hASGR2:8G8 complex structures.
(A) An alignment, made with MultAlin (Corpet, 1988) and ESPript (Gouet et al., 2003) of human, mouse, and rat ASGR1 and ASGR2 sequences with the secondary structure elements of hASGR1CRD (PDB code: 1DV8, Meier et al., 2000) depicted at the top and labeled according to the color scheme in Figure 1A. Paratope residues from the heavy and light chains of 8M24 are marked with orange and olive circles, respectively. Paratope residues from the heavy and light chains of 8G8 are marked with purple and teal circles, respectively. Important residues are highlighted with a magenta downward arrow. hASGR2 residue Ser172 is marked for reference to the sequence numbering. (B) A dot representation showing the snug-fit of hASGR1 Asn180 for the cavity formed by Phe91–Trp92–Gly93 (LCDR3 loop) and Asn32 (LCDR1 loop) of 8M24. hASGR1 Asn180 is replaced by either Lys or Gln in h/m/rASGR2 and m/rASGR1, respectively. (C) Superimposed structures of hASGR1:8M24 and hASGR2:8G8 complexes illustrating that the interaction surfaces of the antibodies are situated on the opposite surfaces of the antigens and are non-overlapping. The overall folds of hASGR1 and hASGR2 are shown in cyan and green, respectively, with their N- and C-terminus highlighted as blue and red spheres, respectively. Three calcium ions are represented as magenta spheres. A glycerol molecule bound to the calcium ion at the ASGR substrate-binding site is highlighted in stick representation.
Figure 4.
Figure 4.. Structure of the hASGR2:8G8 complex.
(A) A cartoon representation of the overall structure of the hASGR2CRD:8G8-Fab complex. The heavy and light chains of 8G8 are colored in purple and teal, respectively, with their CDR loops marked as H1, H2, H3, L1, L2, and L3. hASGR2CRD is traced in blue to red from the N- to C-terminus. Three calcium ions are represented as magenta spheres. A glycerol molecule bound to the calcium ion at the ASGR substrate-binding site is highlighted in stick representation. (B) The epitope of 8G8 highlighted on the surface of hASGR2. Antigen residues that are within 4.5 Å from the 8G8 heavy and light chains are shown in purple and teal, respectively. (C) Residues of hASGR2 involved in polar interactions with the 8G8 antibody are shown in stick representation on the secondary structure elements (green traces) with most of the residues situated on the ∝2 helix of hASGR2. (D) A close-up view of polar interactions between 8M24 and hASGR2 near the N-terminus of helix ∝2. (E) A close-up view of polar interactions between 8M24 and hASGR2 near the C-terminus of helix ∝2.
Figure 5.
Figure 5.. Both 8M24 and 8G8 RSPO2RA SWEETS molecules enhance Wnt signaling.
(A) Diagrams of the SWEETS molecules. RSPO2RA is fused at the N-terminus of the heavy chain of IgG. (B) Both 8M24 and 8G8 RSPO2RA SWEETS molecules enhance Wnt signaling in HuH-7 STF cells, which has the Wnt response reporter. (C, D) Compared to the negative control αGFP-RSPO2RA, both 8M24 and 8G8 RSPO2RA SWEETS molecules enhance Wnt signaling in ASGR1-overexpressed HEK293 STF cells (D), but not in parental HEK293 cells without ASGR1 overexpression (C). Data are representative of three independent experiments performed in triplicate and are shown as mean ± standard deviation (SD).
Figure 6.
Figure 6.. SWEETS induce degradation of ASGR1 in HuH-7 cells.
(A) Dose-dependent ASGR1 degradation promoted by different concentrations of 4F3-, 8M24-, and 8G8-RSPO2RA SWEETS for 24 hr. (B) Time-course of ASGR1 degradation upon treatment with 10 nM 4F3-, 8M24-, and 8G8-RSPO2RA. (C) Western blot analysis demonstrating the efficacy of ASGR1 degradation in cells treated with 4F3-, 8M24-, and 8G8-RSPO2RA SWEETS compared with ASGR1 antibodies lacking the RSPO2RA domain. (D) Western blot data showing the total protein levels of ASGR1, ubiquitin, and LC3B in HuH-7 cells pre-treated with dimethyl sulfoxide (DMSO), lysosomal pathway inhibitor bafilomycin A1 (Baf.A1), proteasome inhibitor MG132, and E1 ubiquitin ligase inhibitor TAK-243 to determine which degradation pathways govern ASGR1 degradation by SWEETS. Data in (A–C) are representative of three independent experiments, while data in (D) are representative of two independent experiments. For (A, B), total ASGR1 levels were normalized to generate graphs representing the mean of those three experiments. In (C), data are represented as mean ± standard error of the mean (SEM) of normalized total ASGR1 levels, and one-way analysis of variance (ANOVA) with Tukey’s post hoc test was used for statistical analysis. *p < 0.05, **p < 0.01.
Figure 6—figure supplement 1.
Figure 6—figure supplement 1.. ASGR1 degradation promoted by SWEETS was determined in an additional hepatocyte cell line, HepG2 cells.
(A) ASGR1 degradation induced by different concentrations of 4F3-, 8M24-, and 8G8-RSPO2RA showing the dose-response curves of SWEETS. (B) Time-course of ASGR1 degradation treated with 10 nM of 4F3-, 8M24-, and 8G8-RSPO2RA for 24 hr. (C) Western blot analysis results showing comparisons of ASGR1 degradation induced by SWEETS and ASGR1 antibody. (D) Total protein levels of ASGR1, ubiquitin, and LC3B in HepG2 cells pre-incubated with DMSO, lysosomal pathway inhibitor bafilomycin A1 (Baf.A1), proteasome inhibitor MG132, and E1 ubiquitin ligase inhibitor TAK-243 to determine the degradation pathway for SWEETS-mediated ASGR1 degradation. The western blot data in (A–C) are representative of three independent experiments, whereas the data in (D) are representative of two independent experiments. For (A, B), total ASGR1 levels were normalized by total loading control protein levels (Vinculin) to generate graphs representing the mean of those three experiments. For (C), data are represented as mean ± standard error of the mean (SEM) of normalized total ASGR1 levels, and one-way analysis of variance (ANOVA) with Tukey’s post hoc test was used for statistical analysis. **p < 0.01, ***p < 0.001.
Figure 7.
Figure 7.. SWEETS induce degradation of ASGR1 by recruitment of E3 ubiquitin ligase activity.
(A) Levels of total and immunoprecipitated ubiquitin and ASGR1 in HepG2 cells subjected to ubiquitin immunoprecipitation (IP) following treatment with 10 nM 4F3-RSPO2RA for the indicated time (1, 2, 4, and 6 hr). The controls (fresh media and 10 nM αGFP-RSPO2RA) were treated for 2 hr before harvest. (B) Levels of total and immunoprecipitated ubiquitin and ASGR1 in HepG2 cells subjected to ubiquitin IP following treatment with 10 nM 4F3-, 8M24-, 8G8-RSPO2RA or the controls (fresh media or 10 nM αGFP-RSPO2RA) for 2 hr. (C) Western blot analysis results demonstrating ASGR1 degradation in HEK293 STF cells transfected with wild-type ASGR1 and treated with SWEETS compared with cells transfected with mutant ASGR1 that lacks lysine in the cytoplasmic domain. The western blot data are representative of two independent experiments. (D) Mutating lysine residues in the cytoplasmic domain of ASGR1 does not affect ASGR1-dependent SWEETS activity. Data are representative of three independent experiments performed in triplicate and are shown as mean ± standard deviation (SD).

Update of

  • doi: 10.1101/2023.12.08.570758
  • doi: 10.7554/eLife.93908.1
  • doi: 10.7554/eLife.93908.2

Similar articles

Cited by

References

    1. Ahn G, Banik SM, Miller CL, Riley NM, Cochran JR, Bertozzi CR. LYTACs that engage the asialoglycoprotein receptor for targeted protein degradation. Nature Chemical Biology. 2021;17:937–946. doi: 10.1038/s41589-021-00770-1. - DOI - PMC - PubMed
    1. Alabi SB, Crews CM. Major advances in targeted protein degradation: PROTACs, LYTACs, and MADTACs. The Journal of Biological Chemistry. 2021;296:100647. doi: 10.1016/j.jbc.2021.100647. - DOI - PMC - PubMed
    1. Carmon KS, Gong X, Lin Q, Thomas A, Liu Q. R-spondins function as ligands of the orphan receptors LGR4 and LGR5 to regulate Wnt/beta-catenin signaling. PNAS. 2011;108:11452–11457. doi: 10.1073/pnas.1106083108. - DOI - PMC - PubMed
    1. Chen PH, Chen X, Lin Z, Fang D, He X. The structural basis of R-spondin recognition by LGR5 and RNF43. Genes & Development. 2013;27:1345–1350. doi: 10.1101/gad.219915.113. - DOI - PMC - PubMed
    1. Corpet F. Multiple sequence alignment with hierarchical clustering. Nucleic Acids Research. 1988;16:10881–10890. doi: 10.1093/nar/16.22.10881. - DOI - PMC - PubMed

MeSH terms

Substances