. 2024 Sep 14;111(3):580-599.
doi: 10.1093/biolre/ioae090.

Induction of in vivo-like ciliation in confluent monolayers of re-differentiated equine oviduct epithelial cells†

Affiliations

Induction of in vivo-like ciliation in confluent monolayers of re-differentiated equine oviduct epithelial cells†

Bart Leemans et al. Biol Reprod. .

Abstract

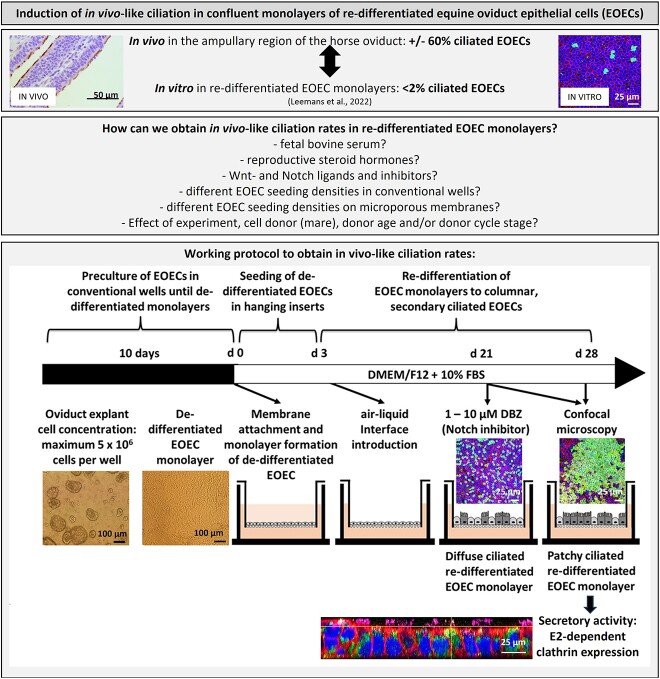
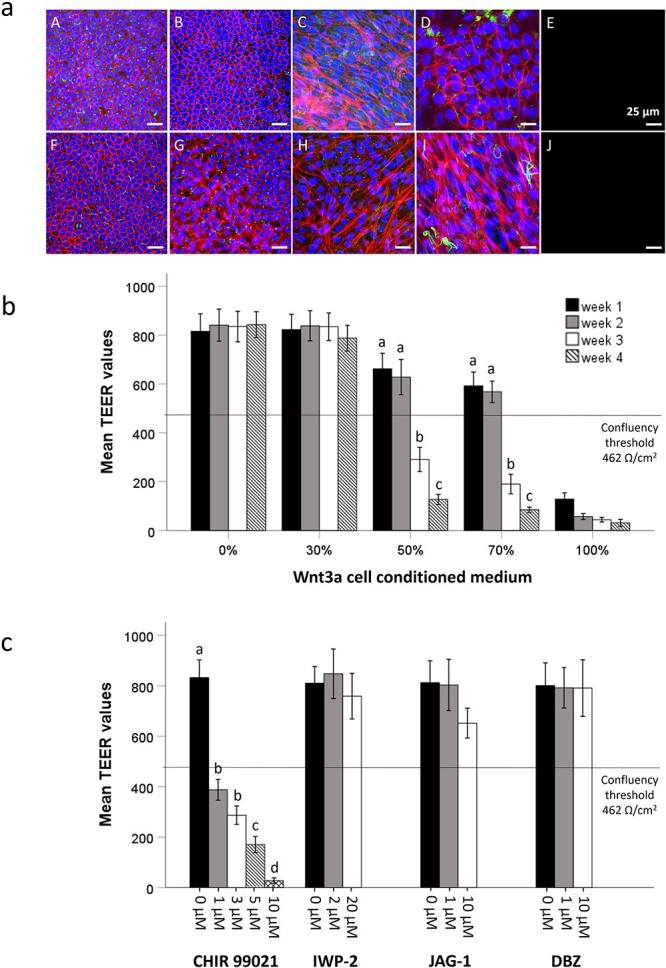
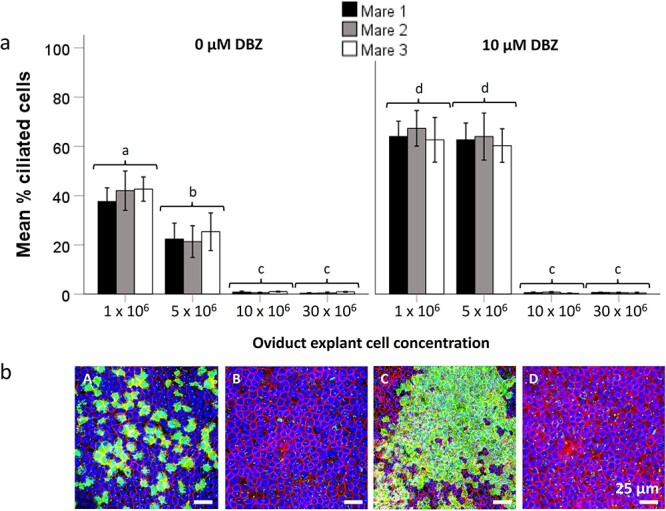
We recently developed re-differentiated equine oviduct epithelial cell (REOEC) monolayers demonstrating various in vivo morphological characteristics, but lacking secondary ciliation. In this study, we evaluated the effects of fetal bovine serum, reproductive steroid hormones, Wnt- and Notch ligands and inhibitors, and different EOEC seeding densities, in both conventional wells and on microporous membranes, on EOEC morphology and, in particular, secondary ciliation. REOEC monolayers were assessed by confocal microscopy after combined staining of nuclei, cilia, and the cytoskeleton. Only Wnt ligands, Notch inhibitors and oviduct explant cell concentration affected EOEC morphology. Undesirable epithelial-mesenchymal transition was observed in REOEC monolayers exposed to Wnt3a containing medium and Wnt ligand CHIR 99021. With respect to secondary ciliation, only the combined effect of oviduct explant cell concentration and Notch inhibition steered REOEC monolayers to in vivo-like ciliation patterns. De-differentiated EOECs, formed 10 days after oviduct explant cell seeding, were reseeded on inserts; only at initial oviduct explant cell concentrations of 1 and 5 × 10⁶ cells per well was the formation of REOEC monolayers with a high rate of diffuse ciliation supported. Within 1 month after air-liquid interface introduction, >40% and >20% of the REOECs showed secondary cilia, respectively. At higher oviduct explant cell seeding densities secondary ciliation was not supported after re-differentiation. Additionally, Notch inhibition helped boost secondary ciliation rates to >60% in REOEC monolayers with diffuse ciliation only. These monolayers demonstrated higher clathrin expression under follicular phase conditions. Overall, the ciliated REOEC monolayers better resemble in vivo oviduct epithelial cells than previous models.

Keywords: in vitro model; ciliation; horse; oviduct.


Conflict of interest statement

The authors have declared that no conflict of interest exists.

Figures

Graphical Abstract
Graphical Abstract
Figure 1
Figure 1
(a) Effect of cycle stage on the presence of secondary cilia in oviducts retrieved from mares in the luteal and follicular phases. Approximately 60% of the equine oviduct epithelial cells (EOECs) lining the ampullary oviductal lumen demonstrated the presence of secondary cilia regardless of whether oviducts were retrieved from mares in the luteal or follicular phase. Data are mean (± SD) percentage of EOECs displaying secondary cilia (n = 3 mares per cycle stage; 5 oviduct tissue sections per mare). (b) Representative immunohistochemistry pictures from oviduct sections in the (A) luteal and (B) follicular phase showing that more than 50% of cells of the in vivo oviduct epithelium are ciliated (secondary cilia are stained in red with the as visualized with the AEC chromogen) (scale bar: 20 μm).
Figure 2
Figure 2
(a) Effect of different concentrations of FBS in culture medium on the formation of secondary cilia in re-differentiating equine oviduct epithelial cells (EOECs) assessed one and two months after air-liquid interface (ALI) introduction. Secondary ciliation rates after 1 and 2 months of culture were low for all FBS concentrations tested. Data are mean (± SD) percentage of EOECs displaying secondary cilia (n = 3 mares; 3 inserts per mare per FBS concentration). (b) Effect of estradiol and progesterone to mimic estrous cycle phase on secondary cilia formation in re-differentiating EOECs, after 14 days of luteal (blood concentration: 20 pg/mL E2 and 10 ng/mL P4; oviduct concentration: 10 ng/mL E2 and 1000 ng/mL P4) and 7 days of subsequent follicular phase hormone exposure (blood concentration: 40 pg/mL E2 and 0 ng/mL P4; oviduct concentration: 80 ng/mL E2 and 40 ng/mL P4). Ethanol was used as the solvent for hormone supplementation at a final ethanol concentration of 1%. Tested hormone conditions did not have an effect on secondary ciliation rates and did not differ from the control treatment (culture without hormones). Data are mean (± SD) percentage of secondary ciliated EOECs (n = 3 mares; 3 inserts per mare per experimental condition).
Figure 3
Figure 3
(a) Representative images of re-differentiated equine oviduct epithelial cell (REOEC) monolayers cultured for 1 month in (A) 0%, (B) 30%, (C) 50%, (D) 70% and (E) 100% Wnt3a containing medium or for 7 days in (F) 0 μM, (G) 1 μM, (H) 3 μM, (I) 5 μM, and (J) 10 μM Wnt agonist CHIR 99021. No effect on cell or nucleus morphology was observed after 1 month culture in 30% Wnt3a containing medium. Epithelial-mesenchymal transition was observed within 1 month in re-differentiated EOEC monolayers cultured in 50 and 70% Wnt3a containing medium, with cells becoming elongated with enlarged round to oval nuclei, growing in multiple cell layers, and lacking primary cilia. A similar effect was observed after 1 week exposure to 1, 3, and 5 μM Wnt agonist CHIR 99021. The EOECs detached from the polycarbonate membrane in 100% Wnt3a conditioned medium and 10 μM Wnt agonist CHIR 99021. Moreover, none of the tested conditions supported cilia formation [green (anti-acetylated α-tubulin antibodies-AlexaFluor 488 secondary antibody): primary (single green dots at each EOEC) and secondary cilia (many green dots on some EOECs), red (phalloidin conjugated to Alexa Fluor 568): cytoskeleton, blue (Hoechst 33342): nuclei] (original magnification, 400x – scale bar: 25 μm). (b) The effect on transepithelial electrical resistance (TEER) of confluent re-differentiated EOEC monolayers cultured in 0%, 30%, 50%, 70%, and 100% Wnt3a containing medium after 1, 2, 3, and 4 weeks of incubation is shown. At 3 weeks, TEER values dropped below the confluency threshold (indicated by the horizontal line) in 50% and 70% Wnt3a containing medium; a similar observation was observed after 1 week in 100% Wnt3a containing medium (n = 3 mares; 1 insert per mare per concentration at each time point). Values that differ significantly between TEER values are indicated by small letters. (c) The effect on TEER of confluent re-differentiated EOEC monolayers exposed to CHIR 99021 (Wnt ligand; 0, 1, 3, 5, and 10 μM), IWP-2 (Wnt inhibitor; 0, 2, and 20 μM), JAG-1 (Notch ligand; 0, 1, and 10 μM) and DBZ (Notch inhibitor; 0, 1, and 10 μM) was assessed after 1 week. TEER values dropped below the confluency threshold (indicated by the horizontal line) under 1, 3, 5, and 10 μM CHIR 99021 conditions (n = 3 mares; 1 insert per mare for each concentration). Values that differ significantly between TEER values are indicated by small letters.
Figure 4
Figure 4
(a) Representative overview image of a spontaneously re-differentiated equine oviduct epithelial cell (REOEC) monolayer 21 days after air-liquid interface introduction [green (anti-acetylated α-tubulin antibodies-AlexaFluor 488 secondary antibody): primary (single green dots at each EOEC) and secondary cilia (many green dots on some EOECs), red (phalloidin conjugated to Alexa Fluor 568): cytoskeleton, blue (Hoechst 33342): nuclei] (original magnification, 100x – scale bar: 100 μm). (b) Two images of the same area of a REOEC monolayer, showing that (A) secondary cilia were present mainly in spontaneously REOEC monolayer areas with (B) a higher cell density (left of white line) (original magnification, 400x – scale bar: 25 μm). (b) The effect of varying seeding density of trypsinized de-differentiated EOECs from 0.1 to 10 × 105 cells per 0.33 cm2 insert membrane was assessed 1 month after air-liquid interface introduction. No relationship was observed between EOEC seeding density and secondary ciliation rates in spontaneously re-differentiated EOEC monolayers. Data are mean (± SD) percentage of secondary ciliated cells (n = 3 mares; 3 inserts per mare per seeding concentration).
Figure 5
Figure 5
Representative (a) bright field (differential interference contrast) light images of de-differentiated equine oviduct epithelial cell (EOEC) monolayers 10 days after oviduct explant seeding in conventional wells (magnification 100x – scale bar: 100 μm) and (b) fluorescent images of diffusely ciliated re-differentiated EOEC monolayers 1 month after air-liquid interface introduction in hanging inserts. If (A) 1 × 10⁶ or (B) 5 × 10⁶ oviduct explant cells were initially seeded in conventional wells to obtain de-differentiated EOEC monolayers, diffuse ciliated EOEC monolayers were obtained after re-differentiation. In contrast, seeding (C) 10 × 106 or (D) 30 × 106 oviduct explant cells resulted in monolayers with <2% ciliated EOEC after re-differentiation [green (anti-acetylated α-tubulin antibodies-AlexaFluor 488 secondary antibody): primary (single green dots at each EOEC) and secondary cilia (many green dots on some EOECs), red (phalloidin conjugated to Alexa Fluor 568): cytoskeleton, blue (Hoechst 33342): nuclei] (original magnification, 400x – scale bar: 25 μm). (c) The effect on secondary cilia formation of varying oviduct explant cell seeding concentration from 1 × 10⁶ to 30 × 106 cells per 9.6 cm2 well to establish de-differentiated EOEC monolayers, prior to re-differentiation with an air-liquid interface for 1 month. For comparison, in vivo ±60% of EOECs exhibit secondary cilia. Using a lower oviduct explant cell concentration to obtain de-differentiated EOEC monolayers was critical to obtaining spontaneously re-differentiated EOEC monolayers with secondary cilia in a diffuse pattern. Data are mean (± SD) percentages of secondary ciliated cells (n = 3 mares; 3 inserts per mare per seeding concentration). Values that differ significantly between EOEC concentration are indicated by small letters.
Figure 6
Figure 6
Effect of (a) estrous cycle phase mimicking hormone concentrations on diffusely ciliated re-differentiated equine oviduct epithelial cell (REOEC) monolayers, after 14 days of luteal (blood concentration: 20 pg/mL E2 and 10 ng/mL P4; oviduct concentration: 10 ng/mL E2 and 1000 ng/mL P4) and 7 days of subsequent follicular phase hormone exposure (blood concentration: 40 pg/mL E2 and 0 ng/mL P4; oviduct concentration: 80 ng/mL E2 and 40 ng/mL P4). Control treatment was REOEC monolayer culture without added hormones. Tested hormone conditions did not have an effect on secondary ciliation rates and did not differ from the control treatment (culture without hormones). Data are mean (± SD) percentage of secondary ciliated EOECs (n = 3 mares; 3 inserts per mare per experimental condition). Effect of (b) Wnt (0–1-5 μM CHIR 99021 and 0–2-20 μM IWP-2) and Notch (0–1-10 μM JAG-1 and 0–1-10 μM DBZ) ligands / inhibitors on diffusely ciliated REOEC monolayers. The Notch inhibitor DBZ enhanced secondary ciliation rates up to in vivo-like levels. This stimulatory effect on secondary ciliation was not observed after exposure to Wnt ligand or inhibitor, or the Notch agonist. Data are mean (± SD) percentage of secondary ciliated cells (n = 3 mares; 3 inserts per mare per experimental condition). Values that differ significantly between conditions are indicated by small letters.
Figure 7
Figure 7
(a) The combined effect of oviduct explant cell seeding concentration and Notch inhibition on secondary cilia formation. De-differentiated equine oviduct epithelial cells (EOECs) were obtained 10 days after seeding oviduct explant cells at concentrations varying from 1 to 30 × 106 cells per 9.6 cm2 well. Subsequently, secondary ciliation rates in re-differentiated EOEC monolayers were assessed 1 month after air-liquid interface introduction. During the last week of culture, EOEC monolayers were incubated in the absence or presence of 10 μM DBZ. A lower oviduct explant cell concentration to obtain de-differentiated EOEC monolayers supported a diffuse ciliation pattern after re-differentiation. Subsequent exposure to DBZ enhanced ciliation rates up to a patchy ciliation pattern showing ciliation rates similar to the in vivo situation (± 60% secondary ciliated EOECs; Figure 1). In contrast, initially seeding 10 or 30 × 106 oviduct explant cells resulted in <2% secondary ciliated EOECs after re-differentiation, irrespective of DBZ. Data are mean (± SD) percentage of secondary ciliated EOECs (n = 3 mares; 3 inserts per mare per seeding concentration). Values that differ between oviduct explant cell concentration are indicated by small letters. (b) Representative fluorescent images of re-differentiated EOEC monolayers 1 month after air-liquid interface introduction. To obtain (A) diffuse ciliated EOEC monolayers, a maximum seeding concentration of 5 × 10⁶ oviduct explant cells was required. Subsequent exposure to DBZ during re-differentiation supported the development of (C) in vivo-like patchy ciliated EOEC monolayers. (B, D), Higher oviduct explant cell seeding concentration did not support secondary ciliation, regardless of whether re-differentiated EOEC monolayers were exposed to DBZ [green (anti-acetylated α-tubulin antibodies-AlexaFluor 488 secondary antibody): primary (single green dots at each EOEC) and secondary cilia (many green dots on some EOECs), red (phalloidin conjugated to Alexa Fluor 568): cytoskeleton, blue (Hoechst 33342): nuclei] (original magnification, 400x – scale bar: 25 μm).
Figure 8
Figure 8
(a) Representative fluorescent images showing the secretory marker clathrin (green) in (A, F) in vivo oviduct tissue sections from mares in the luteal and follicular phase, respectively, and in re-differentiated EOEC monolayers after (B, C, D, E) 14 days of luteal (oviduct concentration: 10 ng/mL E2 and 1000 ng/mL P4) and (G, H, I, J) 7 days of subsequent follicular phase hormone exposure (oviduct concentration: 80 ng/mL E2 and 40 ng/mL P4). Higher clathrin expression was observed for re-differentiated EOEC monolayers exposed to follicular than to luteal phase hormone conditions; [pink (anti-acetylated α-tubulin antibodies-Alexa Fluor 647 secondary antibody): primary (single pink dots at each EOEC) and secondary cilia (many pink dots on some EOECs), green (anti-clathrin antibodies- Alexa Fluor 488 secondary antibody) red (phalloidin conjugated to Alexa Fluor 568): cytoskeleton, blue (Hoechst 33342): nuclei] (original magnification, 400x; A, F - scale bar: 50 μm; B, C, D, E, G, H, I, J – scale bar: 25 μm). (b) Cross sections through re-differentiated EOEC monolayers confirms higher clathrin expression after exposure to (B) follicular compared to (A) luteal phase hormonal conditions. Moreover, clathrin expression was observed in ciliated and non-ciliated EOECs. (C) Effect of estradiol and progesterone to mimic estrous cycle phase on mean clathrin fluorescence intensity per cell in re-differentiating EOECs, after 14 days of luteal and 7 days of subsequent follicular phase hormone exposure. Significantly higher clathrin expression in re-differentiated EOECs was observed after follicular phase hormone exposure. Data are mean (± SD) clathrin fluorescence intensity per cell (n = 3 mares; 3 inserts per mare per hormonal condition). Values that differ between clathrin fluorescence intensity per cell are indicated by small letters.

Similar articles

Cited by

References

    1. Karst AM, Drapkin R. Primary culture and immortalization of human fallopian tube secretory epithelial cells. Nat Protoc 2012; 7:1755–1764. - PMC - PubMed
    1. Lawson EF, Ghosh A, Blanch V, Grupen CG, Aitken RJ, Lim R, Drury HR, Baker MA, Gibb Z, Tanwar PS. Establishment and characterization of oviductal organoids from farm and companion animals†. Biol Reprod 2023; 108:854–865. - PMC - PubMed
    1. Thompson RE, Meyers MA, Veeramachaneni DNR, Pukazhenthi BS, Hollinshead FK. Equine Oviductal organoid generation and cryopreservation. Methods Protoc 2022; 5:31. - PMC - PubMed
    1. Dobrinski I, Jacob JR, Tennant BC, Ball BA. Generation of an equine oviductal epithelial cell line for the study of sperm-oviduct interactions. Theriogenology 1999; 52:875–885. - PubMed
    1. Thomas PGA, Ignotz GG, Ball BA, Miller PG, Brinsko SP, Currie B. Isolation, culture, and characterization of equine oviduct epithelial-cells in-vitro. Mol Reprod Dev 1995; 41:468–478. - PubMed